Abstract
Hepatic stellate cells (HSCs) play an important role in the initiation and development of liver fibrogenesis, and abnormal glucose metabolism is increasingly being considered a crucial factor controlling phenotypic transformation in HSCs. However, the role of the factors affecting glycolysis in HSCs in the experimental models of liver fibrosis has not been completely elucidated. In this study, we showed that glycolysis was significantly enhanced, while the expression of brain and muscle arnt-like protein-1 (Bmal1) was downregulated in fibrotic liver tissues of mice, primary HSCs, and transforming growth factor-β1 (TGF-β1)-induced LX2 cells. Overexpression of Bmal1 in TGF-β1-induced LX2 cells blocked glycolysis and inhibited the proliferation and phenotypic transformation of activated HSCs. We further confirmed the protective effect of Bmal1 in liver fibrosis by overexpressing Bmal1 from hepatic adeno-associated virus 8 in mice. In addition, we also showed that the regulation of glycolysis by Bmal1 is mediated by the isocitrate dehydrogenase 1/α-ketoglutarate (IDH1/α-KG) pathway. Collectively, our results indicated that a novel Bmal1-IDH1/α-KG axis may be involved in regulating glycolysis of activated HSCs and might hence be used as a therapeutic target for alleviating liver fibrosis.
Keywords: Bmal1, HSCs, glycolysis, IDH1, α-KG, liver fibrosis
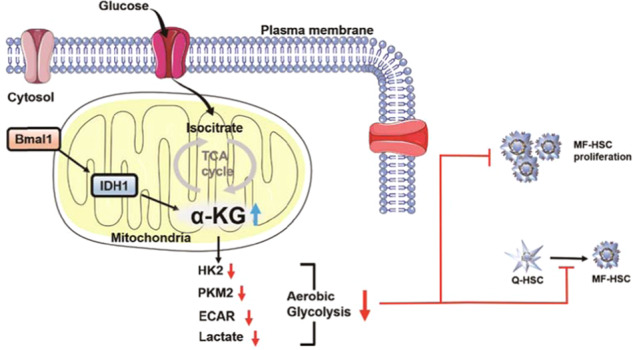
Mechanism via which Bmal1 inhibits proliferation and phenotypic transformation of hepatic stellate cells.
Introduction
Liver fibrosis is a compensatory repair process for various chronic liver injuries, including viral hepatitis, alcoholism, and metabolic diseases [1]. Liver fibrosis is the most important predictor of liver-related outcomes in patients with chronic liver disease, which is characterized by excessive deposition of extracellular matrix (ECM) or accumulation of scars [2]. Studies have shown that abnormal energy metabolism is related to the progression of liver fibrogenesis and the development of cirrhosis [3–5]. Thus, metabolic reprogramming plays a critical role in driving liver fibrosis. However, the molecular pathways linking metabolic conversion with progressive liver fibrogenesis are not clear, evidence highlights key opportunities to directly influence the fibrotic process.
HSC activation is a key step in liver fibrosis, which results in their acquisition of multiple high-energy functions, including increased proliferation, matrix production, and secretion [6]. Hence, aerobic glycolysis is enhanced in activated HSCs as an additional source of bioenergy and biosynthesis. A growing body of evidence shows that the abnormal glycolytic activity of activated HSCs is the main regulator of the dynamic fibrogenesis-fibrosis resolution paradigm [7–9]. However, the role of glycolysis in HSCs is still not completely understood. The mechanism via which glycolysis is regulated in HSCs may be multifactorial. Hence, it is important to understand the molecular mechanisms that control glycolysis in HSCs during liver fibrogenesis.
Brain and muscle arnt-like protein-1 (Bmal1) is a core coordinator of the molecular clock and an important transcription factor that regulates biological rhythm [10]. Bmal1 is widely involved in various metabolic, inflammatory, and immune diseases [11–13]. Bmal1 deletion can perturb tissue glucose metabolism and systemic glucose homeostasis [14]. Studies have shown that Bmal1 deficiency leads to increased activity of key glycolytic enzymes and lactic acid accumulation in liver tissues, embryonic fibroblasts [15], and macrophages [16], indicating that Bmal1 may be involved in the regulation of glycolysis. However, the role of Bmal1 in the glycolysis of HSCs in liver fibrosis remains largely undefined. Hence, understanding the molecular mechanism via which Bmal1 regulates liver fibrogenesis is critical. Reports have shown that α-ketoglutarate (α-KG) inhibits glycolysis, leading to metabolic bias toward oxidative phosphorylation [17]. Isocitrate dehydrogenase 1 (IDH1) is an NADP+-dependent enzyme that catalyzes the metabolism of isocitrate to α-KG. Xiang et al. showed that mutant IDH1 in cancer cells converts α-KG to 2-hydroxyglutarate (2-HG), thereby enhancing the glycolytic ability of cancer cells [18, 19]. However, the regulatory effect of Bmal1 on the IDH1/α-KG pathway has not been directly verified.
In this research, we investigated the protective effect of Bmal1 in a mouse model of CCl4-induced liver fibrosis. The role of Bmal1 in HSCs and its regulatory mechanism were analyzed in vitro and vivo. Our results demonstrated that Bmal1 inhibits the proliferation and phenotypic transformation of HSCs by IDH1/α-KG-mediated glycolysis. Our observations highlight the anti-fibrosis effect of Bmal1, which may provide a novel therapeutic strategy for liver fibrosis.
Materials and methods
Animal procedures and treatments
Animal experimental procedures were approved by the Institutional Animal Experimental Ethics Committee. Forty male C57 mice (6 weeks old) were obtained from the Laboratory Animal Center of Anhui Medical University. The mice were housed under standardized conditions at 20 ± 2 °C, 40% ± 5% relative humidity, and 12 h light/dark cycle. The liver fibrosis model was generated by intraperitoneal injecting 10% CCl4 (diluted in olive oil) twice a week at a dose of 1 mL/kg body weight for 4 weeks. Vehicle mice were injected intraperitoneally with the same volume of olive oil at the same time intervals. Forty mice were randomly divided into four groups (n = 10): (1) control, (2) model, (3) Bmal1 adenovirus empty vector, and (4) Bmal1 plasmid adenovirus (constructed by Hanbio Biotechnology Co., Ltd, Shanghai, China). Mice in groups 3 and 4 received injection of the corresponding adenovirus once via the caudal vein. After a week, mice in groups 2–4 were intraperitoneally injected with CCl4 twice a week for 4 weeks. After 4 weeks, all mice were anesthetized with chloral hydrate, followed by blood collection via the retro-orbital sinus and liver isolation. All animal procedures were performed in accordance with the Guidelines for Care and Use of Laboratory Animals of the Anhui Medical University and were approved by the Animal Ethics Committee of Anhui Medical University (Hefei, China) (No: LLSC20200977). All possible efforts were made to minimize the number of animals used and their suffering.
Sample preparation and ultra-performance liquid chromatography–mass spectrometry (UPLC-MS)
Liver samples (50 mg) were homogenized in 500 µL pre-cooled extractant (70% methanol aqueous solution). The samples were then vortexed for 5 min and centrifuged with 12,000 rpm at 4 °C for 10 min. Finally, 200 μL supernatant was placed in the sample bottle for LC–MS/MS analysis. The sample extracts were analyzed using an LC-electrospray ionization (ESI)–MS/MS system (UPLC, Shim-pack UFLC SHIMADZU CBMA system; MS, QTRAP System). The analytical conditions were as follows, UPLC: column, SeQuant ZIC-pHILIC 5 µm (2.1 × 100 mm); column temperature, 40 °C; flow rate, 0.3 mL/min; injection volume, 2 μL; solvent system, 5 mmol/L ammonium acetate, 5 mmol/L ammonia solution, and acetonitrile; gradient program, 5:95 v/v at 0 min, 30:70 v/v at 3.0 min, 50:50 v/v at 10.0 min, hold for 1 min, 5:95 v/v at 11.1 min, maintain 3 min to the end.
The ESI source operation parameters were as follows: source temperature, 450 °C; ion spray voltage (IS), 5500 V (positive) and −4500 V (negative); ion source gas I (GSI), gas II (GSII), curtain gas (CUR) were set at 40, 55, and 35.0 psi, respectively; the collision gas (CAD) was medium. In the Qtrap, each ion pair is scanned according to the optimized declustering potential and collision energy.
Isolation of primary HSCs
Mice were randomly selected from the excipient (vehicle) group and the CCl4-induced liver fibrosis group. Primary HSCs were extracted via pronase/collagenase perfusion and differential centrifugation. Briefly, after the mice were anesthetized with isoflurane, the catheter was inserted into the portal vein, the inferior vena cava was cut, and the liver was perfused with digestive buffer (1× PBC supplemented with type IV, pronase and 476 mM CaCl2) collagenase to destroy the liver. The cell suspension was filtered to remove residual fragments, and the Nycodenz mixture covered with Hanks’ buffer was used to regulate the density of the cell suspension. The white cell layer on the extraction interface was collected via gradient centrifugation for subsequent studies.
Histopathology
The middle part of the left lobe of the liver of each C57 mice was excised and perfused with 4% paraformaldehyde for 48 h, fixed, and embedded in paraffin. The sections (5 μm thick) were stained with hematoxylin and eosin (H&E) staining, Masson’s trichrome staining, and Sirius-red staining followed by morphological analysis and localization of collagen expression according to the standard protocols.
Immunofluorescence staining
Liver tissue sections or treated cells were sealed with 10% bovine serum albumin blocking solution, incubated overnight with polyclonal primary antibodies for alpha smooth muscle actin (αSMA) (1:100), Bmal1 (1:100), and PKM2 (1:100), and then incubated with secondary antibodies for 2 h. 4′,6‐Diamidino‐2‐phenylindole was used to stain the nucleus at room temperature. All images were captured using a fluorescence microscope (Olympus, Tokyo, Japan).
Cell culture
The Human HSC line, LX2, was obtained from the Cell Bank of the Chinese Academy of Sciences (Shanghai, China). Cells were cultured in Dulbecco’s modified Eagle’s medium (DMEM, HyClone) containing 10% fetal bovine serum (Gibco, USA) and 1% penicillin–streptomycin in a 5% CO2 humidified atmosphere at 37 °C. The overexpression plasmid was transfected using the Lipofectamine 2000 transfection reagent (Invitrogen, USA) according to the manufacturer’s instructions.
Western blotting
Mouse liver tissues, primary HSCs, and LX2 cells were lysed in radio immunoprecipitation assay buffer for protein extraction. The protein concentration of the extract was determined using the bicinchoninic acid protein analysis kit (Beyotime, China). Equal amounts of protein were electrophoresed on SDS-PAGE and blotted onto polyvinylidene difluoride (PVDF) membranes (Millipore Corp, Billerica, MA, USA). After blocking with 5% non-fat milk in Tris-buffered saline-Tween 20 (TBST) for 3 h, the PVDF membranes were washed with TBST buffer at least thrice and incubated overnight with the primary antibodies at 4 °C. On the second day, the PVDF membranes were incubated at 37 °C for 1 h with horseradish peroxidase-conjugated secondary antibodies (1:10000). After washing thrice with TBST, the immunoreactive bands were detected using an enhanced chemiluminescence kit (ECL-plus, Thermo Scientific, USA). The primary antibodies used were as follows: Bmal1 (Ab-DF10308, Affinity Bioscience, USA); αSMA (55135-1-AP, Proteintech, Wuhan, China); COL1α1(67288-1-lg, Proteintech, Wuhan, China); PFKP (13389-1-AP, Proteintech, Wuhan, China); PKM2(15822-1-AP, Proteintech, Wuhan, China); HK2 (66974-1-lg, Proteintech, Wuhan, China); IDH1 (ab230949, Abcam, UK); β-actin (bs-0061R, Bioss, Beijing, China).
Co-immunoprecipitation (co-IP) assays
Proteins were extracted using a co-IP kit. Anti-IDH1 and Bmal1 antibodies were added to the protein extract and incubated overnight at 4 °C, followed by precipitation with protein G Sepharose beads. The beads were washed thrice with 1.5 mL IP buffer and eluted, and the immune complex was used for Western blotting.
Total RNA extraction and quantitative reverse transcription-polymerase chain reaction (qRT-PCR)
Total RNA was extracted from LX2 cells, and mouse liver tissues samples using TRIzol reagents (Invitrogen, USA). After reverse transcription, real-time PCR was performed to quantify mRNA expression using the SYBR Green Master Mix (Bio-Rad, USA) according to the manufacturer’s protocol. Fold changes in the mRNA levels of target genes were related to the invariant control β-actin.
Flow cytometry
The distribution of cell cycle was analyzed by propidium iodide (PI) staining and flow cytometry. LX2 cells were seeded in six‐well plates. Then, the cells were collected into flow cytometry tubes and centrifuged at 2000 r/min for 5 min to obtain cell pellets. For cell cycle analysis, the collected cells were washed with cold PBS and fixed in 70% ethanol at 4 °C for 1 h or overnight at −20 °C. The fixed cells were washed with PBS, incubated with Rnase A (0.1 mg/mL) for 30 min, followed by incubation with PI (50 mg/mL) for 30 min at room temperature. Cell cycle analysis was performed using a Coulter Epics XL Flow Cytometry System (Beckman‐Coulter, Miami, FL). Cell cycle phases were determined using the Modfit software (Verity Software House, Topsham, ME).
Measurement of extracellular acidification rate (ECAR)
The Agilent Seahorse XF Glycolysis Stress Test Assay Kit (Agilent, Cat. No.:103020-100) was used to detect the ECAR of glycolysis. The probe plate was hydrated with a seahorse XF calibration solution in a carbon dioxide-free incubator. LX2 cells were inoculated in a XF24 cell culture microplate (Hippocampal Bioscience) at 8000 cells/well (ECAR for measuring glycolysis) and allowed to adhere overnight. The prepared detection solution was used instead of cell culture medium and incubated in a 37 °C CO2-free incubator for 1 h. Finally, ECAR of glycolysis was determined and analyzed using an Agilent Seahorse Bioscience XF24 extracellular flux analyzer (Agilent Technologies) according to the manufacturer’s instructions (Seahorse Bioscience, North Billerica, MA, USA).
Enzyme activity assay
The intracellular activities of alanine aminotransferase (ALT), aspartate aminotransferase (AST), and lactate dehydrogenase in LX2 cells and mice serum were determined using kits (Nanjing Jiancheng Bioengineering Institute, Nanjing, China) according to the manufacturer’s protocols.
Cell viability assay
The viability of LX2 cells treated with 2-DG or overexpression plasmid was evaluated using the 3-(4,5-dimethylthiazol-2-yl)-2,5-diphenyltetrazolium bromide (MTT) assay. Briefly, the medium of treated cells was replaced with 100 μL phosphate buffered saline containing 0.5 mg/mL MTT and then was incubated at 37 °C for 4 h. The crystals were dissolved in 200 μL dimethyl sulfoxide. The spectrophotometric absorbance at 490 nm was measured by a Multiskan MK3 (Biotek, USA).
Enzyme-linked immunosorbent assay (ELISA)
The concentrations of α-KG in human hepatic stellate cells and mouse tissues were determined by α-ketoglutaric acid kit (Shanghai Enzyme Biotechnology Co., Ltd.). Optical density values were measured at 450 nm. All experiments were repeated thrice.
Statistical analysis
All data are presented as mean ± standard deviation. GraphPad Prism 7.0 was used to perform one-way analysis of variance and Student’s t test to compare the differences among multiple groups. P < 0.05 indicated statistical significance.
Results
Metabolism was reprogrammed in mice with CCl4-induced liver fibrosis
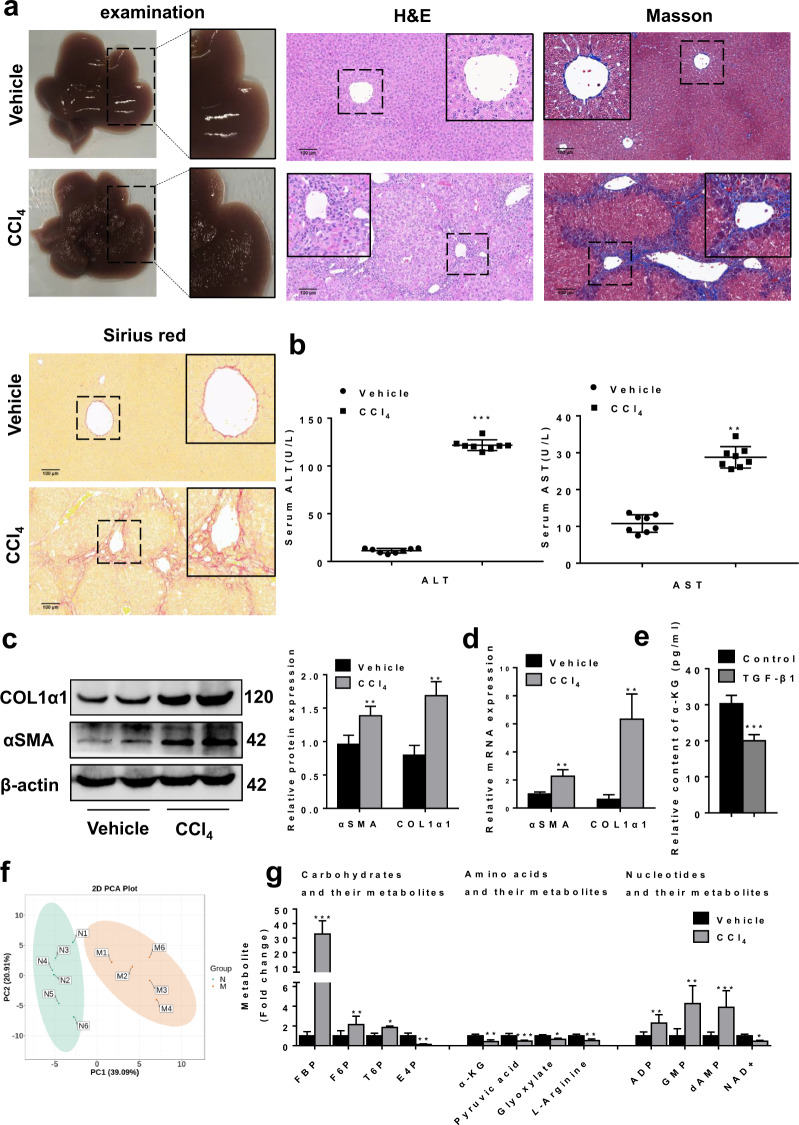
Histopathological studies were performed to assess the degree of liver fibrosis in CCl4-induced C57BL/6J mice. H&E staining, Masson’s trichrome staining, and Sirius-red staining showed that compared to the vehicle-treated mice, CCl4 injection significantly induced liver fibrosis due to steatosis, inflammatory cell infiltration, necrosis, formation of fibrous septum of proliferated collagen fibers, and the destruction of normal liver lobular structure (Fig. 1a). ALT and AST activities in mice with liver fibrosis showed an ascending trend (Fig. 1b), accompanied by increased expression of the myofibroblastic markers, αSMA and type I collagen (COL1α1) (Fig. 1c, d). These results indicated that the model of liver fibrosis was successfully established.
Fig. 1. Establishment of liver fibrosis model induced by CCl4 in C57 mice.
a Pathological observation of liver tissue sections of mice with fibrosis stained with H&E, Masson staining, and Sirius-red staining. b Serum ALT and AST levels (n = 8). c Protein and d mRNA levels of αSMA and COL1α1. e The concentration of metabolite α-KG in LX2 cells was detected by ELISA. f The 2D PCA score scatter plot from five mice with liver fibrosis and six control mice. g Relative concentrations of carbohydrates and their metabolites, amino acids and their metabolites, nucleotides and their metabolites in mice with liver fibrosis and vehicle mice. Data are shown as the mean ± SD (n = 3) of one representative experiment; *P < 0.05, **P < 0.01, ***P < 0.001 vs. vehicle mice.
We performed widely targeted metabolic profiling of tissue samples from CCl4-induced fibrotic liver. The principal component analysis (PCA) score plots were readily divided into two clusters (Fig. 1f), indicating that compared to that in the livers in the vehicle group, tissue metabolic states changed significantly in CCl4-induced fibrotic liver. Subsequently, we further analyzed 67 metabolites using HPLC-HRMS, among which 12 metabolites showed significant changes, including carbohydrates and their metabolites, nucleotides and their metabolites, and amino acids and their metabolites. It is noteworthy that the concentration of glycolytic metabolites such as fructose 1,6-biphosphate (FBP) was high, whereas that of α-KG, a metabolic intermediate of the tricarboxylic acid cycle (TCA) was low in CCl4-treated mice (Fig. 1g). The above results revealed that glycolysis increased during liver fibrogenesis. α-KG is a key metabolite that can reverse the upregulation of hypoxia inducible factor (HIF-1) and its downstream transcriptional targets, leading to attenuation of glycolysis [19, 20]. Furthermore, as shown in Fig. 1e, the concentration of α-KG decreased in TGF-β1-induced LX2 cells.
Glycolysis controls phenotypic transformation in activated HSCs
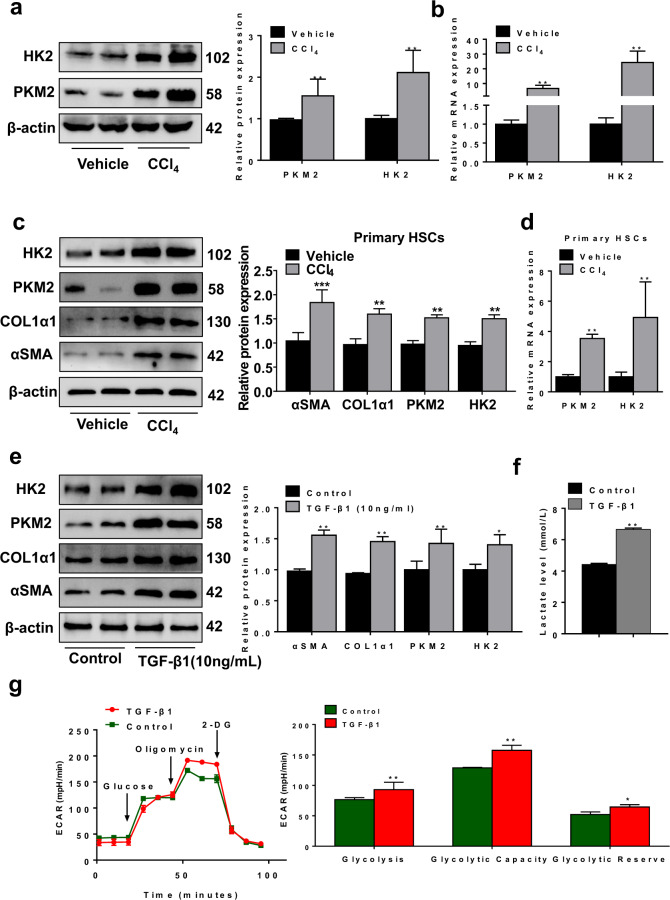
Reports showed that aerobic glycolysis, similar to the Warburg effect described in cancer cells, is essential for reprogramming quiescent HSCs into activated HSCs [7]. Results of Western blotting and qRT-PCR analysis demonstrated that the levels of key glycolytic enzymes increased significantly in the fibrotic liver and primary HSCs induced using CCl4 (Fig. 2a–d). In addition, the levels of the key glycolytic enzymes, ECAR, and lactate levels markedly increased in LX2 cells treated with TGF-β1 (10 ng/mL) for 24 h (Fig. 2e–g). Next, we investigated functional changes in activated HSCs, particularly during the development of liver fibrogenesis and observed that αSMA and COL1α1 were synchronously upregulated (Fig. 2c, e).
Fig. 2. Enhanced glycolysis in activated HSCs.
a Protein and b mRNA levels of glycolytic enzymes, hexokinase (HK2) and pyruvate kinase M2 (PKM2) in CCl4‐treated liver tissues. c Protein and d mRNA levels of HK2 and PKM2 in primary hepatic stellate cells. e Protein levels of HK2, PKM2, COL1α1, and αSMA in activated LX2 cells. f Extracellular lactate levels of LX2 cells treated with TGF-β1. g Real-time ECAR of LX2 cells treated with TGF-β1 was detected by the Agilent’s Seahorse Bioscience XF24 Extracellular Flux Analyzer. Data are shown as the mean ± SD (n = 3) of one representative experiment; *P < 0.05, **P < 0.01, ***P < 0.001 vs. vehicle mice (control group).
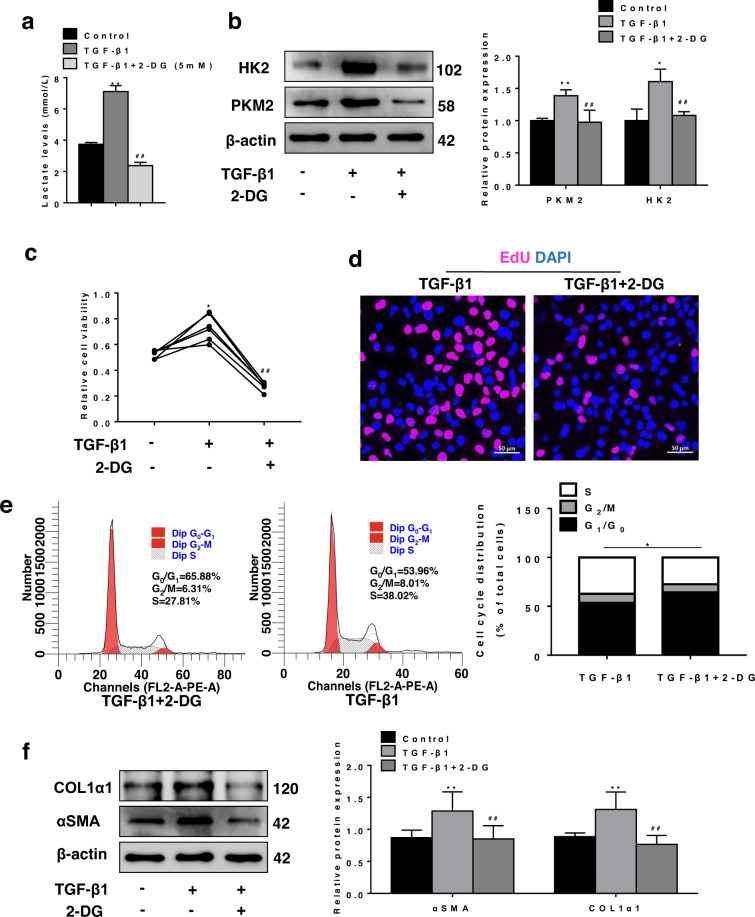
To further confirm whether glycolysis can regulate the phenotypic transformation of HSCs. TGF-β1-induced LX2 cells were plated on a medium containing a low dose of the competitive glycolysis inhibitor, 2-DG. Our results showed that 2-DG downregulate the levels of lactic acid and key glycolytic enzymes in activated LX2 cells (Fig. 3a, b and Supplementary Fig. S1a, b). The results of MTT assay and EdU staining showed that 2-DG decreased the viability and proliferation of TGF-β1-induced LX2 cells (Fig. 3c, d). In addition, flow cytometer demonstrated that 2-DG induced cell cycle arrest in the G0/G1 phase in TGF-β1-induced LX2 cells (Fig. 3e). These results suggested that inhibition of glycolysis can reduce the proliferation of TGF-β1-induced LX2 cells. Thus, modulation of glycolysis may be an important complementary pathway for preventing phenotypic transformation of activated HSCs. Next, we investigated whether glycolysis was associated with the severity of liver fibrosis. Western blotting and qRT-PCR analysis revealed that 2-DG decreased the expression of αSMA and COL1α1 (Fig. 3f and Supplementary Fig. S1c, d). Collectively, these data demonstrated that glycolysis was enhanced during the phenotypic transformation of HSCs.
Fig. 3. Effect of glycolysis inhibitor 2-DG on activated LX2 cells.
a Extracellular lactate levels of TGF-β1-induced LX2 cells inoculated in medium containing low-dose competitive glycolysis inhibitor 2-deoxy-d-glucose (2-DG). b Protein levels of HK2 and PKM2. c Relative cell viability of LX2 cells was measured by MTT assay. d Detection of proliferation (EdU incorporation) in LX2 cells by immunofluorescence. e Effect of 2-DG on the cell cycle of TGF-β1-activated LX2 cells was determined by flow cytometry. f Protein levels of αSMA and COL1α1. Data are shown as the mean ± SD (n = 3) of one representative experiment; *P < 0.05, **P < 0.01 vs. control group; #P < 0.05, ##P < 0.01 vs. TGF-β1-stimulated group.
Bmal1 was downregulated in mouse fibrotic liver tissues, primary HSCs, and TGF-β1-induced HSCs
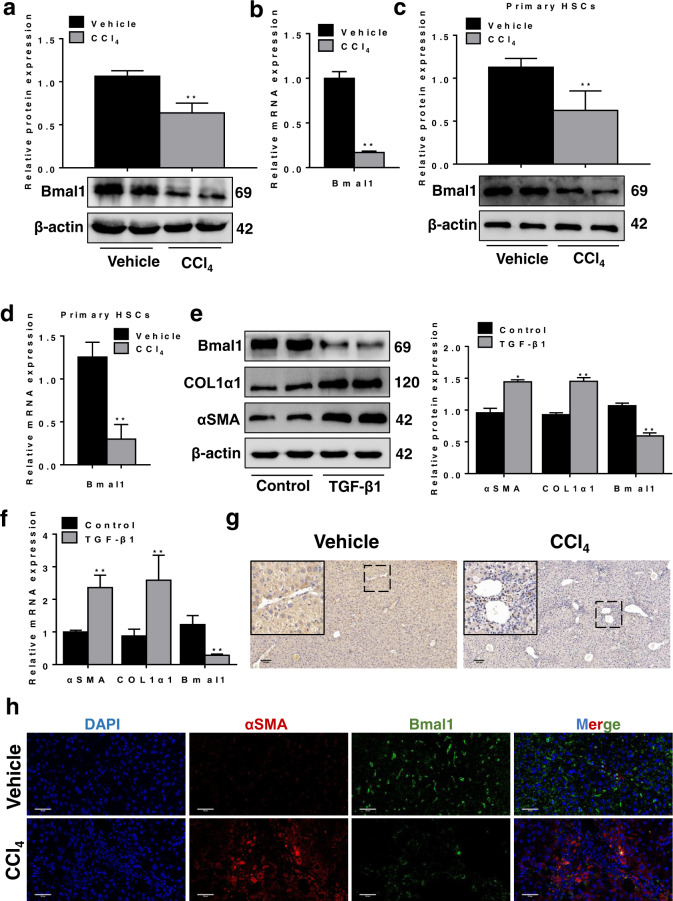
Bmal1 plays an important role in regulating glucose homeostasis [10, 21]. The results of qRT-PCR and Western blotting showed that the expression of Bmal1 in liver fibrotic tissues, primary HSCs, and TGF‐β1‐induced LX2 cells was significantly lower than that in the control groups (Fig. 4a–f). Similar changes were also observed in immunohistochemistry analysis after induction of liver fibrosis in C57 mice (Fig. 4g). Importantly, the double immunofluorescence staining showed typical co-localization of Bmal1 and αSMA of HSCs in liver tissue, implying that Bmal1 was expressed in activated HSCs (Fig. 4h).
Fig. 4. Downregulated expression of Bmal1 in vivo and in vitro.
a, c, e Protein and b, d, f mRNA levels of Bmal1 in CCl4‐treated liver tissues, primary HSCs and activated LX2 cells. g Immunohistochemistry signals of Bmal1 in mice fibrotic tissues. h Immunofluorescence with Bmal1 and αSMA were performed to determine the co-localization of αSMA (red) and Bmal1(green) in mice fibrotic tissues. Data are shown as the mean ± SD (n = 3) of one representative experiment; *P < 0.05, **P < 0.01 vs. control group.
Bmal1 regulated phenotypic transformation in TGF-β1-induced HSCs by inhibiting glycolysis
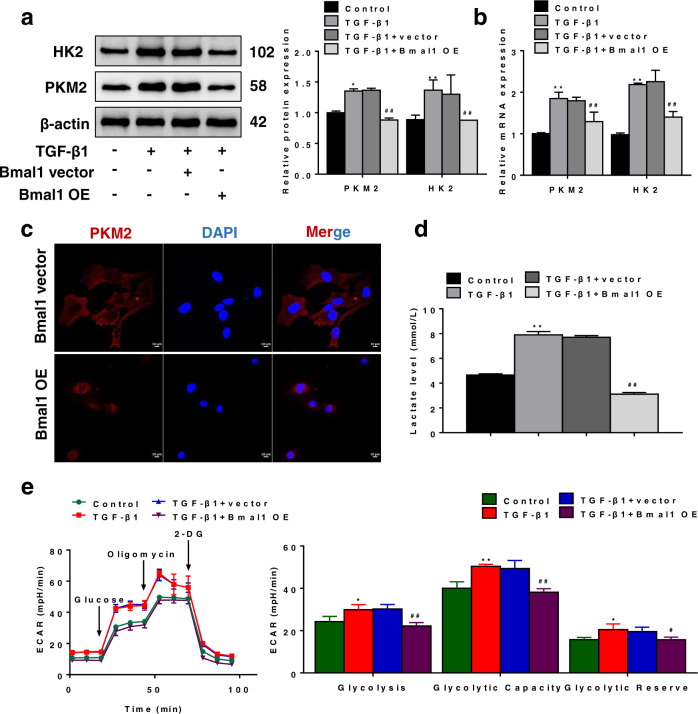
To investigate the mechanisms via which Bmal1 regulates HSC glycolysis, we transfected Bmal1 overexpressing plasmids in TGF‐β1‐induced LX2 cells. The expression of the key glycolytic enzymes HK2 and PKM2 decreased significantly, as observed in Western blotting (Fig. 5a), qRT-PCR (Fig. 5b), and immunofluorescence staining (Fig. 5c). In addition, overexpression of Bmal1 inhibited lactate levels and ECAR in TGF-β1-stimulated LX2 cells (Fig. 5d, e). Taken together, these results indicated that Bmal1 can inhibit glycolysis in activated HSCs.
Fig. 5. Overexpression of Bmal1 inhibits glycolysis.
a Protein and b mRNA levels of PKM2 and HK2 in LX2 cells after transfection of Bmal1 plasmid. c PKM2 protein expression in LX2 cells after transfection of Bmal1 plasmid was examined by immunofluorescence. d Extracellular lactate levels of LX2 cells after transfection of Bmal1 plasmid. e Real-time ECAR of LX2 cells was detected by the Agilent’s Seahorse Bioscience XF24 Extracellular Flux Analyzer. Data are shown as the mean ± SD (n = 3) of one representative experiment; *P < 0.05, **P < 0.01 vs. control group; #P < 0.05, ##P < 0.01 vs. vector group.
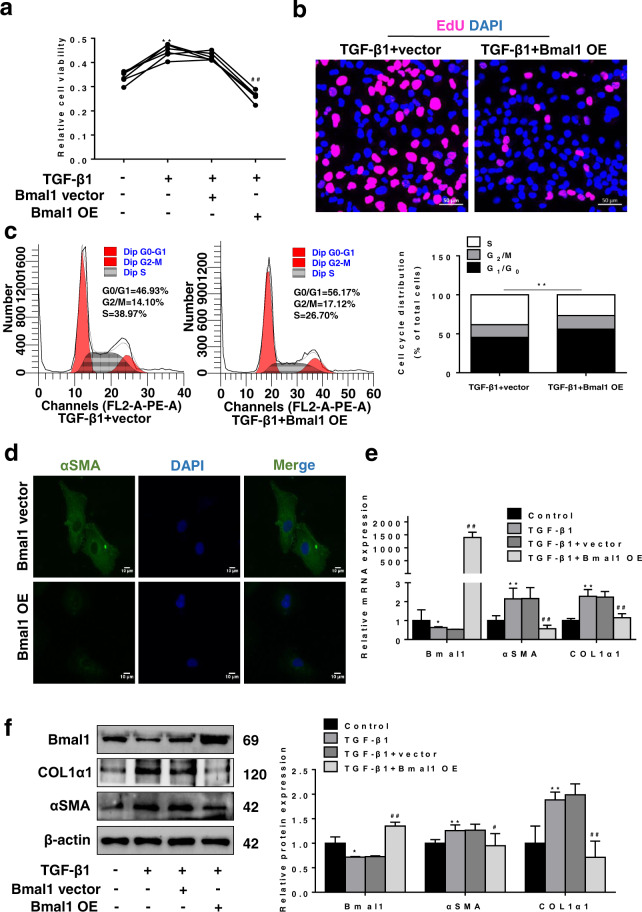
We investigated the effect of Bmal1 on the phenotypic transformation of HSCs. The results of MTT and EdU staining of LX2 cells overexpressing Bmal1 cultured in medium containing TGF-β1 for 24 h showed that Bmal1 overexpression decreased the viability of activated HSCs and inhibited their proliferation (Fig. 6a, b). In addition, cell cycle analysis suggested that the Bmal1 overexpression led to reduction in the S phase population (Fig. 6c) and reverted the fibroblast phenotype, which is characterized by decrease in αSMA and COL1α1 levels (Fig. 6d–f). Collectively, these data demonstrated that Bmal1 may regulate the phenotypic transformation of activated HSCs by inhibiting glycolysis.
Fig. 6. Overexpression of Bmal1 regulates the phenotypic transformation of activated HSCs.
a Relative cell viability of LX2 cells treated with Bmal1 plasmid was measured by MTT assay. b Detection of proliferation (EdU incorporation) in LX2 cells after transfection of Bmal1 plasmid by immunofluorescence. c Effect of overexpression of Bmal1 on cell cycle of activated LX2 cells detected by flow cytometry. d αSMA protein expression in LX2 cells was examined by immunofluorescence. f Protein and e mRNA levels of Bmal1, COL1α1, and αSMA in LX2 cells. Data are shown as the mean ± SD (n = 3) of one representative experiment; *P < 0.05, **P < 0.01 vs. control group; #P < 0.05, ##P < 0.01 vs. vector group.
Bmal1 inhibited HSCs glycolysis by targeting IDH1/α-KG
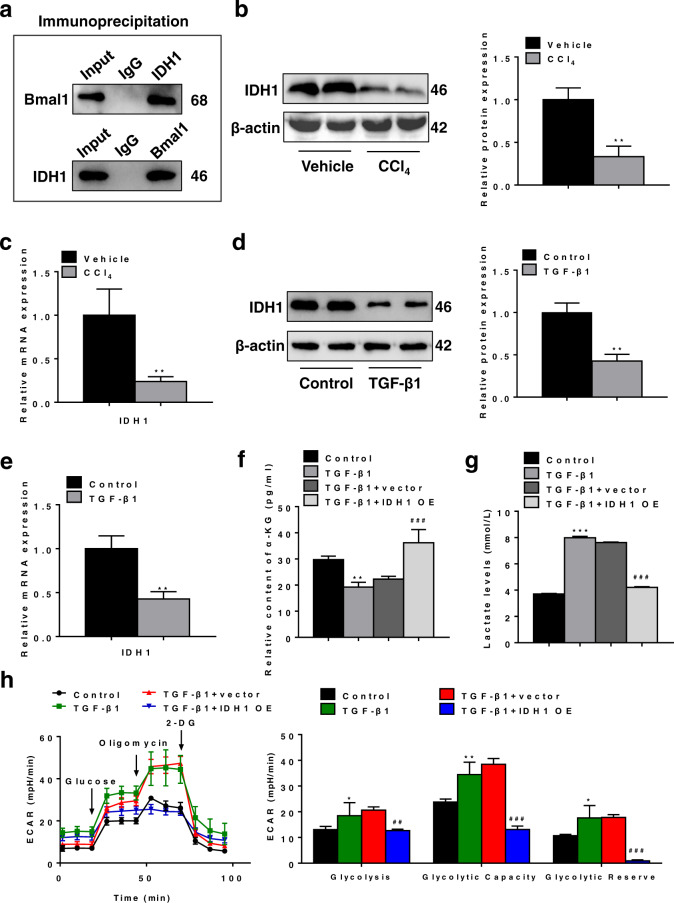
To understand the mechanisms via which Bmal1 acts on the glucose metabolism of HSCs, we developed a screening strategy for potential Bmal1-interacting proteins (Supplementary Fig. S2a). Co-IP/Western blotting using TGF‐β1‐induced LX2 cells showed that Bmal1 was enriched in the IDH1 co-immunoprecipitation (Fig. 7a). IDH1 is a critical metabolic enzyme that converts isocitrate to α-KG. Western blotting and qRT-PCR revealed a significant decrease in the expression of IDH1 in fibrotic liver and TGF-β1-induced LX2 cells (Fig. 7b–e). To analyze the role of IDH1 in activated HSCs, we further assessed the effects of IDH1 overexpression on the glucose metabolism of activated HSCs in vitro. We observed that overexpression of IDH1 significantly increased the production of its catalytic product, α-KG (Fig. 7f), and decreased lactate levels and ECAR of TGF-β1-induced LX2 cells (Fig. 7g, h). In general, the above results suggested that IDH1/α-KG is involved in glycolysis of TGF-β1-induced LX2 cells.
Fig. 7. Overexpression of IDH1 promotes the production of α-KG to inhibit glycolysis.
a Co-IP of Bmal1 and IDH1 in activated LX2 cells using the anti-IDH1 antibody and anti-Bmal1 antibody, respectively. b, d Protein and c, e mRNA levels of IDH1 in CCl4‐treated liver tissues and activated LX2 cells. f The concentration of metabolite α-KG of LX2 cells treated with IDH1 plasmid was detected by ELISA. g Extracellular lactate levels of LX2 cells treated with IDH1 plasmid. h Real-time ECAR of LX2 cells treated with IDH1 plasmid was detected by the Agilent’s Seahorse Bioscience XF24 Extracellular Flux Analyzer. Data are shown as the mean ± SD (n = 3) of one representative experiment; *P < 0.05, **P < 0.01, ***P < 0.001 vs. control group; ##P < 0.01, ###P < 0.001 vs. vector group.
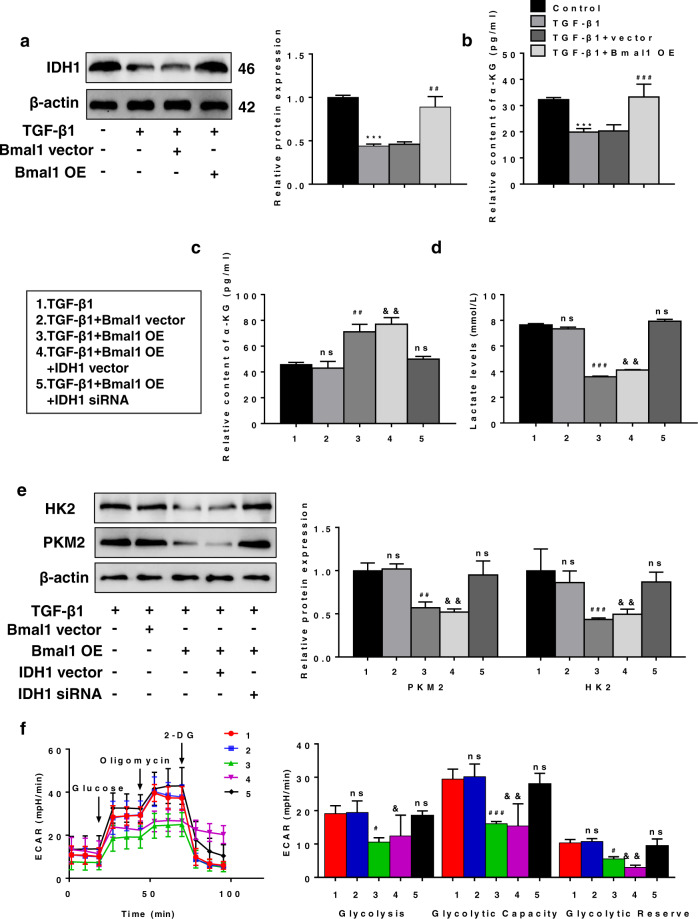
We further evaluated whether Bmal1 regulated glycolysis via IDH1 in vitro. Western blotting showed that overexpression of Bmal1 significantly enhanced the expression of IDH1 in TGF-β1-stimulated LX2 cells (Fig. 8a). The results of ELISA indicated that Bmal1 overexpression significantly increased the concentration of intracellular α-KG in TGF-β1-induced LX2 cells (Fig. 8b). These results suggested that Bmal1 might play a critical role in regulating the expression of IDH1. Next, we assessed whether Bmal1-mediated inhibition of glycolysis depended on IDH1. Toward this, the Bmal1 overexpressing plasmid and IDH1 siRNA were co-transfected in LX2 cells. We observed that overexpression of Bmal1 reduced the expression of key glycolytic enzymes in activated LX2 cells, although these effects were abolished by the IDH1 siRNA (Fig. 8e). Similar changes were observed in ECAR and lactate levels (Fig. 8f, d). Furthermore, upregulation of α-KG was also abolished by the IDH1 siRNA (Fig. 8c). Altogether, these observations indicated that Bmal1 inhibited glycolysis in activated HSCs by targeting IDH1/α-KG.
Fig. 8. Bmal1 targets IDH1/α-KG to inhibit HSCs glycolysis.
a Protein expression of IDH1 in LX2 cells after transfection of Bmal1 plasmid. b The concentration of metabolite α-KG in LX2 cells after transfection of Bmal1 plasmid was detected by ELISA. c Detection of the secretion of metabolite α-KG in LX2 cells by ELISA. d Extracellular lactate levels of LX2 cells after transfection of IDH1 siRNA, Bmal1-OE or corresponding vector. e Expression of HK2 and PKM2 protein after transfection of IDH1 siRNA, Bmal1-OE or corresponding vector. f Real-time ECAR of LX2 cells was detected by the Agilent’s Seahorse Bioscience XF24 Extracellular Flux Analyzer. Data are shown as the mean ± SD (n = 3) of one representative experiment; ***P < 0.001 vs. control group; #P < 0.05, ##P < 0.01, ###P < 0.001 vs. vector group; &P < 0.05, &&P < 0.01, vs. TGF-β1 +Bmal1-OE+IDH1 siRNA group.
Hepatic overexpression of Bmal1 prevented CCl4-induced liver fibrosis by suppressing IDH1-mediated glycolysis
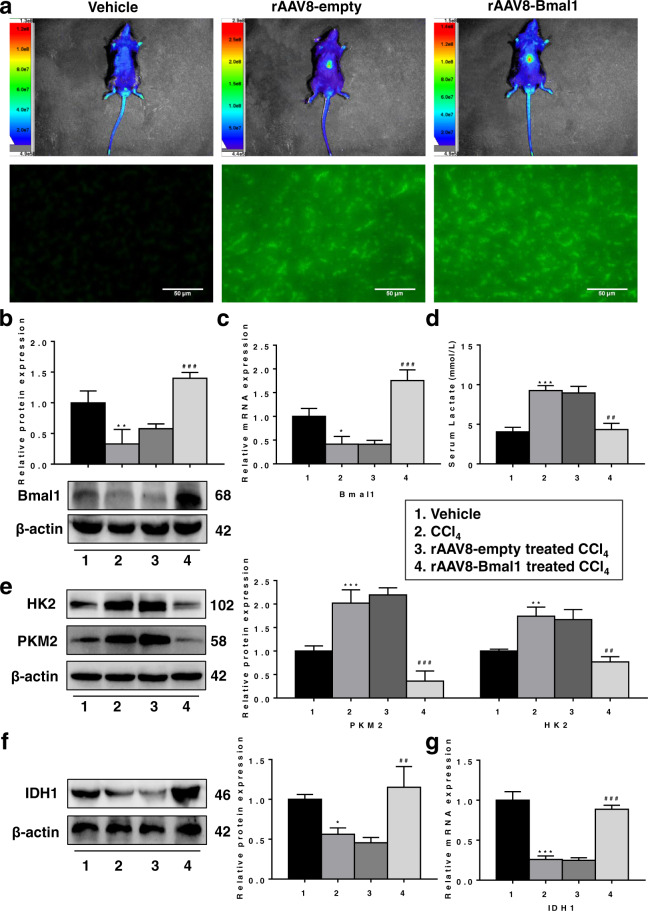
The eGFP signal in fibrotic mouse liver transfected with the recombinant adeno-associated virus 8 (rAAV8)-Bmal1 overexpression construct indicated successful infection of the virus (Fig. 9a). Bmal1 expression increased in the rAAV8-Bmal1-transfected liver compared to that in the rAAV8-empty vector-treated liver tissue (Fig. 9b, c). The results showed that Bmal1 intervention considerably decreased serum lactate levels in the mouse model of fibrosis (Fig. 9d). In addition, Bmal1 overexpression dramatically downregulated the protein levels of the key glycolytic enzymes (Fig. 9e) and promoted the expression of IDH1 and α-KG level in the fibrotic liver (Fig. 9f, g and Fig. 10a).
Fig. 9. Liver-specific Bmal1 overexpression inhibits glycolysis of CCl4-induced liver fibrosis in mice.
a Representative high-efficiency transduction of rAAV8-Bmal1-EGFP in liver tissue. b Protein and c mRNA levels of Bmal1 in liver tissue. d Extracellular lactate levels in liver tissue. e Protein levels of HK2, PKM2 in liver tissue. f Protein and g mRNA levels of IDH1 in liver tissue. Data are shown as the mean ± SD (n = 3) of one representative experiment; *P < 0.05, **P < 0.01, ***P < 0.001 vs. vehicle mice; ##P < 0.01, ###P < 0.001 vs. rAAV8-empty treated CCl4 group.
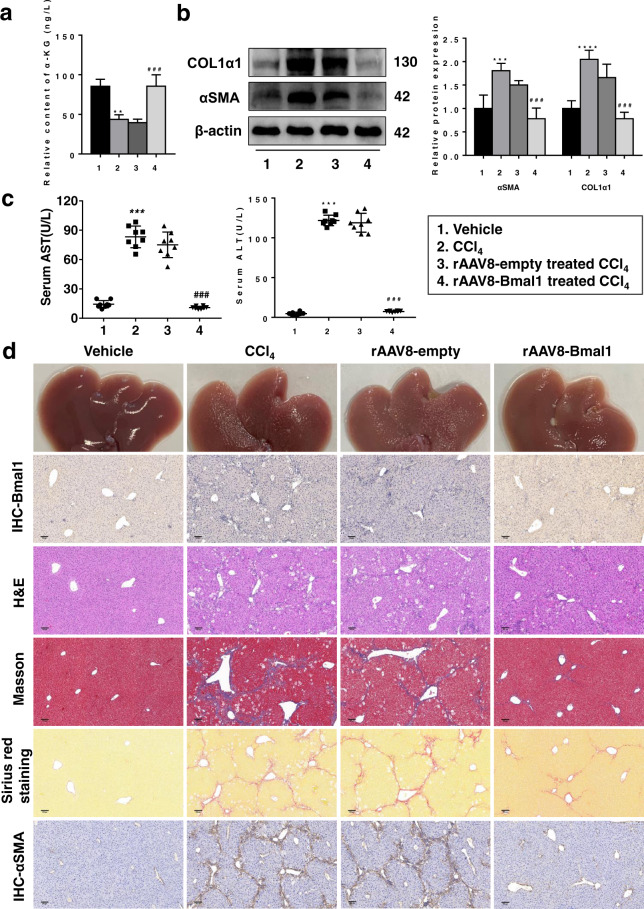
Fig. 10. Liver-specific Bmal1 overexpression alleviates CCl4-induced liver fibrosis.
a Detection of the secretion of metabolite α-KG in liver tissue by ELISA. b Protein levels of COL1α1 and αSMA in liver tissue. c Serum ALT and AST levels (n = 8). d Representative Bmal1, H&E, Masson, Sirius-red, and αSMA staining of liver tissue sections. Data are shown as the mean ± SD (n = 3) of one representative experiment; **P < 0.01, ***P < 0.001, ****P < 0.0001 vs. vehicle mice; ###P < 0.001 vs. rAAV8-empty treated CCl4 group.
We subsequently assessed the expression of HSC activation markers and observed that Bmal1 significantly reduced the αSMA and COL1α1 levels in fibrotic livers (Fig. 10b). Bmal1 downregulated the serum levels of hepatocyte injury markers (ALT and AST) in fibrotic mice (Fig. 10c). Histological assessments and collagen staining assays showed that Bmal1 overexpression in vivo improved liver structure and ECM deposition (Fig. 10d). Thus, Bmal1 alleviated liver fibrosis by promoting glycolysis inhibition mediated by IDH1/α-KG.
Discussion
Liver fibrosis is a challenging disease characterized by the accumulation of ECM caused by liver injury, which is the main cause of morbidity and mortality worldwide [9]. Currently, precise anti-fibrosis treatments are not available, and the only therapeutic approach involves removal of nociceptive stimulation and liver transplantation. HSCs are the key effectors of the initiation and development of liver fibrogenesis [6]. Many studies have described the role of metabolic reprogramming in the transdifferentiation-like process of HSCs [7]. The key biological targets that link metabolic processes with phenotypic transformation are being gradually revealed, which provides opportunities for directly targeting liver fibrosis. Therefore, efforts are required to identify the key biological targets that mediate liver fibrosis.
Emerging evidence shows that liver fibrosis leads to alterations in glucose metabolism, as aerobic glycolysis is aggravated in HSCs, along with changes in metabolic reprogramming [8]. In this study, the hepatic metabolomics profiles of fibrotic mice were analyzed using a widely targeted metabonomic technique. In total, 12 differential metabolites were screened using HPLC/HRMS, in which the level of the glycolysis product, FBP, was found to be significantly high, whereas that of the TCA cycle intermediate, α-KG, decreased significantly. Our results suggest that energy production during liver fibrogenesis occurs mostly via glycolysis than via oxidative phosphorylation. Furthermore, the glycolytic activity of the primary HSCs from fibrotic mice was higher than that in vehicle-treated mice. Subsequently, in vitro experiments showed that the levels of two key glycolytic enzymes and ECAR were significantly upregulated and lactic acid accumulated rapidly in TGF-β1-activated LX2 cells. 2-DG, a glycolysis inhibitor, decreased the proliferation of HSCs and repressed the expression of myofibroblast genes. Our results revealed that increased glycolysis may be a cardinal feature required to induce the profibrogenic phenotype of activated HSCs.
Bmal1 is a key factor driving the cyclic expression of various metabolic genes related to lipid, glucose, and cholesterol metabolism [15, 16]. Studies have shown that Bmal1 plays a profound role in the recovery of glucose metabolic disorders such as hypoglycemia and diabetes [10, 22, 23]. Here, we observed that Bmal1 is poorly expressed in CCl4-induced fibrotic livers of mice, and in both LX2 cells and freshly isolated mouse HSCs. Bmal1 downregulation is a cardinal feature required to enhance glycolytic flux and induce an activated profibrogenic phenotype, as its overexpression impaired these changes and reduced the proliferative ability of activated HSCs. Our preliminary evidence shows that Bmal1 is necessary to inhibit glycolysis in activated HSCs.
To further understand the mechanism via which Bmal1 regulates glycolysis, we performed co-IP and LC–MS/MS analyses and identified an interaction between IDH1 and Bmal1 in activated HSCs. IDH1 is closely related to the regulation of glucose metabolism. Studies have shown that the abnormal expression of IDH1 is associated with glycolysis in various cancer cells, and regulation of IDH1 expression may represent a potential target for cancer therapy [24–26]. We verified the role of IDH1 in glycolysis of HSCs. Our results showed that overexpression of IDH1 increased the concentration of α-KG and decreased ECAR and lactate levels in activated HSCs. This indicated IDH1/α-KG-mediated blocking of glycolysis in HSCs. We observed that IDH1 levels were low during HSC activation, owing to inhibition of Bmal1. However, overexpression of Bmal1 promoted the expression of IDH1 and the formation of α-KG in activated HSCs. The inhibitory effect of Bmal1 on glycolysis was abolished by IDH1 silencing. This confirmed that IDH1/α-KG was a prerequisite for the Bmal1-mediated inhibition of glycolysis.
Our study showed that the expression of Bmal1, both at protein and mRNA levels, was notably downregulated both in vivo and in vitro during fibrogenesis. We determined whether Bmal1-targeted therapy could prevent CCl4-induced liver fibrosis and liver injury in vivo. Our results indicated that overexpression of Bmal1 in vivo significantly alleviated liver injury and ECM accumulation. These results further confirmed that Bmal1 overexpression exerts a protective effect in mouse model of CCl4-induced liver fibrosis.
In conclusion, Bmal1 was downregulated during liver fibrosis and it negatively regulated glycolysis in activated HSCs. Importantly, Bmal1 acts as an anti-fibrotic mediator and possesses therapeutic potential for liver fibrosis, as it inhibited collagen production and repressed HSC proliferation. The molecular mechanism via which Bmal1 exerts its anti-fibrotic function partially involves the direct promotion of the IDH1/α-KG pathway, resulting in the inhibition of glycolysis.
Acknowledgements
This work was supported by grants from the National Natural Science Foundation of China (Grant/Award Number: 82070629) and Natural Science Foundation of Anhui Province of China (Grant/Award Number: 20080852MH242).
Author contributions
LX, YWZ and MFW conceived and designed the study, performed the experiments, collected the data, analyzed and interpreted the data, and drafted the manuscript. JS and JLC contributed to data collection and some of the experiments. JQW, QXL and SYC provided a series of experimental instructions. LZ contributed to language polishing. TYY contributed to the revision of the manuscript.
Competing interests
The authors declare no competing interests.
References
- 1.Natarajan V, Harris EN, Kidambi S. SECs (Sinusoidal Endothelial Cells), liver microenvironment, and fibrosis. Biomed Res Int. 2017;2017:4097205. doi: 10.1155/2017/4097205. [DOI] [PMC free article] [PubMed] [Google Scholar]
- 2.Bataller R, Brenner DA. Liver fibrosis. J Clin Invest. 2005;115:209–18. doi: 10.1172/JCI24282. [DOI] [PMC free article] [PubMed] [Google Scholar]
- 3.Wang F, Jia Y, Li M, Wang L, Shao J, Guo Q, et al. Blockade of glycolysis-dependent contraction by oroxylin a via inhibition of lactate dehydrogenase-a in hepatic stellate cells. Cell Commun Signal. 2019;17:11. doi: 10.1186/s12964-019-0324-8. [DOI] [PMC free article] [PubMed] [Google Scholar]
- 4.Lian N, Jin H, Zhang F, Wu L, Shao J, Lu Y, et al. Curcumin inhibits aerobic glycolysis in hepatic stellate cells associated with activation of adenosine monophosphate-activated protein kinase. IUBMB Life. 2016;68:589–96. doi: 10.1002/iub.1518. [DOI] [PubMed] [Google Scholar]
- 5.Duan L, Ramachandran A, Akakpo JY, Woolbright BL, Zhang Y, Jaeschke H. Mice deficient in pyruvate dehydrogenase kinase 4 are protected against acetaminophen-induced hepatotoxicity. Toxicol Appl Pharmacol. 2020;387:114849. doi: 10.1016/j.taap.2019.114849. [DOI] [PMC free article] [PubMed] [Google Scholar]
- 6.Tsuchida T, Friedman SL. Mechanisms of hepatic stellate cell activation. Nat Rev Gastroenterol Hepatol. 2017;14:397–411. doi: 10.1038/nrgastro.2017.38. [DOI] [PubMed] [Google Scholar]
- 7.Chen Y, Choi SS, Michelotti GA, Chan IS, Swiderska-Syn M, Karaca GF, et al. Hedgehog controls hepatic stellate cell fate by regulating metabolism. Gastroenterology. 2012;143:1319–29 e11. doi: 10.1053/j.gastro.2012.07.115. [DOI] [PMC free article] [PubMed] [Google Scholar]
- 8.Mejias M, Gallego J, Naranjo-Suarez S, Ramirez M, Pell N, Manzano A, et al. CPEB4 increases expression of PFKFB3 to induce glycolysis and activate mouse and human hepatic stellate cells, promoting liver fibrosis. Gastroenterology. 2020;159:273–88. [DOI] [PubMed]
- 9.Chang ML, Yang SS. Metabolic signature of hepatic fibrosis: from individual pathways to systems biology. Cells. 2019;8:1423. [DOI] [PMC free article] [PubMed]
- 10.Rudic RD, McNamara P, Curtis AM, Boston RC, Panda S, Hogenesch JB, et al. BMAL1 and CLOCK, two essential components of the circadian clock, are involved in glucose homeostasis. PLoS Biol. 2004;2:e377. doi: 10.1371/journal.pbio.0020377. [DOI] [PMC free article] [PubMed] [Google Scholar]
- 11.Asher G, Sassone-Corsi P. Time for food: the intimate interplay between nutrition, metabolism, and the circadian clock. Cell. 2015;161:84–92. doi: 10.1016/j.cell.2015.03.015. [DOI] [PubMed] [Google Scholar]
- 12.Curtis AM, Bellet MM, Sassone-Corsi P, O'Neill LA. Circadian clock proteins and immunity. Immunity. 2014;40:178–86. doi: 10.1016/j.immuni.2014.02.002. [DOI] [PubMed] [Google Scholar]
- 13.Early JO, Menon D, Wyse CA, Cervantes-Silva MP, Zaslona Z, Carroll RG, et al. Circadian clock protein BMAL1 regulates IL-1beta in macrophages via NRF2. Proc Natl Acad Sci USA. 2018;115:E8460–E8. doi: 10.1073/pnas.1800431115. [DOI] [PMC free article] [PubMed] [Google Scholar]
- 14.Harfmann BD, Schroder EA, Kachman MT, Hodge BA, Zhang X, Esser KA. Muscle-specific loss of Bmal1 leads to disrupted tissue glucose metabolism and systemic glucose homeostasis. Skelet Muscle. 2016;6:12. doi: 10.1186/s13395-016-0082-x. [DOI] [PMC free article] [PubMed] [Google Scholar]
- 15.Peek CB, Affinati AH, Ramsey KM, Kuo HY, Yu W, Sena LA, et al. Circadian clock NAD+ cycle drives mitochondrial oxidative metabolism in mice. Science. 2013;342:1243417. doi: 10.1126/science.1243417. [DOI] [PMC free article] [PubMed] [Google Scholar]
- 16.Deng W, Zhu S, Zeng L, Liu J, Kang R, Yang M, et al. The circadian clock controls immune checkpoint pathway in sepsis. Cell Rep. 2018;24:366–78. doi: 10.1016/j.celrep.2018.06.026. [DOI] [PMC free article] [PubMed] [Google Scholar]
- 17.Wang B, Ye Y, Yang X, Liu B, Wang Z, Chen S, et al. SIRT2-dependent IDH1 deacetylation inhibits colorectal cancer and liver metastases. EMBO Rep. 2020;21:e48183. doi: 10.15252/embr.201948183. [DOI] [PMC free article] [PubMed] [Google Scholar]
- 18.Suzuki J, Yamada T, Inoue K, Nabe S, Kuwahara M, Takemori N, et al. The tumor suppressor menin prevents effector CD8 T-cell dysfunction by targeting mTORC1-dependent metabolic activation. Nat Commun. 2018;9:3296. doi: 10.1038/s41467-018-05854-6. [DOI] [PMC free article] [PubMed] [Google Scholar]
- 19.Xiang S, Gu H, Jin L, Thorne RF, Zhang XD, Wu M. LncRNA IDH1-AS1 links the functions of c-Myc and HIF1alpha via IDH1 to regulate the Warburg effect. Proc Natl Acad Sci USA. 2018;115:E1465–E74. doi: 10.1073/pnas.1711257115. [DOI] [PMC free article] [PubMed] [Google Scholar]
- 20.Wen YA, Xiong X, Scott T, Li AT, Wang C, Weiss HL, et al. The mitochondrial retrograde signaling regulates Wnt signaling to promote tumorigenesis in colon cancer. Cell Death Differ. 2019;26:1955–69. doi: 10.1038/s41418-018-0265-6. [DOI] [PMC free article] [PubMed] [Google Scholar]
- 21.Lamia KA, Storch KF, Weitz CJ. Physiological significance of a peripheral tissue circadian clock. Proc Natl Acad Sci USA. 2008;105:15172–7. doi: 10.1073/pnas.0806717105. [DOI] [PMC free article] [PubMed] [Google Scholar]
- 22.Marcheva B, Ramsey KM, Buhr ED, Kobayashi Y, Su H, Ko CH, et al. Disruption of the clock components CLOCK and BMAL1 leads to hypoinsulinaemia and diabetes. Nature. 2010;466:627–31. doi: 10.1038/nature09253. [DOI] [PMC free article] [PubMed] [Google Scholar]
- 23.Sharma A, Kumar V. Metabolic plasticity mediates differential responses to spring and autumn migrations: Evidence from gene expression patterns in migratory buntings. Exp Physiol. 2019;104:1841–57. doi: 10.1113/EP087974. [DOI] [PubMed] [Google Scholar]
- 24.Zhou L, Wang Z, Hu C, Zhang C, Kovatcheva-Datchary P, Yu D, et al. Integrated metabolomics and lipidomics analyses reveal metabolic reprogramming in human glioma with IDH1 mutation. J Proteome Res. 2019;18:960–9. doi: 10.1021/acs.jproteome.8b00663. [DOI] [PubMed] [Google Scholar]
- 25.Fujiwara H, Tateishi K, Misumi K, Hayashi A, Igarashi K, Kato H, et al. Mutant IDH1 confers resistance to energy stress in normal biliary cells through PFKP-induced aerobic glycolysis and AMPK activation. Sci Rep. 2019;9:18859. doi: 10.1038/s41598-019-55211-w. [DOI] [PMC free article] [PubMed] [Google Scholar]
- 26.Chen C, Shi Y, Li Y, He ZC, Zhou K, Zhang XN, et al. A glycolysis-based ten-gene signature correlates with the clinical outcome, molecular subtype and IDH1 mutation in glioblastoma. J Genet Genom. 2017;44:519–30. doi: 10.1016/j.jgg.2017.05.007. [DOI] [PubMed] [Google Scholar]


