

Abstract
Pathway analysis is a popular method aiming to derive biological interpretation from high-throughput gene expression studies. However, existing methods focus mostly on identifying which pathway or pathways could have been perturbed, given differential gene expression patterns. In this paper, we present a novel pathway analysis framework, namely rPAC, which decomposes each signaling pathway route into two parts, the upstream portion of a transcription factor (TF) block and the downstream portion from the TF block and generates a pathway route perturbation analysis scheme examining disturbance scores assigned to both parts together. This rPAC scoring is further applied to a cohort of gene expression data sets which produces two summary metrics, “Proportion of Significance” (PS) and “Average Route Score” (ARS), as quantitative measures discerning perturbed pathway routes within and/or between cohorts. To demonstrate rPAC’s scoring competency, we first used a large amount of simulated data and compared the method’s performance against those by conventional methods in terms of power curve. Next, we performed a case study involving three epithelial cancer data sets from The Cancer Genome Atlas (TCGA). The rPAC method revealed specific pathway routes as potential cancer type signatures. A deeper pathway analysis of sub-groups (i.e., age groups in COAD or cancer sub-types in BRCA) resulted in pathway routes that are known to be associated with the sub-groups. In addition, multiple previously uncharacterized pathways routes were identified, potentially suggesting that rPAC is better in deciphering etiology of a disease than conventional methods particularly in isolating routes and sections of perturbed pathways in a finer granularity.
Keywords: topology and route-based pathway analysis, TCGA data analysis, KEGG pathway analysis
1. INTRODUCTION
The availability of unprecedented amount of genomics data today has not only allowed biologists to uncover new biological insights but also introduced an enormous bioinformatic challenge. The Cancer Genome Atlas (TCGA) hosts gene expression profiles for numerous cancer cohorts containing hundreds of samples in each cohort [1][2], making data analysis a huge computational challenge. Additionally, cancer is known to be a heterogeneous disease, with significant variations in genetic alterations across different tumor samples [3]. Therefore, it is essential to build effective bioinformatic techniques that allow researchers to uncover in-depth understanding of genes and pathway routes altered in cancer types to identify potential therapeutic treatment. Numerous pathway analysis methods have been proposed over the past two decades which are categorized into three generations based on their timeline and strategy. The first two generations, Over Representation Analysis (ORA) and Functional Class Scoring (FCS), use pathways as gene sets and do not utilize pathway topology in their model. Gene set enrichment analysis (GSEA) [4] is one of most widely used FCS tool that uses gene-level statistics or log2 fold changes for all genes to see whether gene sets are enriched among the large positive or negative fold changes. The third generation of pathway analysis has evolved as Topology Based (TB) pathway analysis which started to include pathway topology into the model for improved performance. Biological pathway databases such as KEGG [5] and Reactome [6] use years of curated knowledge to annotate positions and interactions of genes in a pathway. There are more than 30 topology-based methods including Pathway-Express [7], SPIA [8], PARADIGM [9], PathNet [10], PATHOME [11], PerPAS [12] etc., proposed so far that utilize pathway topology to generate ordered list of altered pathways in given case/control comparison. However, these methods assess entire pathway as a unit and fail to highlight the relevance of individual routes within a pathway. Although pathways are designed to contain gene interactions responsible towards a common biological process, it has been shown that signal transduction within a cell occurs via different pathway routes within the same pathway in different conditions, thus making signaling routes as a unit of analysis critical in pathway analysis critically important.
Previously we encoded pathway routes as a Bayesian Network and used it to identify aberrant pathways in TCGA breast cancer data set [13]. This work offered deeper patient-specific insights and demonstrated that HER2+ sub-type can be further refined into finer subtypes based on variation in route scores assigned for patients. This method, however, has drawbacks—most significantly, the complexity of too many routes to be analyzed (e.g., over 40,000 routes for a single study). We conjecture that this complexity can be abated if we consider the types of biological entities involved in pathway routes for the analysis. Specifically, we limit the analysis to focus on the signaling starting from a ligand and ending at pathway targets in which the midpoint of the signaling typically involves a transcription factor (TF) or a complex formed by a group of interacting TFs. The second idea to control the complexity by confining the analysis to a context of a biological system one is interested in analyzing. For example, if a scientist is interested in analyzing gene expression data sets of “osteoclast differentiation”, the analysis should include the pathways including NFATC1 (the key TF known for controlling osteoclast differentiation) and its targets such as CTSK, MMP9, OSCAR, and so on. In this regard, the rPAC has been designed to address how to analyze a cohort of gene expression data sets from the same or similar comparable context.
2. SYSTEM AND METHODS
To introduce how the rPAC framework works in general terms, in this work we show how the TCGA cancer cohort data sets can be analyzed using rPAC with KEGG signaling pathways. Signaling pathways are downloaded in KGML format from KEGG website [5]. All the nodes (ligand, receptor, gene, and transcription factor) and edges (gene relationships) are extracted from KGML file and stored in a graph structure as illustrated in Figure 1. In this graph structure, gene interactions are directional and are encoded as either activation (arrowhead) or inhibition (T-bar).
Figure 1:
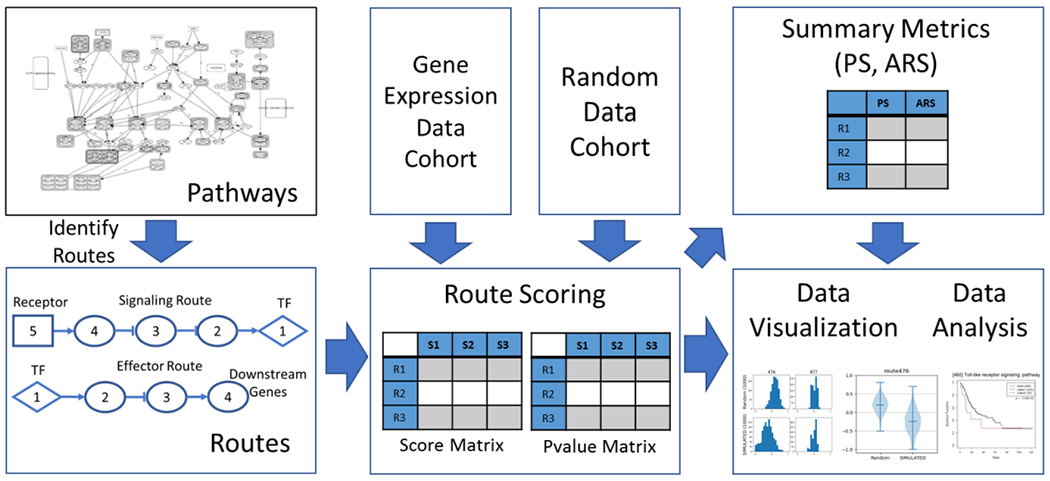
The overview of rPAC framework. KEGG signaling pathways are stored in graph structure. This graph structure is used to identify pathway routes. Routes are assigned activity scores and p-values. Score matrix S and p-value matrix P are generated for given gene expression data cohort. Summary metrics PS and ARS are generated for each route to assess absolute and relative route activity. Score distribution and survival analysis for each route are visualized as histograms, violin plots and K-M plots.
Figure 1 also illustrates the overview of rPAC framework. Routes are identified from pathways and are assigned an activity score and p-values. Score matrix S and p-value matrix P are generated for given cohort. Cohort data contains gene expression values from large number of samples in similar context and they are organized in a matrix. In this gene expression data matrix, columns indicate samples and rows indicate genes. Relative expression of each gene g (Rg) is computed as log2 ratio of test and control samples as given in equation 1.
| (1) |
where Et is gene expression value in test sample and Ec is the average expression value of the gene in control population. To reduce adverse effect of small or NULL expression values, Laplace smoothing is applied where smoothing parameter α = 1 is added to all observed values [14]. This has mainly two advantages: avoids divide by zero problem and resolves issue of having high log2ratio value when expression values are smaller than 1.
2.1. Pathway Routes
The rPAC framework considers only the routes that are transcription factor centric (TF-centric). TF-centric routes are the routes that are mediated by a transcription factor or a group of TFs forming a TF complex. This mediator transcription factor (or TF complex) that is used to identify a route is referred as primary TF.
Pathway Routes are identified by applying breadth first search (BFS) algorithm on each pathway. Routes are categorized into two types: (i) Signaling Route (SR), and (ii) Effector Route (ER). Signaling route (also labelled as ‘p1’) captures signal transduction from cell surface into the nucleus in which each route starts from ligand/receptor (LR) and follows a path to the primary TF. Effector route captures second part (labelled as ‘p2’) of the cellular process where the primary TF binds to the target genes to regulate their expression. We generalize that typically each effector route beginning from a TF or a TF complex and its path capturing its regulation on target genes is associated with some biological process.
2.2. Node Expected Value
Expected value (Eik) of a node is one of {+1, 0, −1} and indicates whether this node should be up-regulated or down-regulated to activate the primary TF. Since expected values are computed with respect to the primary TF, all three possible scenarios (upregulation, downregulation, and neutral case of primary TF) are covered by route scores as further explained in section 2.4.
Each node k in route i is assigned an expected value (Eik) as given in equation 2. The propagation of expected values starts from primary TF (i.e., when k = 1, node is primary TF hence Eik = 1) as shown in the Routes block of Figure 1. In case of signaling routes, Eik is propagated upstream until root node (ligand/receptor) is encountered. Similarly, for effector routes, Eik is propagated downstream until a leaf node is encountered.
| (2) |
2.3. Node Evaluation
Each node k in route i for sample j is assigned a value vijk which is computed based on the node type and gene expression value associated with the node. A node in the pathway route can be of two forms, Singleton Node or Bundle Node.
2.3.1. Singleton Node
A singleton node is associated with only one gene g, so node value vijk of singleton node k in route i for sample j is equal to log2 ratio of gene g (Rg) which is computed as shown in equation 1.
2.3.2. Bundle Node
Bundle node is composed of multiple nodes which collectively contribute to regulate the downstream genes. Bundle nodes are classified into AND and OR bundles based on the underlying biology. For example, in Wnt signaling pathway there are more than 19 variations of Wnt ligands bundled into one Wnt node. A small number of Wnt ligands being up regulated should be sufficient to initiate signaling [15] and hence this bundle is considered as an OR bundle. In contrast, the transcription factor bundle of Wnt pathway is TCF/LEF AND bundle where both TCF and LEF form a dimer to regulate target genes associated with “cell cycle”. Bundle construction can be nested. For example, TCF itself can be an OR bundle with four variations (TCF4, TCF7, TCFL1 and TCFL2). Understanding the fact that encoding this intricate mechanism in one fixed model is unrealistic, a flexible approach is designed for researchers to control the strictness using a hyper-parameter Umin which represents minimum proportion of up-regulation required to assign an activation/inhibition status to a bundle. Proportion of up-regulation (Uijk) is defined as the ratio of number of up-regulated nodes to the total number of nodes (nk) in a bundle node k. Value vijk of bundle node k in route i for sample j, is given in equation 3.
| (3) |
where (i) M and N are the numbers of up and down regulated nodes respectively in the bundle, (ii) vmjk and vnjk are values of up-regulated and down-regulated nodes in the bundle, (iii) , and (iv) nk is the total number of nodes in bundle node k. Value of Umin is empirically identified to be 0.5 for AND bundle and 0.2 for OR bundle. If we were to use definition of logical AND/OR gates, value of Umin would be 0 for OR bundle and 1 for AND bundle. However, we conjecture that, in biological pathway analysis, these values are context-dependent, and some form of prior knowledge should be used to control various possibilities. The choices of values (0.5 for AND bundle, and 0.2 for OR bundle) were primarily influenced by our intuition developed through extensive discussion with our colleagues in biology fields to incorporate their years of experience analyzing transcriptomics data in cancer domain. Initially, we ran an experiment using Boolean logic values of (Umin = 1 for AND bundle, and Umin = 0 for OR bundle). Although, the overall analysis was not very different, the routes with many OR bundles had biased score distribution in random cohort. For OR bundles with large number of nodes, it is more likely to observe at least one upregulated node in the bundle, causing the bundle to be upregulated majority of the time. Using a threshold value between 0 and 0.5, we dramatically reduce this bias. Using a value more than 0.5 for OR bundle would not be realistic because of inherent characteristic of OR bundles. In contrast, in case of AND bundle, expecting all the involved nodes to be upregulated for AND bundle to be activated is not realistic in biological context. Therefore, Umin for AND bundle can be any value between 0.5 and 1. A lower bound of 0.5 guarantees that majority of nodes are upregulated in this bundle which is coherent with characteristic of AND bundle.
2.4. Route Scoring
Each node k in route i is assigned a contribution value (Cijk) for sample j as given in equation 4. Contribution value of any node is normalized in a range controlled by a hyper parameter Cmax.
| (4) |
where Cmax (default value 1.5) is the maximum allowed contribution of a node. If any node has log2ratio magnitude less than Cmax, their node contribution magnitude is equal to the log2ratio value. And if log2ratio magnitude is more than Cmax, node contribution magnitude is equal to Cmax with sign inherited from log2ratio value. Initially, we experimented with Cmax = 1. This means, when log2ratio value of a node is 1 (raw ratio = 2), its contribution to the overall route score saturates. This was based on the standard practices in the community to consider log2ratio 1 to be enough signal to regulate the downstream genes. However, when some genes in a route are highly upregulated (with log2ratio > 1), they could be compensating for other genes in the route which are upregulated with smaller magnitude. For example, nodes with ligands, receptors and transcription factors are more important players in a route. When these key players are highly upregulated, although the intermediate nodes are not significantly regulated, the route score can be inflated using Cmax parameter. The reason behind our choice of value 1.5 for Cmax is to keep balance between 1 (no compensation to other nodes) and 2 (fully compensating for another node with no regulation). The choice of these hyper-parameter values will be undoubtedly “context-dependent” and need to be determined empirically just like hyper parameters of machine learning models.
The activity score (Sij for route i in sample j is calculated as shown in equation 5.
| (5) |
where ni is number of nodes in route i. An activity score matrix S is generated for given cohort which includes Sij from equation 5 as the score in row i and column j. The activity score (Sij) represents the absolute activity of a route and ranges from −1 (highly downregulated) to +1 (highly upregulated). The up and down regulation of a route is represented by the sign (+/−) of route score, and magnitude of route score represents the strength of regulation. Regulation activity of a route can also be directly associated with activity of the primary TF because expected values of nodes are computed with respect to the primary TF. When primary TF and route are downregulated, node contribution values Cijk and node expected values Eik have opposite signs (+/−) (for example, expected value of a node is +1, and observed log2ratio is −1). In this case, nodes contribute negative scores to the overall route score, hence the route activity score will be a negative value close to −1. When primary TF (or route) is irrelevant to the context, route score is around 0.
2.5. Test Statistics
To approximate a null distribution of the test statistic, 1000 random samples were generated where gene log2 ratio values were randomly sampled from a standard normal distribution (μ = 0 and σ = 1). Route activity score, , was computed for each route i and random sample r and null distribution was generated. The p-value (pij) of route activity score Sij is calculated as a probability of observing scores in null distribution that are at least as extreme as the observed score. The p-value of two tailed hypothesis test is given by equation 6.
| (6) |
2.6. Summary Metrics
Two summary metrics “Proportion of Significance” (PS) and “Average Route Score” (ARS) are computed for every route i as given in equation 7 and equation 8.
| (7) |
| (8) |
where J is the number of samples in given cohort and is p-value threshold (default 0.05). PS ranges from 0 to 1 and represents the prevalence with which route activity is altered within a cohort. ARS ranges from −1 to 1 and represents the average activity of an individual route amongst all samples in a cohort.
2.7. Implementation
KGML Parser, route identification and scoring algorithm of rPAC framework were implemented in PHP programming language. Python programming language was used for computation of p-values and summary metrics (PS, ARS), and for data visualizations. Survival analysis was performed in R using survival package [16].
3. RESULTS AND DISCUSSION
3.1. Simulation Study
To demonstrate the competency of rPAC framework, a systematic evaluation was conducted with large amount of simulated data. The results from rPAC were compared with results from two of the most popular existing pathway analysis methods, GSEA and SPIA. Perturbation of certain “routes” from selected pathways were controlled to examine if the artificially perturbed routes were identified by rPAC framework and other two methods. Simulated data was generated by perturbing routes in pathways which did not contain any gene interaction that conflicted with gene interactions in other pathways. As summarized in Table 1, 20 such pathways were used which included 35 routes as possible candidates for artificial perturbation. For each simulated cohort, these routes were randomly assigned a route perturbation value of either −1, 0 or +1. Using this route perturbation value, expectation value Eik for each gene k in route i was calculated as described in section 2. Expected values for genes which are not influenced by these routes cannot be specifically determined and therefore are assigned expected value of 0. Once the expected values for all the genes are assigned, log2 ratio value Rik for each gene k in route i was simulated using a multivariate normal distribution defined in equation 9.
| (9) |
where Eik indicates if a gene is expected to be +1 (activated), 0 (neutral) or −1 (suppressed). Random Variable g represents magnitude of differential expression of a gene and is sampled from a normal distribution, . The random variable t represents random variation and is sampled from standard normal distribution.
Table 1:
List of pathways used for generating simulated data.
| Pathway | No. of routes | No. of genes |
|---|---|---|
| Adherens junction | 3 | 30 |
| Adipocytokine signaling | 2 | 19 |
| Aldosterone synthesis and secretion | 2 | 42 |
| AMPK signaling | 1 | 22 |
| Apelin signaling | 4 | 46 |
| Apoptosis | 2 | 17 |
| B cell receptor signaling | 1 | 13 |
| Cell cycle | 1 | 18 |
| Chemokine signaling | 1 | 71 |
| Focal adhesion | 2 | 8 |
| FoxO signaling | 1 | 6 |
| HIF-1 signaling | 1 | 18 |
| Hippo signaling | 1 | 13 |
| Notch signaling | 1 | 8 |
| Rap1 signaling | 1 | 9 |
| Signaling pathways regulating pluripotency of stem cells | 2 | 42 |
| Th1 and Th2 cell differentiation | 2 | 8 |
| Thyroid hormone signaling | 2 | 10 |
| Tight junction | 2 | 27 |
| Toll-like receptor signaling | 3 | 16 |
| Total | 35 | 443 |
The simulation script was written in python and was used to generate 33 simulated data cohorts (500 samples each) with combination of 11 values for μg {0, 0.2, 0.4, 0.6, 0.8, 1.0, 1.2, 1.4, 1.6, 1.8, 2.0} and 3 values of σg {0.0, 0.5, 1.0). Each of these cohorts were processed through SPIA, GSEA and rPAC to generate list of pathways (routes for rPAC) with their significance values. Pathway significance was called based on threshold of global probability PG < 0.05 for SPIA, FDR qVal < 0.05 for GSEA, and the p-value < 0.05 for rPAC. Performance was measured in terms of power (1 - β) of a test which was calculated as the ratio of perturbed pathways successfully identified as significant over the total perturbed pathways.
Figure 2 illustrates the variation of power (y-axis) with respect to μg(x-axis) for different σg (shown with three different colors). Performance of rPAC framework is plotted with solid lines while dashed and dotted lines are used for GSEA and SPIA, respectively. As seen in Figure 2, power of rPAC is significantly higher than GSEA and SPIA as μg increases. This indicates that rPAC outperformed other two methods as the number of differentially expressed genes increased. As μg gets closer to 1, power of rPAC rapidly approaches 1 clearly indicating that performance of rPAC dramatically improves when genes are regulated with higher magnitudes. As σg increases (blue lines represent the highest variation in Figure 2 with σg = 1), the performance of all three methods deteriorates indicating the obvious negative impact of signal variation in pathway analysis. Overall, rPAC outperforms other methods for all values of σg displaying the robustness against the variation in gene expression signal in the data. The rPAC framework evaluates pathways in route level precision making it possible to detect isolated perturbations in one part of the pathway while rest of the pathway is undisturbed. Since other two methods lack this feature, their pathway scores could easily be skewed by the undisturbed part of the pathway thereby missing the routes that are significantly regulated.
Figure 2:
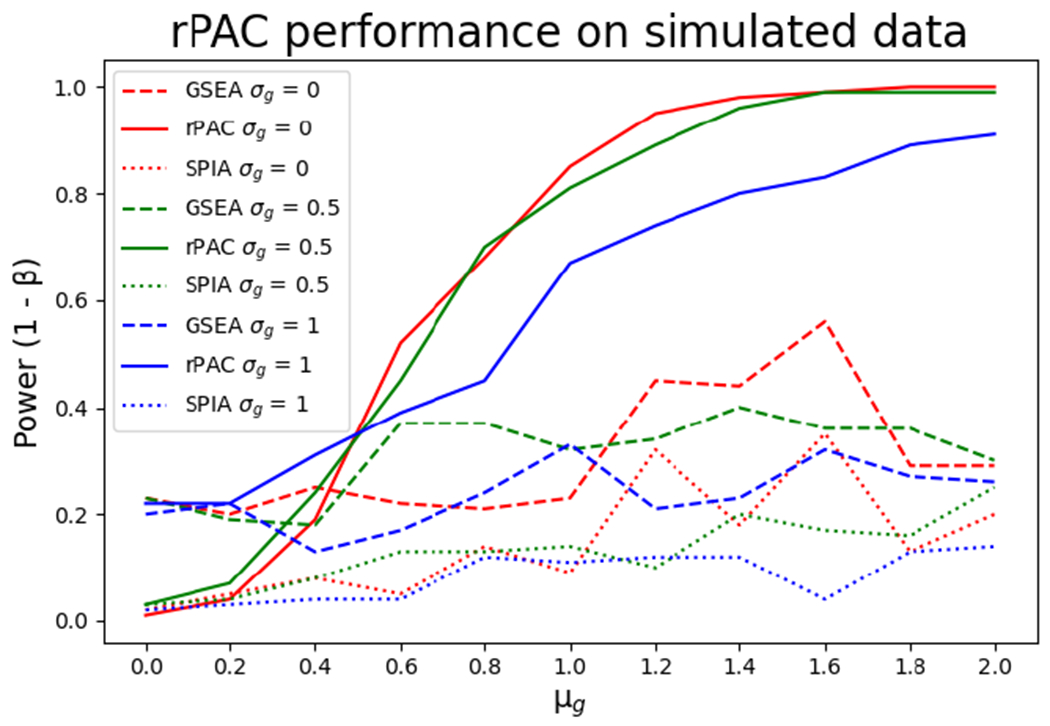
Power curve on simulated data at various differential gene expression level
3.2. Case Study with TCGA Data
RNASeqv2 data for breast invasive carcinoma (BRCA – 1095 tumor and 113 normal tissue samples), colon adenocarcinoma (COAD – 458 tumor and 41 normal tissue samples), and stomach adenocarcinoma (STAD – 372 tumor samples and 32 normal samples) were downloaded from cBioPortal database [17] and log2 ratio data matrix was prepared for each cohort as described in section 2.
Using the methods described in section 2, a total of 472 routes (212 signaling and 260 effector) were identified from 70 KEGG signaling pathways. Score matrix S, p-value matrix P and summary metrics (PS and ARS) were generated to evaluate the relative (between cohorts/subgroups) and absolute route activity.
3.2.1. Route activity variation within pathways
The ability to detect cellular activity at a resolution beyond the pathway level distinguishes rPAC from other pathway analysis tools. While routes in some pathways are altered in a homogeneous manner, other pathways display more varied route activity changes, necessitating our more nuanced analytical approach.
The thyroid hormone signaling pathway demonstrates such pronounced differences in route activity (Figure 3). Within each cohort, prevalence and activity scores for individual routes vary markedly. The BRCA cohort presents with slight overexpression in route 410 (PS = 16%, ARS = 0.14) but occasional under expression in route 421 (PS = 47%, ARS = −0.40) and prevalent under expression in route 424 (PS = 78%, ARS = −0.47). Alternatively, the COAD cohort displays prevalent under expression in routes 410 (PS = 63%, ARS = −0.19) and occasional under expression in route 424 (PS = 23%, ARS = −0.32), but occasional overexpression in route 421 (PS = 4%, ARS = 0.22). The STAD cohort displays similar variation in activity of these routes (ARS ranging from 0.25 to −0.23) although no route is seen to be prevalently perturbed (PS ranging from 8% to 14%). These outcomes suggest that with regards to the thyroid hormone signaling pathway it would be difficult to make meaningful assessments of activity without considering route-level variability.
Figure 3:

Violin plots representing differential activity within the Thyroid hormone signaling pathway in different cancer cohorts. Activity score distribution for routes 410, 421, and 424 are displayed from left to right. The last bar represents total pathway level activity (note the apparent similarity in total pathway levels)
Wnt signaling is the most frequently perturbed growth regulatory pathway in colon cancers, therefore we analyzed aspects of this pathway in detail. Interestingly, two identified routes from Wnt signaling pathway gave different PS scores. The signaling route 471, from Wnt ligand to the TCF/LEF transcription factor bundle, has PS score of 0.04 suggesting that only 4% samples in this cohort have statistically significant p-value for this route. In contrast, the TCF/LEF effector route 472 has PS score of 0.41, indicating that 41% of the cohort population have significant activity in this route. Colon cancers are most frequently driven by an APC gene mutation which results in increased WNT signaling, through the failure to degrade β-catenin, thus affecting the effector route of the pathway [18]. APC mutations therefore directly stimulate the transcription factor and the target genes, while the upstream signaling portion of the pathway is mostly undisturbed. This phenomenon highlights the need to distinguish between signaling and effector routes in pathways. These distinct routes are accurately stratified by rPAC, as illustrated in Figure 4(a & b). Also shown in Figure 4(a & b) are Wnt pathway analysis of STAD and BRCA which are infrequently driven by APC mutation, and as such do not generate high scores for either pathway route.
Figure 4:

Wnt pathway score distribution for various cohorts in (a) signaling route 471 (b) effector route 472. (c) TGF-beta signaling pathway route 358 & 359 on COAD.
TGF-beta signaling pathway which is known to be frequently suppressed in colon cancers [19] was also examined. While routes 358 and 359 both fall in the TGF-beta pathway, rPAC indicates that they are perturbed in opposite directions in COAD samples (Figure 4c). Interestingly, genes in each route have entirely different functions in cancer cells. Signaling route 358 flows from BMP2/4/6 to hepcidin, regulating iron metabolism. This route is likely more active in cancer cells to support an increased need for iron and to manage higher-than-usual cellular levels thereof [20]. Alternately, route 359 is less active in cancer cells; it represents an effector route which facilitates cell cycle arrest through the CDK inhibitor p15 (CDKN2B).
3.2.2. Multi Cancer Comparison
While cancers are often characterized by the tissue from which they arose, cancers of all types arise from a series of mutations that generate a transformed cell phenotype [21]. Cancers arising in different tissues can be differentiated by transcriptional analysis alone [22] but this method provides only limited means for assessing changes to cellular behavior.
Tight junction routes 432 and 434 successfully differentiate cancer types while corroborating our current understanding of cancer biology (Table 2 and Figure 5). Effector route 432 leads from c-Jun to the transcription of the CD1 family of antigen presenting proteins. Low expression levels of some CD1 types have been associated with breast cancer [23], and polymorphisms in CD1 have been associated with poor prostate cancer prognosis [24]. Indeed, rPAC reveals prevalent underactivity in route 432 in BRCA (PS = 59%, ARS = −0.54) and STAD (PS = 63%, ARS = −0.60) but minimal activity changes in COAD patients (PS = 10%, ARS = 0.07). Alternately, effector route 434 is prevalently overactive in COAD (PS = 72%, ARS = 0.91) but infrequently active in BRCA (PS = 8%, ARS = 0.25) and STAD (PS = 17%, ARS = 0.46). Route 434 leads to the transcription of cyclin D1, a cell cycle regulator involved in colon cancer progression [25].
Table 2:
Routes with the highest variations among BRCA, COAD, and STAD cohorts
| ID | Route (p1 - Signaling route, p2 - Effector Route) | BRCA | COAD | STAD | |||
|---|---|---|---|---|---|---|---|
|
| |||||||
| PS | ARS | PS | ARS | PS | ARS | ||
| 9 | Adipocytokine signaling pathway(p1) LEP, LEPR, PPARA, RXRA, RXRB, RXRG | 0.99 | −0.97 | 0.1 | −0.38 | 0.1 | −0.35 |
| 176 | IL-17 signaling pathway(p2) FOS, FOSB, JUN, JUND, FOSL1, IL6 | 0.89 | −0.84 | 0.14 | 0.22 | 0.73 | −0.65 |
| 460 | Toll-like receptor signaling pathway(p2) FOS, JUN, IL12A, IL12B, TNF, IL1B, IL6 | 0.81 | −0.41 | 0.16 | 0 | 0.66 | −0.34 |
| 110 | ErbB signaling pathway(p1) EGF, TGFA, AREG, EGFR, ERBB2, STAT5A, STAT5B | 0.74 | −0.73 | 0.17 | −0.21 | 0.1 | 0.06 |
| 424 | Thyroid hormone signaling pathway(p2) THRA, MYH6, MYH7, ATP2A2, ATP2A1, ATP2A3, PLN | 0.78 | −0.47 | 0.23 | −0.32 | 0.14 | −0.23 |
| 434 | Tight junction(p2) YBX3, CDK4, SYMPK, CCND1 | 0.08 | 0.25 | 0.72 | 0.91 | 0.17 | 0.46 |
| 299 | PPAR signaling pathway(p2) PPARG, RXRA, RXRB, RXRG, SCD5, SCD, FADS2, ME1, ME3 | 0.69 | −0.3 | 0 | 0.22 | 0.11 | 0.04 |
| 400 | Th17 cell differentiation(p2) MAPK14, MAPK11, MAPK13, MAPK12, IRF4 | 0.05 | −0.11 | 0.66 | −0.57 | 0.48 | −0.44 |
| 432 | Tight junction(p2) JUN, CD1A, CD1B, CD1C, CD1D, CD1E | 0.59 | −0.54 | 0.1 | 0.07 | 0.63 | −0.6 |
| 472 | Wnt signaling pathway(p2) TCF7, TCF7L1, TCF7L2, TCF4, LEF1, FOSL1, JUN, MYC, MMP7, PPARD, WISP1, CCND1, CCND2, CCND3, Cell cycle | 0.12 | −0.06 | 0.41 | 0.25 | 0.13 | 0.05 |
Figure 5:

Violin plots of activity scores for routes 432 & 434 (Tight junction) and route 9 (Adipocytokine signaling). Low activity in BRCA and STAD patients in route 432 contrast with elevated activity in COAD patients in route 434. Also shown is route 9 which is turned off in BRCA.
Route 400, regulating Th17 T cells, is most prevalently perturbed in COAD samples (PS = 66%, ARS = −0.57). The route leads from p38 to IRF4, an interferon regulatory protein, and is associated with Th17 differentiation. Conversely, a route in the related IL-17 pathway, route 176 from the AP-1 dimer to the production of IL-6, is prevalently inactive in BRCA (PS = 89%, ARS = −0.84) and STAD (PS = 73%, ARS = −0.65), but not in COAD (PS = 14%, ARS = 0.22), potentially due to the activity detected in route 400. The best differentiator of BRCA was observed to be adipocytokine signaling route 9 (also shown in Figure 5). It presents with a PS score of 99% (ARS = −0.97) compared to 1% each in both COAD and STAD samples. This route and its lipid metabolizing role are discussed further as part of our breast cancer sub type analysis.
3.2.3. BRCA subtype analysis
Breast cancers are often classified by gene expression and provide an ideal demonstration of the tool’s ability to analyze closely related cancer subtypes. The rPAC framework was used to contrast between the following five subtypes of BRCA: basal, HER2+, luminal A, luminal B, and normal-like.
Two pathway routes were identified which are nearly universally perturbed in all subtypes of breast cancer: Apelin route 35 (PS ranging from 93% to 100%, ARS ranging from −0.83 to −0.70), and Adipocytokine route 9 (PS ranging from 97% to 100%, ARS ranging from −0.99 to −0.94). Route 35 leads to the expression of perilipin 1 (PLIN1), a lipolysis inhibitor. PLIN1’s downregulation allows for greater-than-normal lipolytic activity. Lipolysis and lipogenesis are common in cancer cells, as they both support the fatty acid demands of rapid membrane synthesis [26]. While the role of perilipin 1 in lipid metabolism have been characterized [27], any specific role in cancer-associated lipolysis is yet to be demonstrated. Route 9 leads from the activation of the leptin receptor by its ligand to the activation of the PPARA/RXR dimer. PPARA is most often involved in lipid metabolism but has demonstrable anti-proliferative effects in some human and rodent models [28].
While similarities between subgroups reflect the general needs of rapidly dividing cells, the routes with the most dramatic differences in PS and activity between subgroups tend to be connected to prognostic indicators which already delineate the subtypes. Th1 and Th2 cell differentiation pathway route 377 best differentiates basal cancers (PS = 81%, ARS = −0.89) from luminal A (PS = 1%, ARS = 0.15) and luminal B (PS = 1%, ARS = 0.02) while Her2 (PS = 44%, ARS = −0.56) and Normal-like (PS = 36%, ARS = −0.37) sub-types appear moderately down-regulated. This route connects STAT5 to GATA3, leading to Th2 differentiation. Th2 cells can support tumor growth by inhibiting a patient’s cytotoxic T cell response to cancer cells [29], and basal breast cancers tend to have worse patient outcomes than luminal A or luminal B cancers [30]. Apelin route 46 is most prevalently inactive in the HER2+ (PS = 77%, ARS = −0.84), and luminal B (PS = 66%, ARS = −0.73) subtypes. Route 46 leads to actin alpha-2/smooth muscle actin (ACTA2) and the inhibition of E-cadherin (CDH1), both of which are implicated in the epithelial-mesenchymal transition (EMT) in breast cancers [31]. Score distribution for route 35, 46 and 377 on five different BRCA sub-types is shown in Figure 6.
Figure 6:

Violin plots for route 35 & 46 (Apelin signaling) and route 377 (Th1 and Th2 cell differentiation) for BRCA subtypes. Note that route 35 & 46 are universally suppressed while route 377 is a prominent differentiator of subtypes.
3.2.4. Subgroup analysis on COAD by age group
Early onset colon cancer has been an area of increased study in recent years, as the incidence of colorectal cancer in patients under 50 continues to increase [32]. The rPAC framework was utilized to identify routes which were most differentially active in colon cancer patients under the age of 50 (the accepted threshold for an early onset case), and under the age of 68 (the average age of a colon cancer patient in the TCGA database).
Effector route 78 of the cAMP signaling pathway, from SOX9 to AMH, presents the greatest difference in PS score between the early onset subgroup (PS = 33%, ARS = 0.79) and the 60+ subgroup (PS = 52%, ARS = 0.87). AMH production is ordinarily associated with sex organ development [33] but has recently been shown to regulate epithelial-mesenchymal transition (EMT) and chemoresistance in lung cancer [34]. In both cases, under expression of AMH leads to cancerous phenotypes. The lower activity and PS scores of this route in the early onset colorectal cancer subgroup suggests a potentially novel characteristic of this subgroup, rather than something that is less common in early onset colorectal cancers than it is in more ordinary colon cancers. Alternately, Th1-Th2 cell differentiation route 367 presents the greatest difference in average route activity between the early onset (PS = 5%, ARS = 0.46) and 60+ (PS = 4%, ARS = 0.32) subgroups, though the prevalence of significant differential activity was meager. Signaling route 367 instigates Th1 differentiation; the presence of Th1 cells in the tumor environment is a well-documented prognostic indicator in colon cancer patients [35] [36]. Effector route 72 presents the highest PS score in the early onset subgroup (PS = 48%, ARS = −0.36) while average scores indicate less activity in this subgroup relative to the 60+ subgroup (PS = 36%, ARS = −0.29). This route leads from CREB to the transcription of FOS, a transcription factor component long associated with many cancers and shown to be essential to progression of colon carcinomas [37]. The route begins with CREB, which is often more active in cancer cells [38].
Comparisons between patients above and below the average age yielded differences in activity that were more prevalent in the patient population. PPAR route 293 leads from the PPARd/RXR dimer to the production of ILK and PDK1, both of which promote cancer-associated phenotypes and have been suggested as drug targets [39]. While PPARy has been linked to colon cancer, fewer such associations have been documented for PPARd, and most are indirect or conflicting [40] [41]. Route 293 (Figure 7) is less prevalently perturbed but more active in the younger-than-average patient subgroup (PS = 43%, ARS = −0.30) compared to the older-than-average patient subgroup (PS = 63%, ARS = −0.38). Route 277 (Figure 7), the signaling route upstream of route 293, presents with similarly elevated PS scores in the younger-than-average (PS = 75%, ARS = −0.36) and older-than-average (PS = 87%, ARS = −0.48) subgroups. As in the previously discussed comparison of early onset to 60+ subgroups, cAMP effector route 72 is most prevalently inactive in the younger subgroup (PS = 45%, ARS = −0.34) when compared to the older-than-average subgroup (PS = 36%, ARS = −0.30).
Figure 7.

Violin plots (top) of activity scores for route 277 and 293 in subgroups separated at average COAD patient age, bar charts (bottom) representing PS and ARS for each route and subgroup.
3.2.5. Survival Analysis
Kaplan-Meier (K-M) survival analysis was conducted with two groups of samples separated at the median route activity score for all identified routes. Many of the significant routes identified by rPAC survival analysis fall in pathways which have previously been associated with cancer progression and survival. Th17 cell prevalence in the tumor environment can be a prognostic indicator [42]. The activity of Th17 differentiation-promoting route 400 was previously discussed as a characteristic of COAD samples; the upstream signaling route 388 was found to be a significant predictor of patient survival (Figure 8a). While this route was less active in most COAD patients, those few patients who demonstrated increased activity saw decreased survivorship. Tumor protein p53 is a tumor suppressor and well documented prognostic indicator in cancers [43]. Route 258 (Figure 8b) is part of a feedback route which downregulates p53.
Figure 8:

K-M plots for patients separated at the median route score on (a, b) route 388 and 258 (COAD cohort) (c) route 46 (BRCA cohort) (d) route 174 (STAD cohort). Class1 (blue line) represents patients with score below or at the median for the route. Class2 (red line) represents the patients who have route score higher than the median.
Route 46 in apelin signaling pathway, previously discussed as a differentiating factor in luminal B subtype of breast cancer, is a significant predictor of survival in the BRCA cohort (Figure 8c). This route facilitates EMT by regulation of E-cadherin which is associated with both progression and metastasis in breast cancers [44] . Hippo route 174 from transcription factor p73 and the YAP/TAZ cofactor promotes apoptotic behavior. This route was found to be a predictor of survival within the STAD cohort (Figure 8d). Isoforms of p73 can act as a tumor suppressor or an oncogene [45].
The routes mentioned so far are predictive of survival and are related to either previously discussed subgroup analyses or to classical cancer-associated elements. JAK/STAT route 190 (PS = 47%, ARS = 0.08), though unrelated to previously discussed pathways, was the strongest predictor of survival in the BRCA cohort (Figure 9). Route 190 begins with cytokine activation of the JAK/STAT pathway and leads to the dimerization and activity of STAT family transcription factors. Suppression of a cytokine dependent feedback loop in this pathway is associated with breast cancer [46] [47].
Figure 9:

K-M plot for BRCA patients separated at the median activity score for route 190 in JAK-STAT signaling pathway.
4. RELATED WORK
GSEA and SPIA were run with all three cancer cohorts on KEGG pathways, and PS scores were calculated using FDR q-val < 0.05 for GSEA and PG < 0.05 for SPIA. As shown in Table 3, different routes in same pathway have same scores in cases of GSEA and SPIA because they generate one score for entire pathway (e.g., routes 9 and 10 both belong to Adipocytokine signaling pathway so they have same scores for SPIA and GSEA), whereas rPAC is the only method that can generate scores at route-level resolution (different scores are assigned to routes 9 and 10 by rPAC as shown in first 2 rows of Table 3). The importance of analysis at route-level resolution and few notable route-level variations in cancer, as identified by rPAC, are described in Section 3.2.1.
Table 3:
PS scores from GSEA, rPAC, and SPIA (selected routes). The rPAC framework generates scores at route-level resolution distinguishing roles of various routes within a pathway. GSEA and SPIA assign scores for entire pathway with no route-level distinction.
| ID | Route (p1 - Signaling, p2 - Effector) | GSEA (FDRq < 0.05) |
rPAC (p < 0.05) | SPIA (PG < 0.05) |
||||||
|---|---|---|---|---|---|---|---|---|---|---|
| BRCA | COAD | STAD | BRCA | COAD | STAD | BRCA | COAD | STAD | ||
| 9 | Adipocytokine signaling pathway(p1) LEP, LEPR,PPARA, RXRA, RXRB, RXRG | 0.62 | 0.41 | 0.41 | 0.99 | 0.10 | 0.10 | 0.14 | 0.13 | 0.01 |
| 10 | Adipocytokine signaling pathway(p1) ADIPOQ, …, RXRB, RXRG | 0.62 | 0.41 | 0.41 | 0.35 | 0.35 | 0.23 | 0.14 | 0.13 | 0.01 |
|
| ||||||||||
| 281 | PPAR signaling pathway(p2) PPARA, RXRA, RXRB, …, PLIN5, PLIN2 | 0.83 | 0.90 | 0.93 | 0.86 | 0.82 | 0.64 | 0.01 | 0.04 | 0.01 |
| 299 | PPAR signaling pathway(p2) PPARG, RXRA, … ME1, ME3 | 0.83 | 0.90 | 0.93 | 0.69 | 0.00 | 0.11 | 0.01 | 0.04 | 0.01 |
| 432 | Tight junction(p2) JUN, CD1A, CD1B, CD1C, CD1D, CD1E | 0.49 | 0.76 | 0.18 | 0.59 | 0.10 | 0.63 | 0.01 | 0.01 | 0.02 |
| 434 | Tight junction(p2) YBX3, CDK4, SYMPK, CCND1 | 0.49 | 0.76 | 0.18 | 0.08 | 0.72 | 0.17 | 0.01 | 0.01 | 0.02 |
|
| ||||||||||
| 471 | Wnt signaling pathway(p1) | 0.72 | 0.12 | 0.32 | 0.14 | 0.04 | 0.07 | 0.02 | 0.01 | 0.06 |
| 472 | Wnt signaling pathway(p2) | 0.72 | 0.12 | 0.32 | 0.12 | 0.41 | 0.13 | 0.02 | 0.01 | 0.06 |
One notable difference of rPAC from other two methods is the identification of pathways which have routes with both cancer-specific and pan-cancer roles. Adipocytokine route 9, originating from LEP/LEPR, is a differentiator of BRCA (as explained earlier in section 3) while route 10 of same pathway, originating from ADIPOQ, ADIPOR1/R2, has pan-cancer role [48]. Although, GSEA and SPIA both assigned higher score for BRCA cohort (GSEA PS = 62%, SPIA PS = 14%) for Adipocytokine signaling pathway, they do not distinguish roles of specific routes. However, rPAC not only identified route 9 as a signature of BRCA cohort (rPAC BRCA PS = 99%), but also indicated pan-cancer role of route 10 (rPAC BRCA PS = 35%, COAD PS = 35%, STAD PS = 25%).
Furthermore, rPAC also outperforms other methods in identifying varying roles of signaling (p1) and effector (p2) routes in some pathways. As described in section 3, majority of colon cancers are caused by APC mutation affecting the regulation of effector route of Wnt signaling pathway without affecting the signaling route. Both GSEA and SPIA failed to identify Wnt signaling pathway as one of the activated pathways in colon cancer (Table 3, last 2 rows – routes 471 and 472) because they make no distinction among routes. The rPAC framework not only identified Wnt pathway, but also pin-pointed the route level perturbation (i.e., the association of the Wnt pathway effector route 472 in colon cancer with PS = 41% while indicating neutral role of route 471, PS = 4%, as described in section 3). The subtle difference in the “downstream” effector route 472 of Wnt targets is diluted by the similarities of rest of the Wnt signaling pathway, making it difficult for traditional methods to identify this pathway. Similar behavior is observed with PPAR signaling and Tight junction pathways where rPAC is the only method that successfully differentiates the cellular activities in various cancer types at route-level resolution.
5. CONCLUSION
Cellular signaling pathways are altered under a variety of pathophysiological circumstances. In cancers, cell signaling is impacted by gene mutations as well as physiological responses to the tumor that can either promote or suppress cancer progression. Pathway changes can occur through the perturbation of discrete routes within cellular signaling pathways. Here we described a computational scoring system designed to assess signaling through individual routes within a pathway. Using this approach on cancer data sets, we identified discrete routes that distinguish various cancer cohorts and subgroups. The identification of altered routes provides insight into basic cancer mechanisms and can be used to stratify patients into discrete subgroups.
Our proposed route-based pathway analysis method is transcription factor centric and as such the method presupposes that the pathways used for analysis should have included transcription factors and their known targets responsible for exerting biological process intended by the concerned pathway. Nevertheless, such requirement is not a limitation of the rPAC. In fact, the rPAC offers opportunities to uncover transcription factor targets if one can assemble a cohort of proper gene expression data sets (e.g., Alzheimer disease cohort data, Nonalcoholic fatty liver disease cohort data, etc.) with which context-specific pathway target prediction can be attempted using a method which we have already suggested earlier [49].
Highlights.
Route based pathway analysis adds granularity making the analysis more precise.
Analysis in cohorts provide context and generality to findings.
Adipocytokine signaling pathway route is observed to be the best differentiator of breast cancer from colon and stomach cancers.
Th1 and Th2 cell differentiation pathway route that connects STAT5 to GATA3 best differentiates basal breast cancers from Luminal A and Luminal B subtypes.
6. ACKNOWLEDGEMENT
This work was supported in part by National Institutes of Health, Grant No. HD098636 and Grant No. AR078664 to Dong-Guk Shin. Pujan Joshi’s work was also supported in part by the pre-doctoral fellowship by the Department of Computer Science and Engineering, University of Connecticut. National Institutes of Health had no role in designing the study, collecting and analyzing data, or preparing the manuscript.
Footnotes
Publisher's Disclaimer: This is a PDF file of an unedited manuscript that has been accepted for publication. As a service to our customers we are providing this early version of the manuscript. The manuscript will undergo copyediting, typesetting, and review of the resulting proof before it is published in its final form. Please note that during the production process errors may be discovered which could affect the content, and all legal disclaimers that apply to the journal pertain.
7. DECLARATION OF INTEREST
The authors declare that there is no conflict of interest regarding the publication of this article.
8. REFERENCES
- [1].Bass AJ et al. , “Comprehensive molecular characterization of gastric adenocarcinoma,” Nature, vol. 513, pp. 202–209, Jul 1, 2014. [DOI] [PMC free article] [PubMed] [Google Scholar]
- [2].Lander ES, “Comprehensive molecular characterization of human colon and rectal cancer,” Nature (London), vol. 487, pp. 330–337, Jul 18, 2012. [DOI] [PMC free article] [PubMed] [Google Scholar]
- [3].Nguyen T, Shafi A, Nguyen T and Draghici S, “Identifying significantly impacted pathways: a comprehensive review and assessment,” Genome Biol, vol. 20, pp. 203, 2019. [DOI] [PMC free article] [PubMed] [Google Scholar]
- [4].Subramanian A, Tamayo P, Mootha VK, Mukherjee S, Ebert BL, Gillette MA, Paulovich A, Pomeroy SL, Golub TR, Lander ES and Mesirov JP, “Gene set enrichment analysis: A knowledge-based approach for interpreting genome-wide expression profiles,” Proceedings of the National Academy of Sciences, vol. 102, pp. 15545–15550, 2005. [DOI] [PMC free article] [PubMed] [Google Scholar]
- [5].Ogata H, Goto S, Sato K, Fujibuchi W, Bono H and Kanehisa M, “KEGG: Kyoto Encyclopedia of Genes and Genomes,” Nucleic Acids Research, vol. 27, pp. 29–34, Jan 1, 1999. [DOI] [PMC free article] [PubMed] [Google Scholar]
- [6].Jassal B, Matthews L, Viteri G, Gong C, Lorente P, Fabregat A, Sidiropoulos K, Cook J, Gillespie M, Haw R, Loney F, May B, Milacic M, Rothfels K, Sevilla C, Shamovsky V, Shorser S, Varusai T, Weiser J, Wu G, Stein L, Hermjakob H and D’Eustachio P, “The reactome pathway knowledgebase,” Nucleic Acids Research, vol. 48, pp. D498–D503, Jan 8, 2020. [DOI] [PMC free article] [PubMed] [Google Scholar]
- [7].Draghici S, Khatri P, Tarca AL, Amin K, Done A, Voichita C, Georgescu C and Romero R, “A systems biology approach for pathway level analysis,” Genome Research, vol. 17, pp. 1537–1545, Oct. 2007. [DOI] [PMC free article] [PubMed] [Google Scholar]
- [8].Tarca AL, Draghici S, Khatri P, Hassan SS, Mittal P, Kim J, Kim CJ, Kusanovic JP and Romero R, “A novel signaling pathway impact analysis,” Bioinformatics, vol. 25, pp. 75–82, Jan 1, 2009. [DOI] [PMC free article] [PubMed] [Google Scholar]
- [9].Vaske CJ, Benz SC, Sanborn JZ, Earl D, Szeto C, Zhu J, Haussler D and Stuart JM, “Inference of patient-specific pathway activities from multi-dimensional cancer genomics data using PARADIGM,” Bioinformatics (Oxford, England), vol. 26, pp. i237–i245, Jun 15, 2010. [DOI] [PMC free article] [PubMed] [Google Scholar]
- [10].Dutta B, Wallqvist A and Reifman J, “PathNet: a tool for pathway analysis using topological information,” Source Code for Biology and Medicine, vol. 7, pp. 10, Sep 24, 2012. [DOI] [PMC free article] [PubMed] [Google Scholar]
- [11].Nam S, Chang HR, Kim K, Kook M, Hong D, Kwon CH, Jung HR, Park HS, Powis G, Liang H, Park T and Kim YH, “PATHOME: an algorithm for accurately detecting differentially expressed subpathways,” Oncogene, vol. 33, pp. 4941–4951, Oct 9, 2014. [DOI] [PMC free article] [PubMed] [Google Scholar]
- [12].Liu C, Lehtonen R and Hautaniemi S, “PerPAS,” Tcbb, vol. 15, pp. 1022–1027, May 1, 2018. [DOI] [PubMed] [Google Scholar]
- [13].Zhao Y, Hoang TH, Joshi P, Hong SH, Giardina C and Shin DG, “A route-based pathway analysis framework integrating mutation information and gene expression data,” Methods, vol. 124, pp. 3–12, Jul 15. 2017. [DOI] [PubMed] [Google Scholar]
- [14].Kikuchi M, Yoshida M, Okabe M and Umemura K, “Confidence interval of probability estimator of Laplace smoothing,” in 2015 2nd International Conference on Advanced Informatics: Concepts, Theory and Applications (ICAICTA), pp. 1–6, 2015. [Google Scholar]
- [15].Mikels AJ and Nusse R, “Purified Wnt5a protein activates or inhibits beta-catenin-TCF signaling depending on receptor context,” PLoS Biol, vol. 4, pp. e115, Apr. 2006. [DOI] [PMC free article] [PubMed] [Google Scholar]
- [16].Therneau TM and Grambsch PM, Modeling Survival Data: Extending the Cox Model, Springer-Verlag; New York, 2020. [Google Scholar]
- [17].Cerami E, Gao J, Dogrusoz U, Gross BE, Sumer SO, Aksoy BA, Jacobsen A, Byrne CJ, Heuer ML, Larsson E, Antipin Y, Reva B, Goldberg AP, Sander C and Schultz N, “The cBio cancer genomics portal: an open platform for exploring multidimensional cancer genomics data,” Cancer.Discov, vol. 2, pp. 401–404, May. 2012. [DOI] [PMC free article] [PubMed] [Google Scholar]
- [18].Colussi D, Brandi G, Bazzoli F and Ricciardiello L, “Molecular Pathways Involved in Colorectal Cancer: Implications for Disease Behavior and Prevention,” International Journal of Molecular Sciences, vol. 14, pp. 16365–16385, Aug 7, 2013. [DOI] [PMC free article] [PubMed] [Google Scholar]
- [19].Jung B, Staudacher JJ and Beauchamp D, “Transforming Growth Factor β Superfamily Signaling in Development of Colorectal Cancer,” Gastroenterology, vol. 152, pp. 36–52, Jan. 2017. [DOI] [PMC free article] [PubMed] [Google Scholar]
- [20].Wang Y, Yu L, Ding J and Chen Y, “Iron Metabolism in Cancer,” International Journal of Molecular Sciences, vol. 20, pp. 95, Dec 27, 2018. [DOI] [PMC free article] [PubMed] [Google Scholar]
- [21].Loeb KR and Loeb LA, “Significance of multiple mutations in cancer,” Carcinogenesis (New York), vol. 21, pp. 379–385, 2000. [DOI] [PubMed] [Google Scholar]
- [22].Hoadley KA, Yau C, Wolf DM, Cherniack AD, Tamborero D, Ng S, Leiserson MDM, Niu B, McLellan MD, Uzunangelov V, Zhang J, Kandoth C, Akbani R, Shen H, Omberg L, Chu A, Margolin AA, van’t Veer LJ, Lopez-Bigas N, Laird PW, Raphael BJ, Ding L, Robertson AG, Byers LA, Mills GB, Weinstein JN, Van Waes C, Chen Z, Collisson EA, Benz CC, Perou CM and Stuart JM, “Multiplatform Analysis of 12 Cancer Types Reveals Molecular Classification within and across Tissues of Origin,” Cell (Cambridge), vol. 158, pp. 929–944, 2014. [DOI] [PMC free article] [PubMed] [Google Scholar]
- [23].Coventry BJ, Lee P, Gibbs D and Hart DNJ, “Dendritic cell density and activation status in human breast cancer – CD1a, CMRF-44, CMRF-56 and CD-83 expression,” British Journal of Cancer, vol. 86, pp. 546–551, 2002. [DOI] [PMC free article] [PubMed] [Google Scholar]
- [24].Lee C, Chen L, Yu C, Lin W, Lin VC, Huang C, Lu T, Huang S and Bao B, “Prognostic Value of CD1B in Localised Prostate Cancer,” International Journal of Environmental Research and Public Health, vol. 16, pp. 4723, 2019. [DOI] [PMC free article] [PubMed] [Google Scholar]
- [25].Qie S and Diehl JA, “Cyclin D1, cancer progression, and opportunities in cancer treatment,” J Mol Med, vol. 94, pp. 1313–1326, 2016. [DOI] [PMC free article] [PubMed] [Google Scholar]
- [26].Zaidi N, Lupien L, Kuemmerle NB, Kinlaw WB, Swinnen JV and Smans K, “Lipogenesis and lipolysis: The pathways exploited by the cancer cells to acquire fatty acids,” Progress in Lipid Research, vol. 52, pp. 585–589, 2013. [DOI] [PMC free article] [PubMed] [Google Scholar]
- [27].Hansen JS, de Maré S, Jones HA, Göransson O and Lindkvist-Petersson K, “Visualization of lipid directed dynamics of perilipin 1 in human primary adipocytes,” Scientific Reports, vol. 7, pp. 15011–14, 2017. [DOI] [PMC free article] [PubMed] [Google Scholar]
- [28].Tyagi S, Sharma S, Gupta P, Saini A and Kaushal C, “The peroxisome proliferator-activated receptor: A family of nuclear receptors role in various diseases,” Journal of Advanced Pharmaceutical Technology and Research, vol. 2, pp. 236–240, 2011. [DOI] [PMC free article] [PubMed] [Google Scholar]
- [29].Zhao X, Liu J, Ge S, Chen C, Li S, Wu X, Feng X, Wang Y and Cai D, “Saikosaponin A Inhibits Breast Cancer by Regulating Th1/Th2 Balance,” Frontiers in Pharmacology, vol. 10, pp. 624, 2019. [DOI] [PMC free article] [PubMed] [Google Scholar]
- [30].Dai X, Li T, Bai Z, Yang Y, Liu X, Zhan J and Shi B, “Breast cancer intrinsic subtype classification, clinical use and future trends,” American Journal of Cancer Research, vol. 5, pp. 2929–2943,2015. [PMC free article] [PubMed] [Google Scholar]
- [31].Tomaskovic-Crook E, Thompson EW and Thiery JP, “Epithelial to mesenchymal transition and breast cancer,” Breast Cancer Research: BCR, vol. 11, pp. 213, 2009. [DOI] [PMC free article] [PubMed] [Google Scholar]
- [32].Mauri G, Sartore-bianchi A, Russo A, Marsoni S, Bardelli A and Siena S, “Early-onset colorectal cancer in young individuals,” Molecular Oncology, vol. 13, pp. 109–131, Dec 1, 2018. [DOI] [PMC free article] [PubMed] [Google Scholar]
- [33].Munsterberg A and Lovell-Badge R, “Expression of the mouse anti-mullerian hormone gene suggests a role in both male and female sexual differentiation,” Development, vol. 113, pp. 613, Oct 1, 1991. [DOI] [PubMed] [Google Scholar]
- [34].Beck T, Korobeynikov V, Kudinov A, Georgopoulos R, Solanki N, Andrews-Hoke M, Kistner T, Pépin D, Donahoe P, Nicolas E, Einarson M, Zhou Y, Boumber Y, Proia D, Serebriiskii I and Golemis E, “Anti-Müllerian Hormone Signaling Regulates Epithelial Plasticity and Chemoresistance in Lung Cancer,” Cell Reports (Cambridge), vol. 16, pp. 657–671,2016. [DOI] [PMC free article] [PubMed] [Google Scholar]
- [35].Tosolini M, Kirilovsky A, Mlecnik B, Fredriksen T, Mauger S, Bindea G, Berger A, Bruneval P, Fridman WH, Pagès F and Galon J, “Clinical impact of different classes of infiltrating T cytotoxic and helper cells (Th1, th2, treg, th17) in patients with colorectal cancer,” Cancer Res, vol. 71, pp. 1263–1271, Feb 15.2011. [DOI] [PubMed] [Google Scholar]
- [36].Ling A, Lundberg IV, Eklöf V, Wikberg ML, Öberg Å, Edin S and Palmqvist R, “The infiltration, and prognostic importance, of Th1 lymphocytes vary in molecular subgroups of colorectal cancer,” The Journal of Pathology: Clinical Research, vol. 2, pp. 21–31, Jan. 2016. [DOI] [PMC free article] [PubMed] [Google Scholar]
- [37].Pandey MK, Liu G, Cooper TK and Mulder KM, “Knockdown of c-Fos suppresses the growth of human colon carcinoma cells in athymic mice,” International Journal of Cancer, vol. 130, pp. 213–222, Jan 1, 2012. [DOI] [PMC free article] [PubMed] [Google Scholar]
- [38].Sakamoto KM and Frank DA, “CREB in the Pathophysiology of Cancer: Implications for Targeting Transcription Factors for Cancer Therapy,” Clinical Cancer Research, vol. 15, pp.2583–2587, 2009. [DOI] [PMC free article] [PubMed] [Google Scholar]
- [39].Zheng C, Hu H, Hong P, Zhang Q, Xu WW, He Q and Li B, “Significance of integrin-linked kinase (ILK) in tumorigenesis and its potential implication as a biomarker and therapeutic target for human cancer,” American Journal of Cancer Research, vol. 9, pp. 186–197, 2019. [PMC free article] [PubMed] [Google Scholar]
- [40].Tachibana Keisuke, Yamasaki Daisuke, Ishimoto Kenji and Doi Takefumi, “The Role of PPARs in Cancer,” PPAR Research, vol. 2008, pp. 102737–15, Dec 1, 2008. [DOI] [PMC free article] [PubMed] [Google Scholar]
- [41].Liu Y, Colby J, Zuo X, Jaoude J, Wei D and Shureiqi I, “The Role of PPAR-δ in Metabolism, Inflammation, and Cancer: Many Characters of a Critical Transcription Factor,” International Journal of Molecular Sciences, vol. 19, pp. 3339, 2018. [DOI] [PMC free article] [PubMed] [Google Scholar]
- [42].Punt S, Langenhoff JM, Putter H, Fleuren GJ, Gorter A and Jordanova ES, “The correlations between IL-17 vs. Th17 cells and cancer patient survival: a systematic review,” Oncoimmunology, vol. 4, pp. e984547, 2015. [DOI] [PMC free article] [PubMed] [Google Scholar]
- [43].Robles AI and Harris CC, “Clinical Outcomes and Correlates of TP53 Mutations and Cancer,” Cold Spring Harbor Perspectives in Biology, vol. 2, pp. a001016, 2009. [DOI] [PMC free article] [PubMed] [Google Scholar]
- [44].Padmanaban V, Krol I, Suhail Y, Szczerba BM, Aceto N, Bader JS and Ewald AJ, “E-cadherin is required for metastasis in multiple models of breast cancer,” Nature (London), vol. 573, pp. 439–444, 2019. [DOI] [PMC free article] [PubMed] [Google Scholar]
- [45].Rufini Alessandro, Agostini Massimiliano, Grespi Francesca, Tomasini Richard, Sayan Berna S., Niklison-Chirou Maria Victoria, Conforti Franco, Velletri Tania, Mastino Antonio, Mak Tak W., Melino Gerry and Knight Richard A., “p73 in Cancer Reprints and permission:”. [DOI] [PMC free article] [PubMed] [Google Scholar]
- [46].Jiang M, Chen J, Zhang W, Zhang R, Ye Y, Liu P, Yu W, Wei F, Ren X and Yu J, “Interleukin-6 Trans-Signaling Pathway Promotes Immunosuppressive Myeloid-Derived Suppressor Cells via Suppression of Suppressor of Cytokine Signaling 3 in Breast Cancer,” Frontiers in Immunology, vol. 8, pp. 1840, 2017. [DOI] [PMC free article] [PubMed] [Google Scholar]
- [47].Ghafouri-Fard S, Oskooei VK, Azari I and Taheri M, “Suppressor of cytokine signaling (SOCS) genes are downregulated in breast cancer,” World Journal of Surgical Oncology, vol. 16, pp. 226, 2018. [DOI] [PMC free article] [PubMed] [Google Scholar]
- [48].Vansaun MN, “Molecular Pathways: Adiponectin and Leptin Signaling in Cancer,” Clinical Cancer Research, vol. 19, pp. 1926–1932, Apr 15, 2013. [DOI] [PMC free article] [PubMed] [Google Scholar]
- [49].Hoang TH, Zhao Y, Lam Y, Piekos S, Han YC, Reilly C, Joshi P, Hong SH, Sung CO, Giardina C, and Shin DG, “BioTarget: A Computational Framework Identifying Cancer Type Specific Transcriptional Targets of Immune Response Pathways,” Sci.Rep, vol. 9, pp. 9029–x, Jun 21. 2019. [DOI] [PMC free article] [PubMed] [Google Scholar]