

Abstract
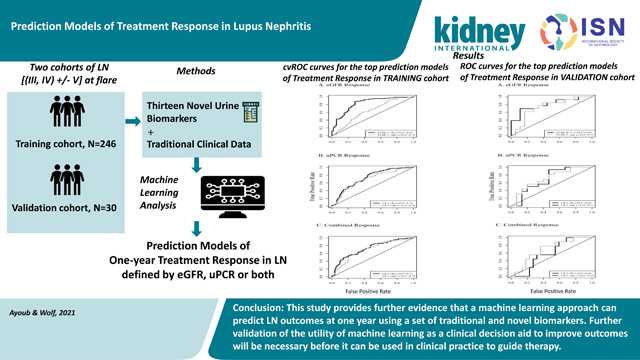
In order to develop prediction models of one-year treatment response in lupus nephritis, an approach using machine learning to combine traditional clinical data and novel urine biomarkers was undertaken. Contemporary lupus nephritis biomarkers were identified through an unbiased PubMed search. Thirteen novel urine proteins contributed to the top 50% of ranked biomarkers and were selected for measurement at the time of lupus nephritis flare. These novel markers along with traditional clinical data were incorporated into a variety of machine learning algorithms to develop prediction models of one-year proteinuria and estimated glomerular filtration rate (eGFR). Models were trained on 246 individuals from four different sub-cohorts and validated on an independent cohort of 30 patients with lupus nephritis. Seven models were considered for each outcome. Three quarters of these models demonstrated good predictive value with areas under the receiver operating characteristic curve over 0.7. Overall, prediction performance was the best for models of eGFR response to treatment. Furthermore, the best performing models contained both traditional clinical data and novel urine biomarkers, including cytokines, chemokines, and markers of kidney damage. Thus, our study provides further evidence that a machine learning approach can predict lupus nephritis outcomes at one year using a set of traditional and novel biomarkers. However, further validation of the utility of machine learning as a clinical decision aid to improve outcomes will be necessary before it can be routinely used in clinical practice to guide therapy.
Keywords: lupus nephritis, urine biomarkers, outcomes in lupus nephritis, prediction models in lupus nephritis
Graphical Abstract
Introduction
Lupus nephritis (LN) is a frequent and serious manifestation of systemic lupus erythematous (SLE). Clinically overt LN occurs in about 40–60% of SLE patients, and this varies among racial and ethnic groups1. LN is the result of glomerular accumulation of immune complexes (ICs). These ICs incite inflammation in the glomeruli and tubulointerstitium, which can lead to chronic damage and end-stage kidney disease (ESKD) if not treated early and successfully. Despite treatment, ESKD still occurs in up to 26% of patients2. Furthermore, among LN patients, those with chronic kidney damage have the highest mortality3,4.
Although studies have shown that reducing proteinuria to less than 0.7–0.8g/d by 1 year of treatment predicts good long-term kidney outcomes5,6, traditional clinical biomarkers and kidney histology at the start of therapy do not accurately predict short and long-term kidney outcomes7. For instance, in a univariate analysis of traditional clinical biomarkers to predict treatment response in LN, only urine protein/creatinine (uPCR) and eGFR had area under the receiver operating characteristic curve (AUC) values significantly above 0.5, however with poor discriminative power (ROC AUC 0.65 and 0.62 respectively)8. Furthermore, it is unclear how much the ISN/RPS classification of LN or the NIH LN activity and chronicity indices help predicting outcomes. Whether LN class III, IV-S and IV-G show different outcomes remain controversial7. This may be explained in part by the fact that many different molecular injury pathways may result in similar clinical manifestations (that is hematuria, proteinuria and impaired kidney function) and histologic findings but will respond to therapy differently. In contrast, molecular analysis of the kidney biopsy at LN flare showed that responders and non-responders clustered independently before treatment initiation9, suggesting the possibility that novel biomarkers at treatment initiation could identify patients likely to respond or not respond to therapy. Ideally, such biomarkers would reflect intra-renal injury pathways and could be measured non-invasively, for example in the urine. In this context, many putative urinary biomarkers of LN activity have been proposed, but few have been studied as baseline predictors of one-year clinical kidney outcomes, or validated in an unbiased fashion in multicenter cohorts10. Recently, the application of machine learning to biomarker panels has been suggested to improve their predictive power8. The objective of this investigation was to apply machine learning to combine traditional clinical data and novel urine biomarkers that had been identified in an unbiased fashion from the literature to develop prediction models of one-year treatment response in patients with LN.
Methods
Design.
Considerable research over the last several years has been devoted to the identification of urine biomarkers for various aspects of the LN disease process. None of these biomarkers has been adopted for clinical use for a variety of reasons, including lack of validation in independent cohorts, evaluation only in cross-sectional cohorts, lack of superiority over clinical markers, and the assumption that a single biomarker would be sufficient. We postulated that at least some of these biomarkers had clinical potential. Therefore, the existing biomarker literature was leveraged to find the most promising novel urine biomarkers that could conceivably predict treatment response. These biomarkers were modeled with machine learning in an existing longitudinal LN cohort, and validated in an independent cohort. All research was done in accordance with the Declaration of Helsinki and was approved by the Ohio State University and the Medical University of South Carolina Institutional Review Boards.
Selection of urine biomarkers from the literature.
The contemporary LN biomarker literature used for this investigation was identified by a pre-specified search of PubMed using the terms “biomarker AND lupus nephritis AND disease (activity or damage) AND humans AND (“last 10 years”[PDat])”. This generated a list of 283 original articles published between 2006 and July 2016. Based on the Cochrane criteria for quality of evidence (supplement 1), urine protein biomarkers for LN were rank-ordered and the top 50% of ranked biomarkers (supplement 1) were selected for experimental investigation. Ranking criteria included: 1) the biologic plausibility of the biomarker based on animal and human studies to date, 2) the rigor of the outcome tested, 3) the diversity of the cohort against which the model was tested, 4) whether the biomarker cohort was longitudinal, prospective, or included independent validation, 5) the size of the test and validation cohorts, 6) statistical significance of the association between the marker and outcomes, and 7) the number of independent studies reporting the biomarker. We also included 3 biomarkers (adiponectin, CXCL4, and epidermal growth factor (EGF)) that had high-quality evidence published after 2016.
Cohorts.
The study population included a training cohort of 246 participants and an independent validation cohort of 30 participants. Table 1 describes patient characteristics and supplement 2 describes the origin of the LN cohorts in detail. All patients had LN class II, III, IV, V or mixed (III or IV+V) based on the ISN/RPS classification and newly active nephritis defined by a new increase in 24-hour urine protein of 500 mg or of spot uPCR of 0.5 g/g.
Table 1:
Characteristics of the study population (IQR = inter quartile range)
| Characteristic | Training Cohort N = 246 | Test Cohort N = 30 |
|---|---|---|
| Demographics | ||
| Age, years, mean (SD) | 31.2 (10.4) | 32.8 (8.09) |
| Sex, Female, n (%)* | 205 (83.3) | 30 (100.0) |
| Race, n (%)* | ||
| White | 97 (39.4) | 17 (56.7) |
| Black | 46 (18.7) | 10 (33.3) |
| Hispanic | 20 (8.13) | 0 (0.00) |
| Asian | 83 (33.7) | 3 (10.0) |
| Clinical Information, median (IQR; range) | ||
| LN Class, n (%) | ||
| II | 1 (0.41) | 0 (0.00) |
| V+II | 9 (3.66) | 4 (13.3) |
| III, IV | 186 (75.6) | 19 (63.3) |
| III+V, IV+V | 38 (15.4) | 6 (20.0) |
| No biopsy | 12 (4.88) | 1 (3.33) |
| C3, mg/dL* | 64.2 (35.3; 13.8–150) | 74.0 (28.5; 40.0–152) |
| C4, mg/dL | 13.0 (8.0; 4.4–58.0) | 13.0 (8.5; 2.0–25.0) |
| Anti-dsDNA, IU/mL | 83.3 (235.5; 0–3500) | 19 (64.5)** |
| Urine Protein:Creatinine, g/g | 2.06 (2.86; 0.00–11.0) | 2.21 (2.41; 1.08–16.5) |
| Estimated Glomerular Filtration Rate, mL/min* | 103 (46.0, 15.0–166) | 72.9 (54.3; 16.0–133.8) |
| Response Rates | ||
| eGFR strict* | 193 (78.5) | 13 (43.3) |
| eGRF relaxed | 226 (91.9) | 26 (86.7) |
| uPCR strict | 113 (45.9) | 16 (53.3) |
| uPCR relaxed | 140 (56.9) | 18 (60.0) |
| Combined strict | 102 (41.5) | 10 (33.3) |
| Combined relaxed | 136 (55.3) | 18 (60.0) |
Indicated P<0.05 for the comparison of the cohorts. Statistical significance was assessed using the Wilcoxon rank sum test for continuous variables and the Fisher’s exact test for categorical variables.
Anti-dsDNA in the external validation cohort was measured as positive/negative thus the results here are reported as n (%) of patients who were positive.
Urine analyte measurements.
All urine samples were centrifuged to remove cellular debris and frozen at −80°C. Frozen urine samples were shipped on dry ice using overnight express delivery. To avoid repeated freeze/thaws, samples were thawed once on ice, sub-aliquoted, re-frozen at −80°C, and individual aliquots were thawed immediately before use. Each urine sample was assessed for the concentrations of 13 analytes, osteoprotegerin (OPG), vascular cell adhesion molecule 1(VCAM-1), macrophage colony stimulating factor (M-CSF), interleukin 8 (IL-8 or chemokine (C-X-C motif) ligand 8, CXCL8), pentraxin-3 (PTX3), platelet factor 4 ((C-X-C motif) ligand 4, CXCL4), monocyte chemoattractant protein-1 (MCP-1), interleukin-2 receptor alpha chain (CD25), T-cell immunoglobulin mucin-1/kidney injury molecule-1 (TIM-1/KIM1), tumor necrosis factor-related weak inducer of apoptosis (TWEAK), adiponectin, epidermal growth factor (EGF) and neutrophil gelatinase-associated lipocalin (lipocalin/NGAL), using Luminex custom assay kits (R&D) and the FlexMap 3D system (ThermoFisher). Preliminary experiments were performed to determine urine dilution factors to reach the linear range of the standard curves. Most analytes were assayed in duplicate using 1:1 assay buffer-diluted urine samples, except OPG and VCAM-1, which were assayed using undiluted urine samples, and EGF, Adiponectin and Lipocalin-2/NGAL, which were assayed using 1:11-diluted urine samples. An equal percentage of samples from each of the studies in the training cohort were represented on each Luminex plate. Validation samples were measured using the same batch of assay plates as a replication set. Duplicate urine samples were run in all assay plates, and the intra-assay coefficient of variation was determined to be <10%. All results were normalized to urinary creatinine prior to analysis. Urine creatinine measurements were performed using a creatinine colorimetric detection kit (Enzo Biochem, Inc.,Catalog No. ADI-907–030A). Coefficients of variability for the creatinine measurements were 5.3% intra-assay and 5.9% inter-assay.
Flare and outcome clinical laboratory measures.
Baseline samples at flare were collected pre-induction therapy. Baseline disease activity measures were used for model development (C3 and C4 complement and anti-double stranded DNA antibodies), and baseline and 1-year estimated glomerular filtration rate (eGFR), and uPCR were used to determine treatment response. These assays were performed in Clinical Laboratory Improvement Amendments (CLIA)-certified laboratories. Treatment response determinations are described in the statistical methods.
Statistical Methods.
Demographic, clinical and 13 putative urine biomarkers collected on 246 subjects from 4 cohorts (BMS, LUNAR, CCCR, and MUSC) were used to develop prediction models of treatment response in patients with LN. Demographic variables (n=3) included age, sex, and race/ethnicity (Black, White, Hispanic, Asian) and clinical variables (n=5) at time of flare included uPCR, eGFR, complement components C3 and C4, and anti-dsDNA titer. Models were trained on the 246 subjects from the four cohorts and validated on an independent validation cohort (the OSS cohort) of 30 patients with LN with renal response at one-year. Renal response at 1 year was determined by criteria listed in Table 2. The strict renal response criteria were based on the current standard definitions of renal response at 1 year and the relaxed uPCR criteria were reflective of a good long-term kidney outcomes5,6. The training cohort used in model development includes 246 participants with response rates for the different definitions of clinical response ranging from 41.5 to 91.2%. A post-hoc power analysis was conducted considering the largest response rate of 91.2%. A sample 246 participants of whom 226 respond provides ≥ 85% power to detect a clinically meaningful area under the receiver operating characteristic curve (AUC) of 0.7 or higher compared to null value of 0.5 for all outcomes.
Table 2:
Definitions of the six clinical responses considered as potential outcomes in prediction models.
| Response Category | Response Criterion |
|---|---|
| Strict eGFR Response | eGFR > 90 ml/min at 1 year OR eGFR showed a 25% improvement from baseline |
| Relaxed eGFR Response | eGFR > 90 ml/min at 1 year OR eGFR showed no more than a 25% reduction from baseline |
| Strict uPCR Response | uPCR < 0.5 at 1 year |
| Relaxed uPCR Response | uPCR < 0.8 at 1 year |
| Strict Combined Response | uPCR < 0.5 AND (eGFR > 90 ml/min at 1 year OR eGFR showed a 25% improvement from baseline) |
| Relaxed Combined Response | uPCR < 0.8 AND (eGFR > 90 ml/min at 1 year OR eGFR showed no more than a 25% reduction from baseline) |
Given that no one statistical modelling approach consistently provides the best prediction performance across varied data sets, we developed and evaluated prediction models with different statistical and machine learning modeling approaches. Patients with missing baseline (flare) and outcome response measures were excluded. Multivariable classification models considered in this study included logistic regression (LR), Classification and Regression Trees (CART), Random Forrest (RF), support vector machines with linear, polynomial, radial basis kernels (SVML, SVMP, and SVMR respectively), and artificial neural networks (ANN). All the proposed machine learning approaches require tuning prior to model fitting. Tuning parameters for the different models considered were selected using cross-validation and the train function in the ‘caret’ package in R. Models for each approach were selected using the repeated 10-fold cross validated area under the receiver operating characteristics curve (cvAUC) and recursive backward selection similar to the approach by Shi et al11,12. Corrected ten-fold CV randomly splits the data into 10 approximately equally sized subsets and models are fit using 9/10 of the data and the AUC is determined on the 1 subset excluded when fitting the model and this is repeated for all 10 subsets. Repeated cross-validation then repeats this procedure of generating 10-folds to alleviate the randomness of fold generation11,13. Variable selection for all models was conducted using recursive backwards selection conducted within a repeated cross-validation framework starting with models including all predictors and recursively removing the predictor yielding the largest mean 10-fold cross-validated AUC (cvAUC) when removed from a given model; this process was repeated until only one predictor remained. The predictors had between 0–10% missing values. Missing values were imputed in each cross-validation test and training set independently using the rfImpute function in the randomForest package. This approach initializes all missing values as the median for each variable and then iterates between building a RF model on the completed data and updating all missing observations using a weighted average of non-missing observations estimated by the proximity matrix from the RF model fit at each iteration14 Additionally, 7 of the 13 of the biomarkers had one or more values below the limit of detection (LOD) for subjects within the dataset. All values below the LOD where set to 15. The final model selected for each approach was the model yielding the largest cvAUC from among the models considered at each step in variable selection. The 10-fold cvAUC was determined using the ‘cvAUC’ package in R16. We also examined consistency of predictors across models with cvAUC ≥ 0.7. Consistency was defined as the proportion of models with cvAUC ≥ 0.7 that include a given predictor.
Models selected for each outcome were externally validated in an independent validation cohort (the OSS cohort) that included 30 patients with LN. For validation, the selected model for each outcome was fit on the full training data and each model was applied to the OSS validation cohort to predict the outcome. Evaluation of prediction performance on the external validation data was conducted by estimating the AUC based on predicted probability of response for these data for each model. A 95% confidence interval for all validation AUCs was calculated using a bootstrap sampling approach based on 1000 bootstrap samples. Variables in the OSS cohort had between 0–10% missing values; additionally, dsDNA antibody was collected as positive or negative because assay methodology and normal ranges changed over time. Prior to validation, clinical and biomarker values were imputed using rfImpute. Imputation of dsDNA antibody was conducted as follows: for subjects negative for dsDNA antibody, their value was imputed as the 5th percentile for dsDNA antibody values in the original training data while all subjects positive for dsDNA antibody were imputed with the other missing clinical and urine biomarker values.
Although modern machine learning models can often provide better prediction performance relative to the traditional regression-based approaches, they provide little to no information on the direction of the relationship between predictors in the model and the outcome. To provide insight into how demographic, clinical, and urine biomarkers impacted the different responses, we fit a series of univariate logistic regression models of each response for the different predictors. All analyses were conducted in R v. 4.1.
Results
The final study population included 246 participants from 4 sub-cohorts: 155 from a randomized, controlled trial of abatacept in lupus nephritis (BMS)17, 44 from a randomized controlled trial of rituximab in lupus nephritis (LUNAR)18, 24 from the Core Center for Clinical Research longitudinal registry at MUSC (CCCR), and 23 patients from a separate longitudinal cohort of lupus nephritis patients in flare at MUSC. The largest proportion of patients were White or Asian (39.4% and 33.7%) and female (83.3%). The mean age of study participants was 31.2 ± 10.4 years. Characteristics of the study population are shown in Table 1.
Performance of All Prediction Models:
Seven different prediction models were considered for each outcome (Table 2) using a data-driven approach based on repeated 10-fold cross validation to select the subset of variables yielding the largest prediction performance. The average cross-validated area under the curve (cvAUC) indicated good prediction performance, defined as a mean cvAUC > 0.7 for a majority (76%) of the models. For a majority of the outcomes, the cvAUCs for the best fitting models of each model type (LR, RF, SVML, SVMP, SVMR, and NN) were similar (Figure S1) although CART showed consistently poor performance. The mean cvAUCs for models of eGFR response ranged from 0.65–0.85 with the best prediction performance for the SVM models with the linear or radial basis kernel for the strict eGFR outcome. The mean cvAUCs for uPCR response ranged from 0.56 to 0.76 with the logistic regression model for the strict uPCR outcome exhibiting the best performance. Models for the combined response had mean cvAUCs ranging from 0.62 to 0.75 and the best performance was for the RF model for the relaxed response. In general, prediction performance was similar for the relaxed and strict outcome definitions. Overall prediction performance was the best for models where treatment response was defined by eGFR. Model characteristics, including number of predictors and mean cvAUC, for each model by outcome is provided in supplemental Table S1.
We also examined the consistency of predictors selected for each outcome across different models. Twelve of the 14 prediction models developed to predict eGFR response using either the strict or relaxed definition had mean cvAUC > 0.7. Among these 12 models, race, sex, C3, baseline eGFR, baseline uPCR, CXCL8, and pentraxin were included in at least 50% of the models with race and eGFR occurring in all 12 models. Eight of the 14 models developed to predict uPCR response had a mean cvAUC > 0.7. Among these 8 models, race, C4, anti-dsDNA, baseline uPCR, adiponectin, CXCL8, and MCP1 were in at least 50% of the models with race and baseline uPCR included in all 8 models. Eleven of the models for predicting the combined response had a mean cvAUC > 0.7. Age, race, C4, anti-dsDNA, baseline eGFR, baseline uPCR, adiponectin, EGF, CXCL8, and MCP1 were included in at least 50% of the 11 models and race, baseline uPCR and adiponectin were the most consistently selected (>80% of models). Across the different outcomes, race, baseline uPCR, and CXCL8, were the only variables included in >50% of models. Adiponectin was noted in 48.5% of the models as well. Supplemental Table S2 shows the proportion of times variables were included in models with mean cvAUC > 0.7 for each outcome. The best models that predict response based on eGFR outperformed the model that considered treatment response based on uPCR only or based on combined eGFR and uPCR response. We consider the best prediction models for treatment response defined by these three metrics separately and in greater detail below.
Models of Treatment Response Based on eGFR:
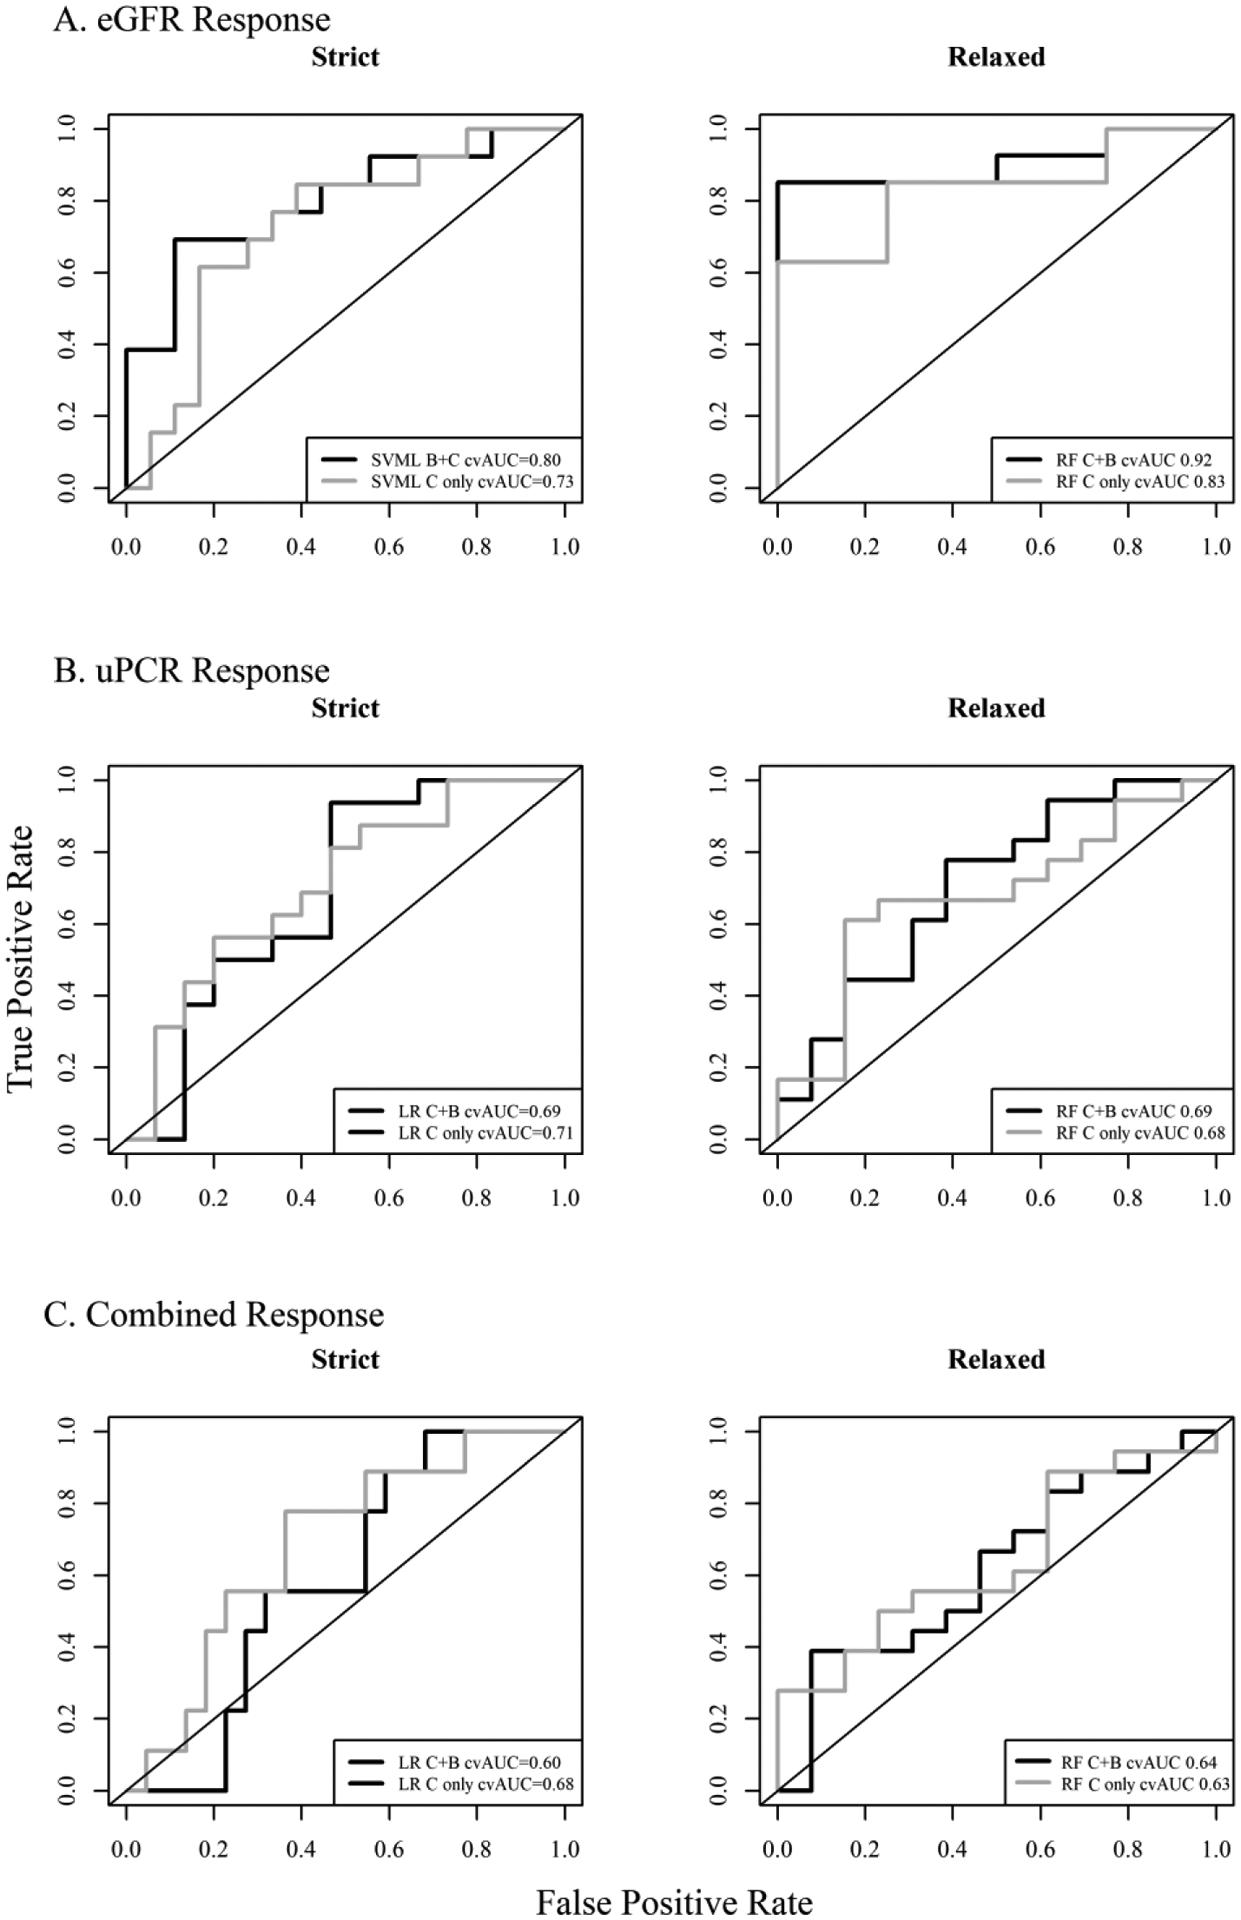
The prediction model with the largest mean cvAUC for predicting treatment response as defined by the strict eGFR criterion was the SVM model with the radial kernel and 11 variables though the cvAUC fo the SVM with the linear kernel and 8 variables was comparable (cvAUC = 0.84) (Table 3). However, the SVM model with the linear kernel was selected as top performer as it had a higher validation AUC compared to the SVM with the radial kernel. The best model for predicting the relaxed eGFR response was the RF model including 7 variables. The SVM model for strict eGFR response included patient’s age, race, baseline eGFR, baseline uPCR, and the urine biomarkers CXCL8, pentraxin, MCSF, and adiponectin. The RF model included the patient’s sex, race, baseline eGFR and uPCR and the urine biomarkers CXCL8, lipocalin, and VCAM1. SVML and RF models including only the clinical characteristics were also developed to examine the impact of urine biomarkers on prediction. The mean cvAUC in the SVML and RF models including only clinical markers were 0.761 and 0.673 respectively compared to 0.841 and 0.834 in the models that included clinical and urine markers (Table 3). The receiver operating characteristic (ROC) curves for these models are shown in Figure 1A. The first panel in Figure 1A shows the cvROC curves for the SVM model with the linear kernel for strict eGFR response with clinical markers only (grey), and with clinical and urine markers (black), and shows the improvement in performance when urine biomarkers are included. The cvROC curves for the RF model with and without urine biomarkers shows an even more marked improvement in performance with inclusion of the urine biomarkers. Performance was also evaluated after stratification by LN class. The mean cvAUC for patients of class III or IV only and the mean cvAUC of patients with class III+V or IV+V are shown in Table S3. In both the SVML model of strict eGFR response and the RF model of relaxed eGFR response, the mean cvAUC was somewhat higher in III+V or IV+V patients compared to patients of class III or IV. Classes II, V, and II+V were not considered due to limited number of patients in these classes. Figure 2A provides the relative importance of the variables included in the SVML and RF models for the strict and relaxed eGFR response outcomes. Both models rank baseline eGFR, baseline uPCR, and race as the top 3 most important variables for predicting eGFR response at one-year. Pentraxin is the highest ranked urine biomarker in the SVML model of strict eGFR response but it’s relative importance is markedly smaller than the top 3 predictors. However, in the RF model of relaxed eGFR response, the three urine markers, VCAM1, CXCL8, and lipocalin have similar relative importance to baseline uPCR.
Table 3:
Area under the receiver operating characteristics curves for the six selected models (1) including both clinical and urine biomarkers and (2) including clinical markers only. Values presented are the internal validation cvAUC (95% CI) based on the repeated 10-fold cross-validation using the 4 training cohorts used in model development and the external validation AUC (95% CI) based on predicted probabilities and observed outcomes in the external OSS validation cohort. 95% confidence intervals for the cvAUC were estimated using the approach described by LeDell et al (2012) and 95% confidence intervals for the external validation AUC were calculated using a bootstrap sampling approach based on 1000 bootstrap samples.
| Response | Model | Type | Internal cvAUC (95% CI) | Validation AUC (95% CI) |
|---|---|---|---|---|
| Strict eGFR | SVML | clinical + biomarker | 0.84 (0.77, 0.91) | 0.80 (0.62, 0.95) |
| Relaxed eGFR | RF | clinical + biomarker | 0.83 (0.75, 0.91) | 0.92 (0.80, 1.00) |
| Strict uPCR | LR | clinical + biomarker | 0.76 (0.68, 0.82) | 0.69 (0.48, 0.87) |
| Relaxed uPCR | RF | clinical + biomarker | 0.74 (0.68, 0.83) | 0.69 (0.47, 0.87) |
| Strict Combined | LR | clinical + biomarker | 0.73 (0.64, 0.81) | 0.60 (0.41, 0.79) |
| Relaxed Combined | RF | clinical + biomarker | 0.74 (0.67, 0.82) | 0.64 (0.44, 0.84) |
Figure 1.

Repeated 10-fold cross-validated receiver operating characteristics curves for the top prediction models of treatment response defined by (A) eGFR, (B) uPCR, and (C) combined eGFR and uPCR response using the strict and relaxed definitions for each outcome. Black lines are the ROC curves for the models including clinical and urine biomarkers and grey lines are for models including only clinical markers.
Figure 2:

Relative variable importance of the variables selected for inclusion in the top performing models of treatment response defined by (A) eGFR, (B) uPCR, and (C) combined eGFR and uPCR response using the strict and relaxed definitions for each outcome. Relative importance is calculated as the difference in the accuracy for the 10-fold cross validated prediction to models fit to the original data and models fit to data with the jth variable permuted.
Models of Treatment Response Based on uPCR:
The prediction model of the strict definition of uPCR response with the largest mean cvAUC was logistic regression including 12 variables with a cvAUC = 0.759. The best prediction model of uPCR response based on the relaxed definition of response was the RF model that included 8 variables and had a cvAUC = 0.743. The model of strict uPCR response included baseline uPCR, race, clinical measures C4 and anti-dsDNA, and six urine markers: CXCL8, adiponectin, MCP1, TIM1/KIM1, VCAM1, and osteoprotogerin. Consistent with the model based on the strict uPCR response definition, the models based on the relaxed definitions also included baseline uPCR, race, C4, and CXCL8. The RF model for relaxed uPCR response also included age, lipocalin, and TWEAK. Figure 1B shows the ROC curves for the LR and RF models for strict or relaxed uPCR response with clinical markers only (grey) and with clinical and urine markers (black). Inclusion of urine markers in both models does show an improvement in cvROC of 0.06 units. Performance was also stratified by LN class. The mean cvAUC for patients of class III or IV only and the mean cvAUC of patients of class III+V or IV+V were determined (Table S3). Performance was similar for strict uPCR response in both subsets of patients. However, the mean cvAUC was somewhat higher in III or IV patients compared to class III+V or IV+V.
Figure 2B provides the relative importance of the variables included in the LR and RF models for the strict and relaxed uPCR response outcomes. In both models baseline uPCR was found to be the most important predictor while all other variables in the models had similar but much more modest relative importance. Of note, CXCL8 was the most important urine biomarkers in both models.
Treatment Response Based on Combined Response:
The prediction model of the strict definition of the combined uPCR and eGFR response with the largest mean cvAUC was the LR model including 10 variables with a cvAUC = 0.733. The best prediction model of combined response based on the relaxed definition of response was the RF model that included 8 variables and had a cvAUC = 0.755. The model of strict combined response included baseline uPCR, baseline eGFR, race, C4 and 6 urine markers: adiponectin, CXCL8, EGF, IL2rα, MCP1, and VCAM1. Consistent with the model based on the strict combined response definition, the RF model based on the relaxed definitions also included baseline uPCR, baseline eGFR, race, C4, adiponectin, and EGF. The RF model also included patient age and TIM1/KIM1. Figure 1C shows the cvROC curves for the LR and RF models strict or relaxed combined response with clinical markers only (grey) and with clinical and urine markers (black). Inclusion of urine markers in the LR model for strict response showed a 0.03 unit decrease in AUC when urine markers were excluded from the model and the RF model of relaxed response showed a 0.05 unit decrease. Performance by LN class for the combined response is also shown in Table S3. Performance by class was similar for the relaxed combined response, but the mean cvAUC was somewhat higher in LN III or IV compared to LN III+V or IV+V patients.
Figure 2C provides the relative importance of the variables included in the models for the strict and relaxed combined response outcomes. In both, uPCR is identified as having the most relative importance for determining the outcome. The model of strict combined response includes 6 urine biomarkers and among these, adiponectin, CXCL8, and VCAM1 are the highest ranked predictors for relative importance. The urine markers EGF, MCP1, and IL2rα have a relatively low rank. The RF relaxed model included 3 urine biomarkers among the 8 variables included in the model and they are ranked in the top five in terms of relative importance.
External Validation Using the OSS Cohort:
All six models described in the previous section were externally validated using the OSS cohort. It is anticipated that the AUC ROC for an external validation set will be lower than an internally validated AUC (e.g. the average 10-fold cvAUC calculated for all models). The models of strict and relaxed eGFR response and strict and relaxed uPCR all validated reasonably well in the OSS cohort. The models of strict eGFR and uPCR responses showed a decrease between the cvAUC and the validation AUC of 0.04 and 0.07 respectively while the RF model of relaxed eGFR response showed improved AUC in the validation cohort (Table 3). The models of the strict and relaxed combined response however did not perform as well in the external validation set as the AUCs decreased by 0.13 for the LR model of strict combined response and declined by 0.10 for the RF model of relaxed combined response. Validation of models including only clinical predictors were also considered and these models exhibited similar to better validation (i.e. smaller decreases in AUC) compared to the models including both clinical and urine markers. The ROC curves for each model generated from the OSS cohort are shown in Figure 3. The validation AUCs for the best fitting models of each type are also provided in Table S1.
Figure 3:
Receiver operating characteristics curves for the external validation OSS cohort for the top prediction models of treatment response defined by (A) eGFR, (B) uPCR, and (C) combined eGFR and uPCR response using the strict and relaxed definitions for each outcome. Black lines are the ROC curves for the models including clinical and urine biomarkers and grey lines are for models including only clinical markers.
Direction of the Relationship between Treatment Response and Predictors:
The distributions of the 13 biomarkers for the training cohort by treatment response status using the strict definitions of response are provided in Table S4. Odds ratios with 95% confidence intervals for each response by each predictor estimated from univariate logistic regression models are reported in supplemental Table S5. Older subjects exhibited lower odds of treatment response using the strict eGFR definition. Additionally, males had lower odds of eGFR response. Blacks had lower odds of treatment response relative to whites, Hispanics, and Asians across all response categories. Lower uPCR and higher eGFR at baseline were associated with greater odds of treatment response.
In univariate models, the urine biomarkers EGF, adiponectin, TIM1/KIM1, lipocalin, and MCSF exhibited modest impact on treatment response. EGF had the strongest effect with greater odds of treatment response with higher levels of EGF by all definitions. Higher levels of adiponectin and TIM1/KIM1 were associated with decreased odds of response by uPCR and combined definitions. Similarly, a lower odds of response was observed with higher levels of lipocalin when response was defined by uPCR or the combined response but only for the relaxed definitions. Finally, increased levels of MCSF were associated with higher odds of response by the strict eGFR definition.
Discussion
Using a set of high potential yield LN urine biomarkers derived from the literature, along with demographic and clinical variables, one-year post-LN treatment proteinuria and kidney function responses were modeled using statistical and machine learning approaches. Overall, we found that modeling eGFR provided robust differentiation between patients who would maintain or improve kidney function and patients who would go on to have a decline in kidney function. These models also validated well in an independent LN cohort. This is relevant in that the goal of LN treatment is to preserve kidney function. Modeling the proteinuria response after one-year of treatment was more difficult, and modeling the combination of kidney function and proteinuria provided only modest differentiation between patients who would do well and who would not. Furthermore, these models did not validate well in an independent LN cohort. This is concerning because one-year outcomes based on proteinuria and eGFR are currently used to define patient response in most clinical trials. On the other hand, the interpretation of proteinuria in LN is complicated because proteinuria may represent acute kidney injury due to inflammation and podocyte dysfunction, or chronic kidney injury due to scarring after inflammation. Only acute proteinuria is expected to respond well to immunosuppressive treatment, so biomarkers specifically for acute and chronic proteinuria may be needed to enhance predictive performance in response to treatment. The difficulty seen with developing a robust biomarker for proteinuria reinforces the idea that proteinuria itself is not the best endpoint for evaluating LN response.
No single panel of biomarkers or single type of modeling approach stood out as superior for the prediction of LN response at one-year; however, some themes did emerge. Clinical and demographic variables, especially eGFR, uPCR and race contributed significantly to all biomarker models, and were relatively more important than any novel urine biomarker. Interestingly, complement levels and anti-dsDNA were of less impact. Race, eGFR, and uPCR should be included in future biomarker models. These findings highlight and are consistent with prior observations that black and Hispanic patients may not do as well with standard treatment19. Furthermore, the inclusion of proteinuria and eGFR at flare in multiple models implies that some patients may already have a degree of irreversible, chronic disease at flare. This reinforces the previous notion that early detection and treatment are paramount for good long-term kidney outcomes19. Although the clinical and demographic variables already used to assess LN patients were modest-good predictors of 1-year treatment outcomes, adding novel urine biomarkers did improve most models. Two of the novel biomarkers exhibited characteristics suggesting they should continue development as outcome predictors for LN. Urine CXCL8/IL8 contributed to 5 of the 6 best prediction models for 1-year outcomes. CXCL8/IL8 is a pro-inflammatory chemokine produced by several cell types including dendritic cells, monocytes, endothelial cells, and podocytes20–22. CXCL8/IL8 exacerbates local inflammatory responses and is increased in active LN21. Urine EGF demonstrated the highest odds ratios for each of the six response categories by univariate analysis. Previous studies have shown urine EGF is a marker of tubulointerstitial health in patients with kidney disease, and the status of the tubulointerstitium dictates kidney function23.
This study has several limitations. Active LN at flare was not confirmed by biopsy in all patients. At the time of flare, patients were not necessarily treatment naïve and treatments were not standardized. Blacks and Hispanics were under-represented. Race is both a social construct and a genetic one. In this case, race was socially defined through self-identification. This method of defining race could therefore reflect both biological and social factors that affect outcome. Most importantly, eGFR was only examined at one year. It will be of significant interest to determine whether the eGFR models predict preservation of long-term kidney function. Evaluation of multiple markers and models can lead to inflated performance metrics. In this study, all models were developed using repeated cross-validation with recursive feature selection based on the cross-validation to avoid upwardly biased estimates of model performance. Additionally, models were validated in an independent validation cohort to obtain an unbiased estimate of model performance which also mitigates issues of biased performance measures. Given the relatively small size of the validation cohort, n = 30 participants, validation in a larger cohort would be of interest for future work. Penalized regression approaches, such as lasso or elastic net, offer alternative strategies for simultaneously conducting variable selection and model estimation. However, these regression approaches were not considered in this study as variable selection for the machine learning models was done using backwards selection and the goal was to provide a head to head comparison of regression models fit using the same approach.
In conclusion, while this study did not identify a panel of novel urine biomarkers that can be used to predict one- year treatment outcomes for LN patients, it is clear that adding novel biomarkers to traditional clinical data does improve our ability to understand how patients will do when therapy is started. This work suggests that many of the biomarkers identified heretofore in the literature may not be very useful, but some markers do show up in multiple models. Perhaps these plus future, to be identified biomarkers will offer better predictive panels. It is also clear that in using machine learning for prediction modeling, different techniques should be tested to find the best method to combine biomarkers. The functional relationship between an outcome with a set of predictors is rarely known a priori when designing an investigation and may be more complex than a simple linear relationship (e.g. interactions, exponential or other non-linear relationships). The modeling approach applied here allows for flexibility in modeling more complex relationships between predictors and an outcome while also considering internal validation and model parsimony. Finally, the outcomes being modeled need to be carefully chosen, and should reflect the most important clinical end-points. The traditional outcome measure for LN treatment is effect on proteinuria, but this has proven to be very difficult to model. Ultimately, the goal of LN therapy is to preserve long-term kidney function and not necessarily to completely eliminate proteinuria. While controlling proteinuria often does result in good long-term kidney function, plenty of patients with 12-month post-treatment proteinuria above the arbitrary strict levels commonly used to assess LN do well over the long-term5,6. With this in mind, prediction models of long-term kidney function seem to be the most needed, and coincidently seem to be the most likely to be successfully derived from clinical and novel biomarkers.
Supplementary Material
Supplement 1. Urine biomarker ranking criteria
Supplement 1. Urine biomarker scoring criteria
Supplement 2. Brief description of the training and validation cohorts
Supplement tables: Supplemental 3: Imputation and Model Selection Approach
Supplement FigureS1
Acknowledgements
NIH funding RO1 AR071947- Predictive Biomarkers of Disease Activity and Organ damage in Patients with lupus
NIH funding – JCO R01 AR045476 - Role of reactive intermediates in lupus nephritis
P60 AR062755 - MCRC for Rheumatic Diseases in African Americans
P60 AR053308 - NIAMS Multidisciplinary Clinical Research Center
UL1 RR025005 - Institute for Clinical and Translational Research (UL1)
UL1 TR001450 – South Carolina Clinical & Translational Research Institute (SCTR)
K08 AR002193 - Role of nitric oxide and eicosanoids in lupus nepthritis
VA funding – JCO I01 CX000218 - Urine biomarkers of lupus nephritis pathology and response to therapy
Financial support: This work was supported by the NIH grant RO1 AR071947 to Brad H. Rovin, Betty Tsao and Jim C Oates- Predictive Biomarkers of Disease Activity and Organ damage in Patients with lupus
Footnotes
Publisher's Disclaimer: This is a PDF file of an unedited manuscript that has been accepted for publication. As a service to our customers we are providing this early version of the manuscript. The manuscript will undergo copyediting, typesetting, and review of the resulting proof before it is published in its final form. Please note that during the production process errors may be discovered which could affect the content, and all legal disclaimers that apply to the journal pertain.
Disclosures:
Brad Rovin reports receiving advisory fees from Aurinia Pharmaceuticals, Calliditas
Therapeutics, ChemoCentryx, Retrophin, Novartis, Omeros, MorphoSys, EMD Serono, Bristol Myers Squibb, Janssen Pharmaceutica, AstraZeneca, and GlaxoSmithKline.
The rest of the authors have nothing to disclose
References
- 1.Ayoub I, Nelson J, Rovin BH. Induction Therapy for Lupus Nephritis: the Highlights. Current rheumatology reports 2018;20:60. [DOI] [PubMed] [Google Scholar]
- 2.Tektonidou MG, Dasgupta A, Ward MM. Risk of End-Stage Renal Disease in Patients With Lupus Nephritis, 1971–2015: A Systematic Review and Bayesian Meta-Analysis. Arthritis & rheumatology 2016;68:1432–41. [DOI] [PMC free article] [PubMed] [Google Scholar]
- 3.Mok CC, Kwok RC, Yip PS. Effect of renal disease on the standardized mortality ratio and life expectancy of patients with systemic lupus erythematosus. Arthritis and rheumatism 2013;65:2154–60. [DOI] [PubMed] [Google Scholar]
- 4.Reich HN, Gladman DD, Urowitz MB, et al. Persistent proteinuria and dyslipidemia increase the risk of progressive chronic kidney disease in lupus erythematosus. Kidney international 2011;79:914–20. [DOI] [PubMed] [Google Scholar]
- 5.Dall’Era M, Cisternas MG, Smilek DE, et al. Predictors of long-term renal outcome in lupus nephritis trials: lessons learned from the Euro-Lupus Nephritis cohort. Arthritis & rheumatology 2015;67:1305–13. [DOI] [PubMed] [Google Scholar]
- 6.Tamirou F, Lauwerys BR, Dall’Era M, et al. A proteinuria cut-off level of 0.7 g/day after 12 months of treatment best predicts long-term renal outcome in lupus nephritis: data from the MAINTAIN Nephritis Trial. Lupus science & medicine 2015;2:e000123. [DOI] [PMC free article] [PubMed] [Google Scholar]
- 7.Ayoub I, Cassol C, Almaani S, Rovin B, Parikh SV. The Kidney Biopsy in Systemic Lupus Erythematosus: A View of the Past and a Vision of the Future. Advances in chronic kidney disease 2019;26:360–8. [DOI] [PubMed] [Google Scholar]
- 8.Wolf BJ, Spainhour JC, Arthur JM, Janech MG, Petri M, Oates JC. Development of Biomarker Models to Predict Outcomes in Lupus Nephritis. Arthritis & rheumatology 2016;68:1955–63. [DOI] [PMC free article] [PubMed] [Google Scholar]
- 9.Parikh SV, Malvar A, Song H, et al. Characterising the immune profile of the kidney biopsy at lupus nephritis flare differentiates early treatment responders from non-responders. Lupus science & medicine 2015;2:e000112. [DOI] [PMC free article] [PubMed] [Google Scholar]
- 10.Birmingham DJ, Merchant M, Waikar SS, Nagaraja H, Klein JB, Rovin BH. Biomarkers of lupus nephritis histology and flare: deciphering the relevant amidst the noise. Nephrology, dialysis, transplantation : official publication of the European Dialysis and Transplant Association - European Renal Association 2017;32:i71–i9. [DOI] [PMC free article] [PubMed] [Google Scholar]
- 11.Filzmoser P, Liebmann B, Varmuza K. Repeated double cross validation. J Chemometr 2009;23:160–71. [Google Scholar]
- 12.Shi L, Westerhuis JA, Rosen J, Landberg R, Brunius C. Variable selection and validation in multivariate modelling. Bioinformatics 2019;35:972–80. [DOI] [PMC free article] [PubMed] [Google Scholar]
- 13.Zhong YHJ, Chalise P. Nested and repeated cross validation for classification model with highdimensional data. Revista Colombianan de Estadistica. 2020, 43(1): 103–125. [Google Scholar]
- 14.Liaw A Missing Value Imputations by randomForest, R Documentation, http://www.stat.ucl.ac.be/ISdidactique/Rhelp/library/randomForest/html/rfImpute.html. [Google Scholar]
- 15.USEPA. Guidance for data quality assessment: Practical methods for data analysis. 2000.
- 16.LeDell E, Petersen M, van der Laan M. Computationally efficient confidence intervals for cross-validated area under the ROC curve estimates. Electron J Stat 2015;9:1583–607. [DOI] [PMC free article] [PubMed] [Google Scholar]
- 17.Furie R, Nicholls K, Cheng TT, et al. Efficacy and safety of abatacept in lupus nephritis: a twelve-month, randomized, double-blind study. Arthritis & rheumatology 2014;66:379–89. [DOI] [PubMed] [Google Scholar]
- 18.Rovin BH, Furie R, Latinis K, et al. Efficacy and safety of rituximab in patients with active proliferative lupus nephritis: the Lupus Nephritis Assessment with Rituximab study. Arthritis and rheumatism 2012;64:1215–26. [DOI] [PubMed] [Google Scholar]
- 19.Brad Rovin IA, Arora Swati. The clinical evaluation of kidney disease in systemic lupus erythematosus. Systemic Lupus Erythematosus (Second Edition) Basic, Applied and Clinical Aspects 2020; Chapter 42:379–88. [Google Scholar]
- 20.Wright RD, Beresford MW. Podocytes contribute, and respond, to the inflammatory environment in lupus nephritis. American journal of physiology Renal physiology 2018;315:F1683–F94. [DOI] [PMC free article] [PubMed] [Google Scholar]
- 21.Tsai CY, Wu TH, Yu CL, Lu JY, Tsai YY. Increased excretions of beta2-microglobulin, IL-6, and IL-8 and decreased excretion of Tamm-Horsfall glycoprotein in urine of patients with active lupus nephritis. Nephron 2000;85:207–14. [DOI] [PubMed] [Google Scholar]
- 22.Caster DJ, Korte EA, Tan M, et al. Neutrophil exocytosis induces podocyte cytoskeletal reorganization and proteinuria in experimental glomerulonephritis. American journal of physiology Renal physiology 2018;315:F595–F606. [DOI] [PMC free article] [PubMed] [Google Scholar]
- 23.Mejia-Vilet JM, Shapiro JP, Zhang XL, et al. Association between urinary epidermal growth factor and renal prognosis in lupus nephritis. Arthritis & rheumatology 2020. [DOI] [PubMed] [Google Scholar]
Associated Data
This section collects any data citations, data availability statements, or supplementary materials included in this article.
Supplementary Materials
Supplement 1. Urine biomarker ranking criteria
Supplement 1. Urine biomarker scoring criteria
Supplement 2. Brief description of the training and validation cohorts
Supplement tables: Supplemental 3: Imputation and Model Selection Approach
Supplement FigureS1