

Abstract
Metabolic adaptation and signal integration in response to hypoxic conditions is mainly regulated by hypoxia-inducible factors (HIFs). At the same time, hypoxia induces ROS formation and activates the unfolded protein response (UPR), indicative of endoplasmic reticulum (ER) stress. However, whether ER stress would affect the hypoxia response remains ill-defined. Here we report that feeding mice a high fat diet causes ER stress and attenuates the response to hypoxia. Mechanistically, ER stress promotes HIF-1α and HIF-2α degradation independent of ROS, Ca2+, and the von Hippel-Lindau (VHL) pathway, involving GSK3β and the ubiquitin ligase FBXW1A/βTrCP. Thereby, we reveal a previously unknown function of the GSK3β/HIFα/βTrCP1 axis in ER homeostasis and demonstrate that inhibition of the HIF-1 and HIF-2 response and genetic deficiency of GSK3β affects proliferation, migration, and sensitizes cells for ER stress promoted apoptosis. Vice versa, we show that hypoxia affects the ER stress response mainly through the PERK-arm of the UPR. Overall, we discovered previously unrecognized links between the HIF pathway and the ER stress response and uncovered an essential survival pathway for cells under ER stress.
Keywords: ER stress, HIF-1α, HIF-2α, Mild hypoxia, UPR
Graphical abstract

1. Introduction
Oxygen is a vital metabolic substrate for mammalian tissue and cell functions. Maintaining O2 homeostasis is essential for survival and especially the correct functions of the respiratory, cardiovascular, and hematopoietic systems. Appropriate cellular responses to changes in oxygen tension are mediated by a number of O2-sensitive pathways. Therein, activation of three α-hypoxia-inducible transcription factor subunits (HIFs), of which HIF-1α and HIF-2α are the best understood, is considered as a major event of the hypoxia response. When oxygen is available, HIFs are mainly post-transcriptionally destabilized due to proline hydroxylation and subsequent VHL-mediated ubiquitinylation and proteasomal degradation [1,2]. Low oxygen stabilizes HIFs which are then able to translocate to the nucleus, dimerize with the HIF-β subunits and bind to hypoxia-response elements (HREs) to enhance the expression of more than 300 target genes, which contribute to glycolysis, angiogenesis, erythropoiesis, cell survival, and cancer [[3], [4], [5]].
The proper function of the endoplasmic reticulum provides the basis for correct protein folding and glycosylation, fatty acid synthesis as well as calcium homeostasis [6,7]. Improper or defective protein folding is associated with ER stress and may lead to ER-storage diseases [8] such as familial hypercholesterolemia, osteogenesis imperfecta, diabetes insipidus, or congenital hypothyroid goiter [9,10]. To cope with accumulation of unfolded proteins, cells have evolved the unfolded protein response (UPR). The UPR consists of three distinct ER signaling branches namely the inositol-requiring enzyme-1 (IRE1α), the protein kinase RNA (PKR)-like ER kinase (PERK), and the activating transcription factor-6 (ATF6) pathway [11]. The IRE1α is considered to be the most conserved arm of the UPR [12] and leads to activation of X-box binding protein-1 (XBP-1) mRNA splicing [13], whereas activation of PERK leads to eukaryotic translation initiation factor-2 (eIF2) phosphorylation, causing inhibition of protein translation, and activation of transcription factor-4 (ATF-4) synthesis [14]. Finally, all three branches converge by orchestrating a genetic program that aims to maintain ER homeostasis [6,7].
Metabolic diseases such as obesity and type 2 diabetes as well as cancer display ER stress [15,16]. While ER stress in obesity is the result of high fat containing Western diets, ER stress in cancer cells is caused by high rates of protein synthesis and folding in the ER [17]. Hence, metabolic usage of fat, and protein folding creates a continuous demand of oxygen. This results in periods of ER stress and hypoxia. Consequently, the cells need to adapt to these conditions. Interestingly, it was proposed that hypoxia signaling and the UPR cooperate to boost expression of HIF target genes as severe hypoxia (O2 ≤ 0.02%) was shown to activate the UPR especially via PERK and IRE1 [[18], [19], [20]]. However, it is unknown whether this cooperation would also work in the opposite direction, i.e., whether ER stress would impact the hypoxia response.
Here we reveal that ER stress attenuates the hypoxia response in vivo and in vitro. Mechanistically, we provide evidence that ER stress blocks accumulation of HIF-1α and HIF-2α under hypoxic conditions in a VHL-independent manner. By employing genetic deficiency models for PERK, IRE1α, VHL, GSK3β, FBXW7, and βTrCP we show that the reduction in HIF-1α and HIF-2α by ER stress is mediated via the GSK3β/βTrCP axis. Furthermore, experiments in GSK3β deficient cells show that these cells are more resistant towards ER stress that could be overcome by using HIF-1 and HIF-2 inhibitors. In addition, our data demonstrate that hypoxia reduces the ER stress response by affecting mainly the PERK pathway. Altogether, our data provide unprecedented evidence that the ER undergoes a cross talk with the HIF pathway via the GSK3β/βTrCP axis under physiologically relevant hypoxic conditions.
2. Material and methods
All biochemicals and enzymes were of analytical grade and were obtained from commercial suppliers. Tunicamycin, Thapsigargin, Brefeldin A, and YC-1 were purchased from Enzo Life Science. PT-2385 was purchased from Cayman chemicals. All substances were dissolved in DMSO.
Animal experiments. All the experiments were performed according to protocols approved by the National Animal Experiment Board of Finland. One-month old C57BL/6 N male mice were housed in individual cages at a constant ambient temperature and a 12 h light/dark cycle. Mice were either fed a Western diet containing 15% kJ protein, 43% kJ carbohydrates, 42% kJ fat and 0.21% cholesterol (TD.88 137, ssniff Spezialdiäten GmbH, Soest, Germany) or a control diet with 18% kJ protein, 69% kJ carbohydrates and 13% kJ fat (CD.88 137, ssniff Spezialdiäten GmbH, Soest, Germany), and water ad libitum. After 3 months, mice remained either under room air (21% O2) or were exposed to mild hypoxia (15% O2) and further fed with either Western diet or control diet ad libitum for 3 weeks. Thereafter, mice were sacrificed by cervical dislocation, hematocrit was measured by a standard method, and livers were immediately frozen in liquid nitrogen and stored at −70 °C.
Snap-frozen tissues were homogenized in precooled lysis buffer (3 M urea, 25 mM Tris-HCl (pH 7.5), 75 mM NaCl and 0.25% Nonidet P-40) supplemented with complete EDTA-free tablet and centrifuged. The supernatant protein concentrations were determined by the Bradford method (Bio-Rad Protein Assay, Bio-Rad) and stored at −70 °C until further analysis.
Cell culture. HepG2 and HEK 293 cells were cultured under normoxia (16% O2, 79% N2 and 5% CO2 [by volume]) in minimal essential medium (MEM) supplemented with 10% fetal bovine serum (FBS). Colo320 cells were cultured in RPMI 1640 medium supplemented with 10% FBS. HCT116 cells were cultured in Dulbecco's modified Eagle's medium (DMEM) with 10% FBS. The GSK3β +/+ and GSK3β −/−, FBXW7+/+ and FBXW7−/− as well as pVHL-defective renal cell carcinoma (RCC4) cells and RCC4 cells with reintroduced pVHL (RCC4/VHL) were obtained and cultured as described [21]. The βTrCP inducible MDA-MB 231 knockdown cells were generated as described [22] and cultured in DMEM supplemented with 10% FBS and stimulated with IPTG 72 h prior experiments. Mouse embryonic fibroblasts PERK1+/+ and PERK1−/− were cultured in DMEM with 10% FBS and were a gift from D. Ron [14]. The U87 cells deficient for IRE1α were generated as described [23] and cultured in DMEM supplemented with 10% FBS.
All cell lines were tested Mycoplasma negative by using the MycoAlert Detection Kit (Lonza). In all experiments the number of cell passages used was below 10. For protein extraction, cells were seeded into 6 cm dishes. After a medium change, the cells were treated with tunicamycin (10 μg/ml), further cultured either under normoxia or hypoxia (5% O2, 90% N2 and 5% CO2 [by volume]) as indicated and then harvested. In all experiments control cells were treated with DMSO.
Plasmid constructs. The plasmids pGL3-EPO-HRE-Luc [24], pGL3-hPAI-1-796 [25], and pGL3-ERSE1 [26] have been previously described. The various constructs for full length HIF-1α with mutations in proline 402, proline 564 as well as serine 551, threonine 555, serine 589, threonine 498, serine 502, serine 505, threonine 506 and serine 510 as well as the HIF-2α constructs with mutations in proline 405, serine 475, serine 477, threonine 481, serine 484 and proline 531 were generated using the QuickChange mutagenesis kit (Promega) as described [21].
Western blot analysis and ubiquitylation assay. Western blot analysis was carried out as described previously [27]. In brief, medium or lysates were collected, and 100 μg of protein was loaded onto a 7.5% or 10% sodium dodecyl sulfate (SDS)-polyacrylamide gel. After electrophoresis and electroblotting onto a nitrocellulose membrane, proteins were detected with monoclonal antibodies against human HIF-1α (#610959; 1:1000; BD Bioscience), p53 (1C12) (#2524; 1:1000; Cell signaling), VHL (#556347; 1:1000; BD Bioscience,#), ATF-6α (#sc-166 659; 1:1000; Santa Cruz), GSK3β (3D10) (#9832; 1:1000; Cell signaling), Ubiquitin (P4D1) (#646302; 1:3000; BioLegend), V5 (#R960-25; 1:5000; Invitrogen), β-actin (#A5316; 1:5000; Sigma Aldrich) and against α-tubulin (clone B-5-1-2) (#T5168; 1:10.000; Sigma-Aldrich). Polyclonal antibodies in this study were used against HIF-1α (#NB100-449; 1:1000; Novus Biologicals), HIF-2α (#NB100-122; 1:1000; Novus Biologicals), LC3B (#2775; 1:1000; Cell signaling), pGSK3β (Ser9) (5B3) (#9323; 1:1000; Cell signaling), pGSK3α/β (Tyr279/Tyr216) (#ab4797; 1:1000; Abcam), GRP78 (HPA038845; 1:1000; Sigma-Aldrich), PERK (#sc-13073; 1:500; Santa Cruz), pPERK (#sc-32577; 1:500; Santa Cruz), IRE1α (#sc-20790; 1:500; Santa Cruz), FBXW7 (#A301-720A; 1:1000; Bethyl), c-Myc (N-262) (#sc-764; 1:500; Santa Cruz) and against PAI-1 (#1062; 1:200; American Diagnostica). The secondary antibody was either an anti-mouse (#1706516; 1:5000; Bio-Rad) or an anti-rabbit (#1706515; 1:5000; Bio-Rad) immunoglobulin G conjugated to horseradish peroxidase. The ECL system (GE Healthcare, Germany) was used for detection.
For ubiquitylation assays, HEK 293 cells were transfected together with expression vectors encoding either for V5-tagged full length HIF-1α wild-type (WT), mutant HIF-1α (STSTSSTS), full length HIF-2α wild-type (WT), mutant HIF-2α (SSTS), myc-βTrCP, or ubiquitin. After transfection, cells were treated with proteasome inhibitor MG132 (50 μM; Calbiochem). Four hours later, cells were scraped in lysis buffer (50 mM Tris/HCL, ph 7.5, 150 mM NaCl, 1% Triton X-100, 2 mM EDTA, 2 mM EGTA, 1 mM PMSF and complete protease inhibitor cocktail tablet (Roche). After scraping, lysates were incubated with continuous shaking at 4 °C for 20 min and then they were centrifuged at 12.000 g at 4 °C for 15 min. To recover anti-V5 immunoprecipitates, 150 μg of protein was incubated with 2 μg antibody for 1 h at 4 °C before Sepharose beads (30 μl per reaction mixture) were added for 12 h. Thereafter, the beads were washed five times with lysis buffer and recovered, pellets were dissolved in 2 X Laemmli buffer, loaded onto a 7.5% SDS gel, blotted and detected with an antibody against ubiquitin.
Cell transfection and luciferase assay. 4 × 10⁵ cells per 60 mm dish were transfected as previously described [27,28]. In brief, cells were cotransfected with either 2.5 μg of pGL3-HRE, p5-ATF-6, pGL3-ERSE-1 or pGL3-hPAI-796 and 0.25 μg of a Renilla luciferase construct (pRLSV40, Promega) for normalization. After 24 h cells were exposed to hypoxia and treated with tunicamycin (10 μg/ml) for the indicated time. The detection of luciferase activity was performed with the Dual- Luciferase™ Reporter Gene Assay Kit (Berthold, Pforzheim, Germany).
Live Cell Imaging and bromodeoxyuridine (BrdU) incorporation assays. For real-time quantitative live-cell proliferation analysis, cells were seeded onto 96-well plates (5000 cells/well) in full media. The next day the plate was moved into the IncuCyte® ZOOM System (Essen BioScience) for live phase contrast recording of cells for 24 h in 3 h intervals. For the scratch wound assay, cells were seeded onto 96-well Essen ImageLock Plates (Essen Bioscience) (3 × 10⁴ cells per well) in DMEM with 10% FBS. The following day the confluent cell monolayer was wounded with the 96 PTFE pin Wound Maker (Essen Bioscience), cells were washed with PBS and further cultured in DMEM supplemented with 0.1% FBS. The live wound closure was phase contrast-imaged for 24 h in 3 h intervals. In both assays, the confluence analysis was performed using the basic IncuCyte software settings.
For BrdU incorporation cells were seeded onto 96-well plates at a density of 10 000 cells per well and allowed to settle overnight. After a medium change, cells were treated with tunicamycin (2 μg/ml) and labeled with bromodeoxyuridine (BrdU) for 24 h and the BrdU cell proliferation kit (Calbiochem) was used for detection.
Analysis of cell cycle and cell death. Cell cycle and cell apoptosis were measured in synchronized cells by Annexin-V-FLOUS and propidium iodide (PI) staining kits (Roche/Sigma-Aldrich, Helsinki, Finland) according to the manufacturer ‘s protocol. For synchronization, confluent cells were kept without medium change for 24 h. Release into the cell cycle was achieved by subculture and incubation with fresh serum with or without tunicamycin (10 μg/ml) for indicated time points. Apoptosis and cell cycle parameters were analyzed by flow cytometry (BD FACSAria™ III cell sorter).
Measurement of newly synthesized protein. 4 × 10⁵ cells per 60 mm dishes were treated with cycloheximide (CHX; 50 μM) for 4 h. Thereafter, the CHX containing medium was replaced with fresh medium containing tunicamycin (10 μg/ml) and MG132 (50 μM) to prevent the degradation of newly synthesized protein. After 4 h, cells were harvested, and protein levels were measured by immunoblot analysis.
Measurement of ROS and intracellular Ca2+. Fluorescence measurements were performed in 96-well plates (15.000 cells/well). Measuring ROS was performed by using the non-fluorescent dye dichlorodihydrofluorescein diacetate (H2DCF-DA). Cells were treated with tunicamycin (5 μg/ml) and Mn(III)TBAP (20 μM) for 4 h and then stimulated with H2O2 (500 μM) for additional 30 min. Thereafter, cells were washed with 1 × PBS and 10 μM H2DCF-DA was added for 30 min at 37 °C in dark. Intracellular Ca2+ measurements were performed by using the calcium indicator Fluo-4 (Invitrogen) according to manufacture's protocol. Cells were treated with Tu (5 μg/ml), A23187 (5 μM), Bapta (5 μM) and Bapta-AM (5 μM) for 4 h and then stimulated with Fluo-4 (2 μM) for additional 30 min. Fluorescence in each well was measured with a Tecan fluorescence plate reader at 37 °C with suitable wavelenght for DCF (Ex 495 nm, Em 529 nm) and Fluo-4 (Ex 494 nm, Em 516 nm).
RNA preparation, reverse transcription, XBP1 splicing assay and quantitative real-time PCR. Isolation of total RNA was performed using RNeasy Mini Kit (Qiagen, Hilden, Germany) following the manufacturer's instructions. Total RNA concentration and purity were measured on a NanoDrop spectrophotometer. One μg of total RNA was used for cDNA synthesis using iScript cDNA Synthesis Kit (Bio-Rad, München, Germany).
For XBP1 splicing cDNA was amplified using a pair of primers corresponding to nucleotides 412–431 (5′-CCTTGTAGTTGAGAACCAGG-3′) and 834–853 (5′-GGGGCTTGGTATATATGTGG -3′) of XBP1 [29]. The unspliced X-box binding protein 1 (XBP1u) and the spliced X-box binding protein 1 (XBP1s) mRNAs generate a 442-bp and a 416-bp PCR product, respectively. These fragments were resolved on 2.5% agarose gels to distinguish the PCR products of XBP1u and XBP1s. β-actin (forward 5′- GTTGTCGACGACGAGCG -3′, reverse 5′- GCACAGAGCCTCGCCTT-3′) was used as a loading control.
Quantitative real-time PCR was performed in an Applied Biosystems 7500 Real-Time PCR System (Life Technologies, Helsinki, Finland) by using an Applied Biosystem Power SYBR® green PCR master mix (Life Technologies). The following primer sets were used: human LDHA-F (5′-TTGACCTACGTGGCTTGGAAG-3′), human LDHA-R (5′-GGTAACGGAATCGGGCTGAAT-3′), human GLUT1-F (5′-TCTGGCATCAACGCTGTCTTC-3′), human GLUT1-R (5′-CGATACCGGAGCCAATGGT), human CITED2-F (5′-CATATGGTCTGCCATTTCCA-3′), human CITED2-R (5′-AAGGTCCCCTCTATGTGCTG-3′), human GPR157-F (5′-ACAGTGATGACCAACGGGA-3′), human GPR157-R (5′-CCATTGCGCTCTACTTGTACC-3′), human HIF-1α-F (5′-ATCCATGTGACCATGAGGAAATG-3′), human HIF-1α-R (5′-TCGGCTAGTTAGGGTACACTTC -3′), human PAI-1-F (5′-AGCTCCTTGTACAGATGCCG-3′), human PAI-1-R (5′-ACAACAGGAGGAGAAACCCA-3′), human β-actin-F (5′-GTTGTCGACGACGAGCG-3′) and human-β-actin-R (5′-GCACAGAGCCTCGCCTT-3′). The experiments for each data point were carried out in triplicate. The relative quantification of gene expression was determined using the ΔΔCt method [30].
Statistical Analysis. Densitometry data were plotted as fold induction of relative density units, with the zero-value absorbance in each figure set arbitrarily to 1 or 100%. Statistical comparisons of absorbance differences were performed by the Mann-Whitney test (Statview 4.5, Abacus Concepts, Berkeley, CA), and p values p ≤ 0.05 were considered significant. Luc values presented are means + SEM. Results were compared by ANOVA for repeated Luc measurements followed by the Newman-Keuls test. A probability level p ≤ 0.05 was accepted as significant.
3. Results
3.1. A high-fat diet blocks the hypoxia-dependent increase in hematocrit and GRP78 in mice
A high fat diet is well known to result in ER stress [31,32]. To test whether ER stress caused by a high fat diet has an impact on the hypoxia response, we exposed mice fed with either a high-fat diet or a standard diet for three months to mild hypoxia (15% O2) for a duration of three weeks. To assess the hypoxia and ER stress response we measured the increase in hematocrit and glucose-related protein 78 (GRP78, (also known as BIP and HSP5A)) expression, respectively. As expected, we found that mice fed a standard diet displayed an increased hematocrit upon exposure to hypoxia. However, the high-fat diet mice did not respond with an induction of the hematocrit when exposed to hypoxia (Fig. 1A). Furthermore, the hematocrit response was also reflected on HIF-1α protein levels (Fig. 1B). In line with previous studies [33,34] feeding the high fat diet under normoxia was accompanied by ER stress as exemplified by the increased expression of GRP78 in the liver of mice. Interestingly, simple exposure of standard diet fed mice to hypoxia was also able to increase GRP78 levels. By contrast, this response was blunted upon exposure of the high-fat diet mice to hypoxia (Fig. 1C and D). Together, these data suggest existence of a physiologically relevant mechanistic link between the ER stress and the hypoxia response.
Fig. 1.
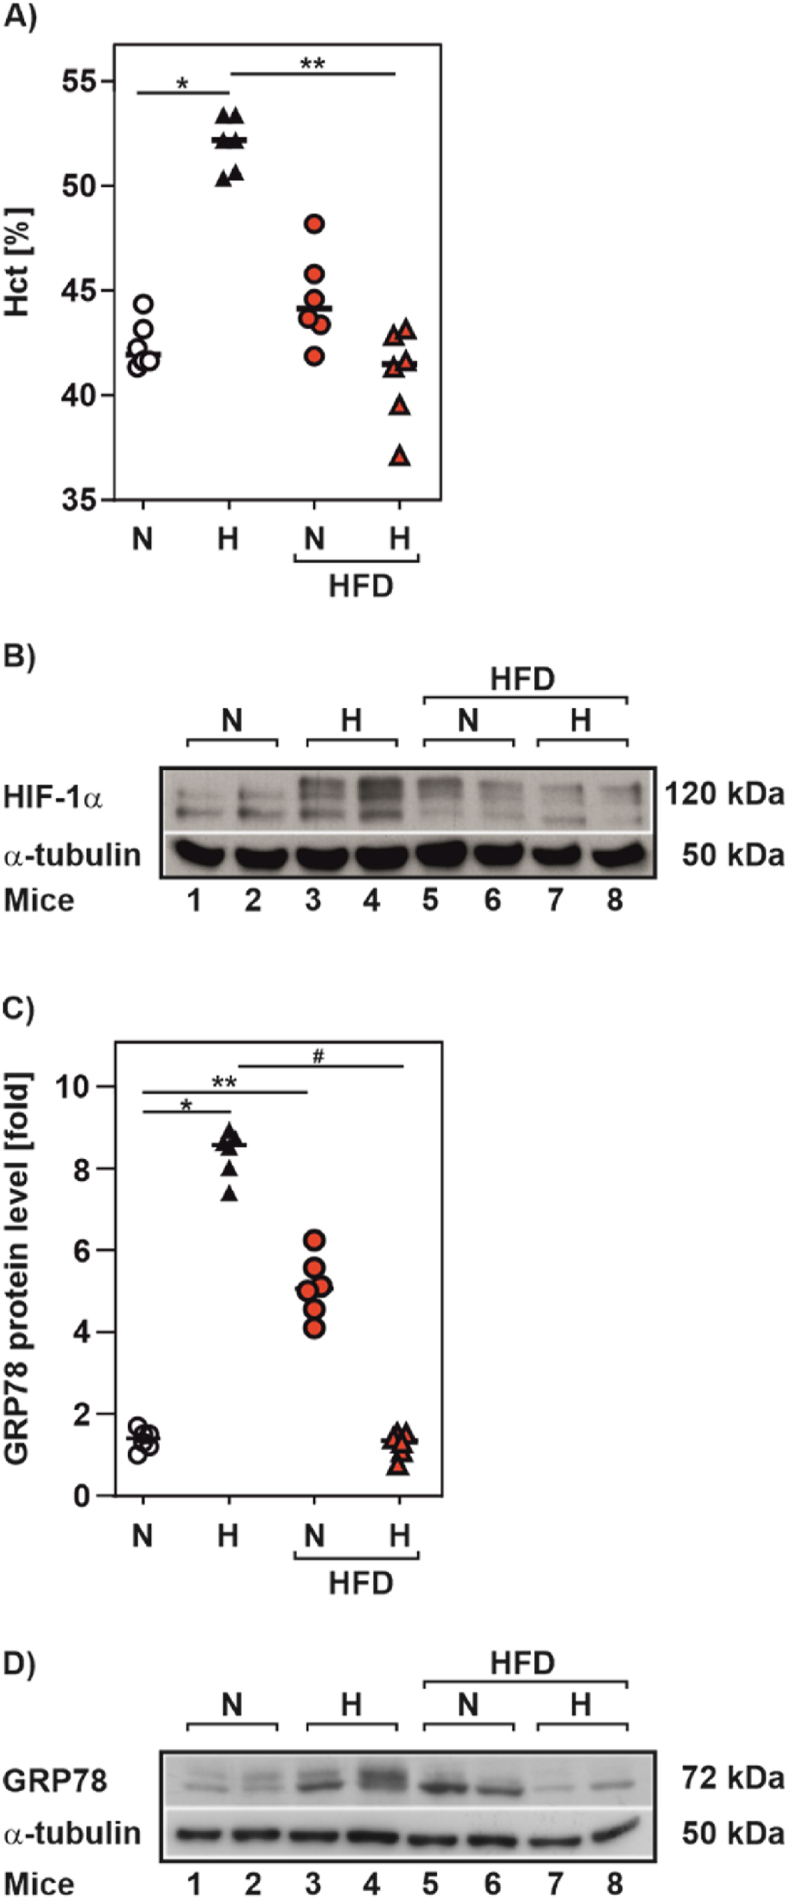
A high fat diet reduced the hypoxia-dependent induction of hematocrit in mice
(A) Hematocrit values from C57BL/6 N male mice that were fed with a high fat diet (HFD; 42% fat) or control diet (13% fat) for 3 months and housed in individual cages for additional 3 weeks under normoxia (N, 21% O2) or mild hypoxia (H, 15% O2); 6 mice per group. (B,D) Representative Western Blots. 100 μg of total liver protein from twomice per group housed as in A were analyzed by Western blot with antibodies against HIF-1α, GRP78 and α-tubulin. (C) GRP78 protein levels measured from the mice housed as in A. *significance 21% O2 vs 15% O2, **significance 21% O2 vs 21% O2 HFD, #significance 15% O2 vs 15% O2 HFD, p ≤ 0.05.
3.2. ER stress inhibits hypoxia-dependent HIFα protein accumulation and HIF target gene expression
Next, we aimed to explore this link in more detail. As the hypoxia-promoted increase in hematocrit is commonly the result of an enhanced erythropoiesis that is primarily HIF-2α driven, we decided to examine whether ER-stress affects the response to hypoxia of both, HIF-1α and HIF-2α at the cellular level. To do this, we first used three substances differently causing ER-stress and investigated HIF-1α in HepG2 cells exposed to hypoxia for 4 h and 24 h. Tunicamycin (Tu) is the most common agent used to study ER stress and blocks N-linked glycosylation, while Brefeldin A (Br.A) inhibits ER-Golgi protein transport, and Thapsigargin (Th) the ER Ca ATPase. We found that treatment of cells with Tu, BrA, and Th for 4 h as well as for 24 h completely abolished the induction of HIF-1α protein levels under hypoxia (Suppl. Fig. S1). We next incorporated two other different cancer cell lines (HCT116, and Colo320) into our analyses to exclude that the effect of ER-stress caused by Tu on HIF-1α protein levels is cell type specific. We found that Tu abolished the hypoxia mediated increase in HIF-1α protein levels irrespective of the cell type. Furthermore, we found that Tu also abolished HIF-2α induction under hypoxia in the three different cell lines (Fig. 2A and B).
Fig. 2.

ER stress inhibits hypoxia-dependent induction of HIF-1α and HIF-2α as well as HIF target gene expression
(A) HepG2, HCT 116 and Colo320 cells were cultured under normoxia (16% O2) for 24 h, then treated with Tu (10 μg/ml) and further cultured either under normoxia or hypoxia (5% O2) for 4 h. HIF-1α or HIF-2α protein levels measured by Western blot under normoxia (16% O2) were set to 1. *significance 16% O2 vs 5% O2; **significance 16% O2 vs 16% O2 + Tu, #significance 5% O2 vs 5% O2 + Tu, p ≤ 0.05, n = 3. (B) Representative Western Blots. 100 μg of total protein were analyzed by Western blot with antibodies against HIF-1α, HIF-2α and α-tubulin. (C) HepG2 cells were cultured under normoxic (16% O2) conditions for 24 h, then treated with Tu (10 μg/ml) and further cultured either under normoxia or hypoxia (5% O2) for 6 h. Relative HIF-1α, LDHA, GLUT1, CITED2, GPR157 and PAI-1 mRNA levels were evaluated by quantitative real-time PCR relative to β-actin mRNA in triplicate samples. *significance 16% O2 vs 5% O2, **significance 16% O2 vs 16% O2 + Tu, #significance 5% O2 vs 5% O2 + Tu, p ≤ 0.05, n = 4. (D) HepG2 cells were treated as in C and PAI-1 protein levels were measured by Western blot analysis. Protein levels under 16% O2 were set to 1. *significance 16% O2 vs 5% O2, **significance 16% O2 vs 16% O2 + Tu, #significance 5% O2 vs 5% O2 + Tu, p ≤ 0.05, n = 3. (E) Representative Western blot.
We next measured whether the ER stress mediated decrease in HIFα levels also affects expression of HIF1/2 target genes. By using quantitative real-time PCR we found that neither hypoxia nor treatment with Tu changed the HIF1A mRNA levels, whereas treatment with Tu abrogated the hypoxia-dependent induction of the HIF-1 target genes LDHA, SLC2A1 (GLUT1), and the HIF-2 targets CITED2, GPR157 and SERPINE1 (PAI-1) (Fig. 2C). Similarly, this response was also visible when studying HIF-1 and HIF-2 transcriptional activity with luciferase gene constructs containing either three hypoxia response elements (HRE) in front of the SV40 promoter or the SERPINE1 (PAI-1) promoter (Suppl. Fig. S2A) as well as when measuring PAI-1 protein levels under normoxia and hypoxia (Fig. 2D and E).
3.3. HIFα downregulation by tunicamycin is UPR independent
Previous studies have shown that severe hypoxia/anoxia and UPR signaling appear to merge at the UPR branches of PERK and IRE1 [[18], [19], [20]] suggesting that tunicamycin caused differences in hypoxic HIFα levels could involve the UPR via PERK and IRE1.
To probe into this, we first examined cells deficient for either PERK or IRE1α and tested whether this would counteract the Tu effects on HIFαs. We found that PERK-deficient cells displayed higher levels of HIF-1α already under normoxic control conditions when compared to their wild-type counterparts. By contrast, HIF-2α levels were about the same in normoxic control and PERK-deficient cells. Exposure of cells to hypoxia induced the two HIFα proteins which was dampened in the presence of Tu, irrespective of whether PERK was present or not (Fig. 3A and B). Likewise, absence of IRE1α did not overcome the effect of Tu on HIFα accumulation under hypoxic conditions (Fig. 3C and D). Together, these data indicate that Tu decreases hypoxic HIFα induction independently of PERK, and IRE1α.
Fig. 3.

HIFα downregulation by tunicamycin is UPR independent
(A, C)PERK+/+, PERK−/-, U87 scrambled (Scr) and U87 IRE1α knock down cells were cultured under normoxic conditions (16% O2) for 24 h, then treated with Tu (10 μg/ml) and further cultured either under normoxia or hypoxia (5% O2) for 4 h. HIF-1α or HIF-2α levels measured under normoxia (16% O2) were set to 1. *significance 16% O2 vs 5% O2, **significance 16% O2 vs 16% O2 + Tu, #significance 5% O2 vs 5% O2 + Tu, p ≤ 0.05, n = 3. (B, D) Representative Western blot of total proteins analyzed with antibodies against HIF-1α, HIF-2α, total PERK, IRE1α and α-tubulin. (E) HepG2 cells were treated with Tu (10 μg/ml) and further cultured for 4 h under normoxic (16% O2) or hypoxic (5% O2) conditions. The GRP78, phospho PERK (pPERK), total PERK (PERK), ATF-6α, IRE1α, and α-tubulin protein levels were measured by Western blot analysis. In each experiment the protein levels under 16% O2 were set to 1. *significance 16% O2 vs 5% O2, **significance 16% O2 vs 16% O2 + Tu, #significance 5% O2 vs 5% O2 + Tu, p ≤ 0.05, n = 3. (F) Representative Western blots of total protein analyzed with antibodies against GRP78, pPERK, PERK, ATF-6α, IRE1α and α-tubulin. (G) HEK 293 cells were cultured under normoxia (16% O2) for 24 h, then treated with Tu (10 μg/ml) and further cultured either under normoxia or hypoxia (5% O2) for 4 h. Total RNA was extracted, and XBP1 mRNA was detected by RT-PCR. XBP1u was observed as a 442-bp band, and XBP1s was observed as a 416-bp band. β-actin served as a loading control.
To further substantiate this, we next measured UPR activation by Tu in cells cultured under normoxia and hypoxia for 4 h. To do this, we measured GRP78, phospho-PERK, total PERK, ATF-6α and IRE1α protein levels by Western blot. In line with previous reports [35,36] we found that Tu induced a strong induction of GRP78 levels; no differences were observed when comparing normoxia and hypoxia (Fig. 3E and F). Further, hypoxia alone and treatment with Tu enhanced phospho-PERK levels; thereby, hypoxia and Tu had rather a slight additive effect. In addition, Tu increased ATF-6α but slightly decreased IRE1α levels; no differences between normoxia and hypoxia were noted (Fig. 3E and F).
In line with the increased ATF-6α levels we found that treatment with Tu upregulated an ER stress responsive luciferase reporter by about 3-fold under normoxia and hypoxia (Suppl. Fig. S2A). Although IRE1α levels were slightly reduced by Tu, we found that this did not affect Tu induced XBP-1 splicing downstream of IREα and that it functioned independent of the oxygen tension (Fig. 3G). In addition, exposure of cells to different hypoxia regiments (either 5% or 3% O2) for varying times had no effect on XBP-1 splicing, while treatment with Tu induced XBP-1 splicing independent of the oxygen tension (Suppl. Fig. S2B). Together, these data are in agreement with the proposal that Tu activates all arms of the UPR response independent of the oxygen tension.
3.4. HIFα downregulation by tunicamycin occurs independent of Ca2+, and reactive oxygen species (ROS)
Earlier findings indicated also a role of Ca2+ and ROS in the UPR [6,37] and in HIF signaling [[38], [39], [40]]. Accordingly, we next tested whether Tu affects Ca2+ and ROS levels and whether they may be involved in the Tu-mediated HIFα decrease.
First, we examined whether Tu has an effect on intracellular Ca2+ levels. In agreement with previous reports [38,39] we found that the calcium ionophore A23187 increased cellular Ca2+ levels. Furthermore, the cell permeable Ca2+ chelator BAPTA-AM, but not the non-permeable BAPTA, decreased cellular Ca2+ levels (Fig. 4A) also in line with previous data [38,39]. However, intracellular Ca2+ levels remained unchanged upon exposure of cells with Tu suggesting that the Tu effect on HIFα proteins is not Ca2+ mediated. Indeed, when testing whether chelation of Ca2+ with BAPTA-AM would restore HIFα levels in the presence of Tu, we found that HIFα protein levels remained reduced in the presence of Tu when compared to BAPTA-AM treatment alone (Fig. 4B, C, D). Together, these data suggest that Ca2+ is involved in HIFα regulation but argue against a major role of Ca2+ in the Tu-mediated HIFα decrease.
Fig. 4.

HIFα downregulation by tunicamycin occurs independent of Ca2+ and ROS
(A) HEK 293 cells were treated with Tu (5 μg/ml), A23187 (5 μM), Bapta (5 μM) and Bapta-AM (5 μM) for 4 h and then stimulated with Fluo-4 (2 μM) for additional 30 min. Fluo-4 fluorescence in each well was measured with a Tecan fluorescence plate reader at 37 °C with exitation wavelenght 494 nm and emission wavelenght 516 nm *significant difference non-treated vs A23187, **significant difference non-treated vs Bapta-AM, ***significant difference non-treated vs Bapta-AM + Tu, p ≤ 0.05. Measurements were done in triplicates and each well was measured 4 × 4, n = 4. (B, C) HEK 293 cells were cultured under normoxia (16% O2) for 24 h, then treated with Tu (10 μg/ml), Bapta (5 μM) and Bapta-AM (5 μM) alone or in combination and further cultured either under normoxia or hypoxia (5% O2) for 4 h. HIF-1α or HIF-2α protein levels measured by Western blot under normoxia (16% O2) were set to 1. *significance 16% O2 vs 16% O2 + Bapta-AM, **significance 5% O2 vs 5% O2 + Bapta-AM, ***significance 16% O2 + Bapta-AM vs 16% O2 + Bapta-AM + Tu, #significance 5% O2 + Bapta-AM vs 5% O2 + Bapta-AM + Tu, p ≤ 0.05, n = 3. (D) Representative Western blot of total proteins analyzed with antibodies against HIF-1α, HIF-2α and α-tubulin. (E) HEK 293 cells were pre-treated with Tu (5 μg/ml) and Mn(III)TBAP (20 μM). After 4 h, cells were treated with H2O2 (500 nM) for 30 min and then stimulated with DCF (10 μM) for additional 30 min. DCF fluorescence in each well was measured with a Tecan fluorescence plate reader at 37 °C with exitation wavelenght 495 nm and emission wavelenght 529 nm *significant difference non-treated vs H2O2, p ≤ 0.05. Measurements were done in triplicates and each well was measured 4 × 4, n = 4. (F, G) HEK 293 cells were cultured under normoxia (16% O2) for 24 h, then treated with Tu (10 μg/ml) and H2O2 (500 nM) alone or in combination and further cultured either under normoxia or hypoxia (5% O2) for 4 h. HIF-1α or HIF-2α protein levels measured by Western blot under normoxia (16% O2) were set to 1. *significance 16% O2 vs 5% O2, **significance 5% O2 non-treated vs 5% O2 treated, ***significance 16% O2 non-treated vs 16% O2 treated, p ≤ 0.05, n = 3. (H) Representative Western blot of total proteins analyzed with antibodies against HIF-1α, HIF-2α and α-tubulin.
Next, we assessed ROS and found that treatment of cells with Tu decreased ROS levels whereas H2O2 increased ROS levels in line with expectations (Fig. 4E). In addition, the well known antioxidant Mn(III)TBAP decreased ROS in a similar manner as Tu. Both, the Tu- and Mn(III)TBAP-mediated ROS decrease was counteracted by the simultaneous addition of H2O2 (Fig. 4E) suggesting that H2O2 may also counteract the Tu effect on HIFα levels.
To examine this, we treated cells with Tu and/or H2O2 and measured HIFα levels under normoxia and hypoxia. As before, treatment with Tu alone abolished the hypoxia mediated increase in HIFα protein levels. According to expectations [41,42], treatment of cells with H2O2 increased HIF-1α levels under normoxia whereas H2O2 did not induce but rather dampened HIF-1α protein induction under hypoxia. On the contrary, HIF-2α protein levels were enhanced upon H2O2 treatment under both normoxia and hypoxia. Interestingly, combined treatment of cells with Tu and H2O2 abolished the induction of both HIFα in response to H2O2 under normoxia and did not antagonize the Tu effect under hypoxia (Fig. 4F, G, H). Together, these data argue against a major role of ROS in mediating the Tu effects on HIFα proteins.
3.5. Tunicamycin downregulates HIFα proteins in a VHL-independent manner
As Tu did not change HIF1A mRNA expression (Fig. 2C) we next examined, whether the reduced HIFα protein levels after Tu treatment is due to changes in protein synthesis and protein half-life. To assess the protein synthesis, we first blocked protein synthesis by treating cells with cycloheximide (CHX) and then restarted protein synthesis by replacing the CHX-containing medium with fresh medium supplemented with Tu and MG132; the latter to prevent degradation of newly synthesized protein. This allows to follow the newly synthesized proteins and to analyze their levels by Western blot. We found that Tu left HIFα protein synthesis unaltered; on the contrary, Tu in the presence of MG132 led to slightly induced HIFα protein levels (Fig. 5A and B). In addition, we performed half-life measurements after blocking de-novo protein synthesis with cycloheximide and found that Tu reduced the half-life of both HIF-1α and HIF-2α (Fig. 5C, D, E) indicating that Tu acts posttranslationally via destabilization of HIFαs.
Fig. 5.

Tunicamycin shortens HIFα half-life but does not affect translation
(A) HEK 293 cells were cultured for 4 h under normoxia (16% O2) or hypoxia (5% O2) in the presence of cycloheximide (CHX; 50 μM). Then, protein synthesis was restarted by a medium change (MC, fresh medium without cycloheximide) but containing MG132 (50 μM) to prevent degradation of newly synthesized proteins. Culture was continued under normoxia (16% O2) or hypoxia (5% O2) in the absence or presence of Tu (10 μg/ml) for 4 h. In each experiment HIF-1α or HIF-2α levels under 16% O2 were set to 1. n = 3. (B, E) Representative Western blot of total protein analyzed with antibodies against HIF-1α, HIF-2α and α-tubulin. (C, D) HEK 293 cells were cultured under hypoxia 5% O2 for 24 h and after inhibition of protein synthesis with cycloheximide (10 μg/ml), the HIF-1α or HIF-2α protein half-life was measured by Western blot analysis. The HIF-1α or HIF-2α protein levels at 0 min were set to 100%. *significant differences non-treated (NT) vs Tu, p ≤ 0.05, n = 3.
As oxygen-dependent HIFα degradation is mainly regulated through hydroxylation of two proline residues, Pro 402 and Pro 564 in HIF-1α, as well as Pro 405 and Pro 531 in HIF-2α, that is followed by binding of the von Hippel-Lindau protein (VHL) [43] we next examined whether this pathway is involved in the Tu-mediated HIFα degradation. Therefore, we used VHL-defective RCC4 cells (-VHL) and RCC4 cells with reintroduced VHL (+VHL). In line with previous reports [44], we found that cells lacking VHL displayed similar high levels of the two HIFα proteins under normoxia and hypoxia. However, treatment with Tu reduced the HIF-1α and HIF-2α levels under both normoxia and hypoxia by about 50% suggesting that the Tu effect is mainly O2 and VHL independent (Fig. 6A and B). Reintroducing VHL into the RCC4 cells reconstituted the hypoxia-dependent induction of the HIFα proteins under control conditions, but as before, treatment with Tu abolished hypoxia-dependent HIFα induction (Fig. 6A and B). Conclusively, the Tu-dependent decrease in HIFα levels is O2 and VHL independent, and other mediators than VHL likely contribute to the decrease of HIFα protein levels in response to Tu.
Fig. 6.

Destabilization of HIF-1α and HIF-2α by tunicamycin is independent of VHL but dependent on GSK3β
(A, C) VHL-defective RCC4 cells (- VHL), the RCC4 cells with reintroduced VHL (+VHL), GSK3β+/+ MEFs and GSK3β−/− MEFs were cultured under normoxia (16% O2) for 24 h, then treated with Tu (10 μg/ml) and further cultured under either normoxia or hypoxia (5% O2) for 4 h. HIF-1α and HIF-2α levels measured under normoxia (16% O2) were set to 1. *significance 16% O2 vs 5% O2; **significance 16% O2 vs 16% O2 + Tu, #significance 5% O2 vs 5% O2 + Tu, p ≤ 0.05, n = 3. (B, D) Representative Western blots of total proteins analyzed with antibodies against HIF-1α, HIF-2α, VHL, GSK3α/β and α-tubulin. (E) HEK 293 cells were transfected with expression vectors for V5-tagged full length HIF-1α mutants HIF-1α P402A/P564A (PP), HIF-1α T498V, S502A, S505A, T506A, S510A, S551A, T555V, S589A (STSTSSTS) or the full length HIF-2α mutants HIF-2α P405A, P531A (PP) and HIF-2α S475R, S477F, T481A, S484R (SSTS). After transfection, cells were treated with Tu (10 μg/ml) and further cultured under normoxia for 4 h. HIFα protein levels measured by Western blot treated with Tu were set to 1. *significance non-treated vs + Tu, p ≤ 0.05, n = 3. Note that the GSK3 site HIF1α STSTSSTS and HIF-2α SSTS mutants do not harbour mutations at the PP hydroxylation sites and are therefore less stabilized than the respective PP mutants. (F) Representative Western blots of total proteins analyzed with antibodies against V5 and α-tubulin.
3.6. GSK3β is involved in the tunicamycin-dependent downregulation of HIFα proteins
Since it was previously shown that GSK3β can promote degradation of HIF-1α independent of VHL [44] we next tested its involvement in the Tu-dependent HIFα degradation by using GSK3β +/+ cells and GSK3β-deficient cells (GSK3β −/−). As expected, hypoxia induced HIFα protein levels when GSK3β +/+ cells were used and treatment with Tu almost completely abolished this induction. Similiarly, hypoxia induced HIFα proteins in GSK3β −/− cells, albeit the cells exhibited already higher HIFα levels under control conditions. However, when GSK3β −/− cells were treated with Tu HIFα levels were no longer reduced; by contrast, Tu even slightly induced HIFα protein levels under both normoxia and hypoxia (Fig. 6C and D). In line, treatment of cells with Tu increased GSK3β activity as indicated by reduced phosphorylation at serine 9 and increased phosphorylation at tyrosin 216 (Suppl. Fig. S3).
To further examine whether the effects of Tu on HIFα stability are GSK3β-dependent, we transfected cells with full length HIF-1α and HIF-2α constructs in which either the proline hydroxylation residues (PP) or the GSK3β phosphorylation sites T498, S502, S505, T506, S510, S551, T555, and S589 (STSTSSTS) in HIF-1α [44,45] or S475, S477, T481, S484 (SSTS) in HIF-2α were substituted with alanine, respectively. When using the proline hydroxylation resistant PP mutants treatment with Tu still reduced HIFα protein levels, whereas Tu did not have an effect on the HIFα constructs when the GSK3 sites were mutated (Fig. 6E and F).
Together, these findings indicate that GSK3β is involved in the tunicamycin-dependent downregulation of HIFα proteins.
3.7. Tunicamycin downregulates HIF-1α in a βTrCP-dependent manner
GSK3 is known to recruit two major ubiquitin E3-ligases to promote proteasomal degradation of the phosphorylated substrate. One is the tumor suppressor FBXW7 and the other is beta-transducin repeat containing protein (βTrCP) also known as FBXW1A [46]. To test whether FBXW7 can act as a ubiquitin ligase that is involved in HIFα degradation in response to Tu, we used FBXW7 wild type (FBXW7+/+) and FBXW7-deficient cells (FBXW7−/−). Under hypoxia the absence of FBXW7 increased HIFα by about 2-fold compared to wild type cells, but loss of FBXW7 did not abrogate the downregulation of HIFα after Tu treatment (Fig. 7A and B). Thus, FBXW7 appeared not to be involved in the degradation of HIFα in response to Tu.
Fig. 7.

Tunicamycin downregulates HIF-1α in a βTrCP-dependent manner
(A)FBXW7+/+and FBXW7−/−, were cultured under normoxia (16% O2) for 24 h, then treated with Tu (10 μg/ml) and further cultured either under normoxia or hypoxia (5% O2) for 4 h. HIF-1α protein levels measured by Western blot under normoxia (16% O2) were set to 1. *significance 16% O2 vs 5% O2, #significance 5% O2 vs 5% O2 + Tu, p ≤ 0.05, n = 3. (C) MDA-MB 231 cells with an inducible βTrCP knockdown were cultured for 24 h under normoxia (16% O2) and treated with IPTG (1 mM) for 72 h prior to treatment with Tu (10 μg/ml). HIF-1α protein levels measured under normoxia (16% O2) were set to 1. *significance 16% O2 vs 5% O2; **significance 16% O2 vs 16% O2 + Tu, #significance 5% O2 vs 5% O2 + Tu, p ≤ 0.05, n = 3. (B, D) Representative Western blots of total protein analyzed with antibodies against HIF-1α, HIF-2α, FBXW7, βTrCP and α-tubulin. (E) HEK 293 cells transfected myc-tagged wild-type βTrCP were cultured either under normoxia or hypoxia (5% O2) for 4 h. HIF-1α protein levels measured by Western blot under normoxia (16% O2) were set to 1. *significance 16% O2 vs 5% O2; #significance 5% O2 vs 5% O2 + Tu, p ≤ 0.05, n = 3. (F) Representative Western blot. 100 μg of total protein were analyzed with antibodies against HIF-1α, myc-Tag and α-tubulin. (G) Ubiquitylation assay. Ubiquitylated proteins are visualized by immunoblot (IB) analysis of anti-V5 immunoprecipitates (IP) and input from MG132 treated HEK 293 cells cotransfected with expression vectors for the V5-tagged full-length wild-type HIF-1α (WT), mutant HIF-1α (STSTSSTS), wild-type HIF-2α (WT), mutant HIF-2α (SSTS), and myc-tagged-βTrCP or ubiquitin.
We next investigated whether βTrCP is involved in HIFα downregulation in response to Tu treatment by using an IPTG-inducible βTrCP knockdown cell line. When we treated those cells with Tu under both normoxia and hypoxia we found that Tu no longer downregulates HIFα levels upon loss of βTrCP, whereas Tu still reduced HIFα levels in the presence of βTrCP (Fig. 7C and D and Suppl. Fig. S4). In line, overexpression of βTrCP reduced HIF-1α protein levels in HEK 293 cells (Fig. 7E and F).
To substantiate the finding that βTrCP is able to promote HIFα ubiquitinylation in concert with GSK3, we performed ubiquitinylation assays. We found that βTrCP increased ubiquitinylation of wildtype HIF-1α and HIF-2α (Fig. 7G) whereas lack of GSK3β phosphorylation sites in HIF-1α (STSTSSTS) as well as HIF-2α (SSTS) did not respond to βTrCP-dependent ubiquitinylation (Fig. 7G). Together, these data suggest that βTrCP is involved in the proteasomal degradation of HIFαs after Tu treatment.
3.8. Tunicamycin affects cell proliferation and migration via the GSK3β-HIF axis
Treatment of cells with Tu is supposed to inhibit proliferation and migration of hepatocellular carcinoma, colon cancer, and microvascular endothelial cells [[47], [48], [49]]. Therefore, we investigated to which extent the GSK3β-HIF axis is involved in cell proliferation, and migration as well as in apoptosis regulation. First, we tested whether Tu affects the cell cycle and found that treatment of GSK3β +/+ cells with Tu keeps more cells in the S-phase, while the number of cells in G2 decreases. In line, when measuring BrdU incorporation into newly synthesized DNA we found that Tu reduces BrdU incorporation in GSK3β +/+ cells (Fig. 8A and B). Interestingly, Tu did neither affect cell cycle distribution nor BrdU incorporation in GSK3β −/− cells, although absence of GSK3β increased the number of cells in the G1 phase and reduced BrdU incorporation when compared to their wild-type counterparts (Fig. 8A and B).
Fig. 8.

Lack of GSK3β affects proliferation and apoptosis upon tunicamycin treatment
(A) Cell cycle distribution of GSK3β+/+ MEFs and GSK3β deficient (GSK3β−/−) MEFs upon Tu (10 μg/ml) treatment for 24 h. G1/0 phase (blue fraction), S phase (red fraction), and G2 phase (green fraction). (B) BrdU incorporation in GSK3β+/+ and GSK3β−/− cells, *significance GSK3β+/+ vs GSK3β+/+ + Tu, **significance GSK3β+/+ vs GSK3β−/−, #significance GSK3β+/+ + Tu vs GSK3β−/− + Tu, p ≤ 0.05, n = 4. (C, E) Histograms of apoptosis in GSK3β+/+ and GSK3β−/− cells was assessed by Annexin-V/PI staining and measured by flow cytometry. (D, F) Quantification of apoptosis in GSK3β+/+ and GSK3β−/−. Live cells (blue fraction), early apoptotic cells (red fraction; EA), and late apoptotic cells (green fraction; LA), *significance GSK3β+/+ vs GSK3β+/+ + Tu, p ≤ 0.05, n = 4. (For interpretation of the references to colour in this figure legend, the reader is referred to the Web version of this article.)
Following apoptosis by flow cytometry in GSK3β +/+ cells showed that treatment with tunicamycin for 24 h increased the number of early apoptotic (EA) and late apoptotic cells (LA) (Fig. 8C and D). Further, we found that hypoxia, but not Tu increased LC-3I and LC-3II levels, suggesting that Tu likely does not affect autophagic flux (Suppl. Fig. S5). On the contrary, there were no significant changes in the number of apoptotic cells upon treatment of GSK3β −/− cells with Tu, although the mere absence of GSK3β appeared to increase apoptosis when comparing these cells with the GSK3β +/+ cells, which is in line with earlier studies [50] (Fig. 8E and F). These data suggest that loss of GSK3β leads to a more resistant phenotype against tunicamycin treatment that may involve HIFα and which should be reflected on cell proliferation and migration. To substantiate this, we performed live-cell analyses (Incucyte®) with GSK3β +/+ and GSK3β −/− cells that were treated with Tu alone or in combination with either the HIF-1α inhibitor YC-1 or the HIF-2α inhibitor PT-2385. As seen before, Tu significantly decreased proliferation in GSK3β +/+ cells, whereas Tu had no significant effect in GSK3β −/− cells (Fig. 9A). However, when GSK3β −/− cells were treated with the HIFα inhibitors YC-1 or PT-2385 alone or in combination with Tu, proliferation significantly decreased in GSK3β −/− cells (Fig. 9A and Suppl. Fig. S6A). Similiarly, when performing a wound healing assay we found that treatment with Tu reduced the migration rate of GSK3β +/+ cells (Fig. 9B and C), whereas Tu treatment had almost no effect on the migration rate of GSK3β −/− cells (Fig. 9D and E). Again, and despite GSK3β −/− cells migrated slower than the wild-type cells, Tu did not affect the wound healing capacity of these cells wheras YC-1 and PT-2385 rendered these cells sensitive to Tu treatments and inhibited migration (Fig. 9D and E and Suppl. Figs. S6B and C). Altogether, these data suggest that the GSK3β-HIFα axis adds to the regulation of the UPR in response to ER stress.
Fig. 9.

Tunicamycin affects proliferation and migration in a HIFα-dependent manner
(A) Real-time proliferation rate of GSK3β+/+ MEFs and GSK3β−/− MEFs upon Tu treatment alone or in combination with HIF-1α inhibitor YC-1, or HIF-2α inhibitor PT-2385, *significance GSK3β+/+ vs GSK3β+/+ + Tu,**signifiance GSK3β−/− vs GSK3β−/− + YC-1 + Tu, #significance GSK3β−/− vs GSK3β−/− + Tu + PT-2385, p ≤ 0.05, n = 4. (B,D) Real-time wound closure of GSK3β+/+ and GSK3β−/− cells upon Tu treatment, *significance non-treated vs treated, p ≤ 0.05, n = 4. (C,E) Representative images of wound closure.
4. Discussion
The current investigation provides novel insights that link ER stress and the hypoxia response. Thereby, we present evidence that ER stress and activation of the UPR under hypoxic conditions attenuate HIF-dependent transcription. At the molecular level we show that activation of GSK3β by UPR agonists is followed by recruitment of the ubiquitin ligase βTrCP to HIFα subunits that results in their subsequent degradation. Consequently, biological processes such as, cell proliferation and migration are affected. Altogether, the current results establish the GSK3β/HIFα/βTrCP axis as being crucial to control physiological processes and cellular homeostasis under conditions of ER stress under normoxia and hypoxia.
Previous evidence indicating that severe hypoxic/anoxic conditions activate the PERK part of the UPR [51] led to the view of a mutual interconnection between the UPR and HIF signaling suggesting that ER stress could boost the hypoxia response [52]. However, the current study could not entirely support this. While we were able to show an activation of PERK when cells were exposed to even relatively mild (5% O2) hypoxia, and also a slight additive effect in PERK activation upon exposure to Tu and hypoxia, HIFα levels were reduced under combined exposure of cells to Tu and hypoxia. This was at the first glance surprising, but when considering that stabilization of HIFs due to inhibition of HIF prolyl hydroxylases occurs already at higher oxygen tensions (∼2% O2) [53] than that required for UPR activation, it appears reasonable that HIFαs would be activated before the UPR would be activated by hypoxia. Hence, UPR activation does not necessarily need to augment HIFα activation. Indeed, the findings of our study are in line with another recent study showing that UPR agonists prevent activation of HIF-induced gene expression [54]. Interestingly, our data show that UPR activation downregulates the hypoxia-dependent accumulation of both HIF-1α and HIF-2α whereas the latter study observed this effect only for HIF-1α. In addition, the experiments of the present study with PERK- and IRE1-deficient cells argue against a role of these two UPR branches in the reduction of HIFα levels by Tu under hypoxia. Furthermore, the experiments with ATF6 responsive ER stress luciferase constructs indicate activation of this UPR branch by Tu as well; however, the data indicating that HIF-1α and HIF-2α mRNA levels are unchanged during Tu and hypoxia treatment support the view that this branch of the UPR is also not responsible for the effects of ER stressors on hypoxic HIFα levels.
As our results do not indicate involvement of the UPR arms, alternative pathways must be activated to reduce HIFα levels in ER stressed hypoxic cells. This could involve ER related ROS production and depletion of the ER Ca2+ store. Indeed, our data show that Tu can decrease ROS levels and increase Ca2+ levels suggesting involvement of ROS and Ca2+ in the Tu response of HIFα. While H2O2 could not restore HIFα levels, BAPTA-AM partially rescued HIFα expression suggesting that Ca2+ may participate in this response. This is in line with our and other groups' previous data indicating a role of Ca2+ for the regulation of HIFα stability [[38], [39], [40]]. Our current data on HIFα half-life add on this and show that stabilization of HIFα proteins is involved in mediating the Tu effects. While oxygen-dependent HIFα degradation operates by proline hydroxylation and recruitment of the VHL containing E3 ubiquitn ligase complex, our data with VHL-deficient cells indicate that the Tu effects are occurring independent of VHL. Aside from prolyl hydroxylation, modification of HIFαs by phosphorylation has been implicated to regulate their stability in an oxygen-independent manner. Thereby, several investigations, including our own, prompted to a prominent role of GSK3β in HIF-1α degradation [21,44,55]. An interesting feature of GSK3 is, that it is commonly active and inhibited by upstream signals. By contrast, we found and confirmed earlier studies [56] showing that ER stress activates GSK3β. However, none of the earlier studies has examined the relationship between GSK3β and ER stress-accelerated HIFα degradation. Our data now extend these studies and indicate that GSK3β promotes ER stress-dependent degradation of HIFαs, and point to the involvement of an E3 ligase complex other than that containing VHL.
Indeed, we identified βTrCP as an E3-ubiquitin ligase to be involved in the Tu- and GSK3β-mediated HIFα degradation as lack of GSK3β and deficiency of βTrCP abrogated the Tu effects on HIFα proteins. However, the role of GSK3β in recruitment of E3 ligases for HIFα degradation appears to be more complex and to involve not only target phosphorylation but also additional, yet unidentified, factors. This is exemplified by comparing current findings and previous reports related to GSK3β′s role on hypoxia and PI3K/AKT-dependent HIF-1α regulation. Although GSK3β is able to phosphorylate T498, S502, S505, T506, S510, S551, T555, and S589 in HIF-1α [44,45], phosphorylation at S551, T555, and S589 by GSK3β were enough to promote HIF-1α degradation by the E3-ubiquitin ligase FBXW7 in relation to hypoxia and PI3K/AKT signaling [21,44]. The current findings with FBXW7-deficient cells and mutant HIF-1α and HIF2α constructs broaden that view and point to a more prominent role of T498, S502, S505, T506 and S510 in HIF-1α as well as S475, S477, T481, and S484 in HIF-2α degradation by βTrCP in response to ER stress. Although such a dual role may be at the first glance surprising, similar aspects have been observed with other short living proteins. For example, MYC is known to be ubiquitylated by the F-box ubiquitin ligases Skp2, FBXW7, FBXO28, FBXL14 and the Hect-domain ubiquitin ligase HectH9 (ARF-BP1, Huwe1) [[57], [58], [59], [60], [61]]. Another example was found with the induced myeloid leukemia cell differentiation protein Mcl-1 that is cooperatively degraded by FBXW7 and βTrCP after being phosphorylated by GSK3 [62]. Together, this suggests existence of factor(s)/component(s) that are yet to be identified but dictate(s) which ubiquitin ligase is recruited to HIFα in response to multiple phosphorylation by GSK3β. In analogy to WNT signaling, the simplest scenario would be a scaffold protein(s) that promotes interaction between GSK3β, HIFα, and the respective E3 ligases.
Our data also reveal a previously unknown function of the GSK3/HIFα/βTrCP axis during ER stress-affected cell proliferation and apoptosis. Thereby, loss of GSK3β abrogated the effects of Tu on cell proliferation and migration in a HIF-dependent manner suggesting that GSK3 inhibitors could promote cell growth and inhibit apoptosis at least partially via HIFs. This links back to the high-fat induced ER stress and suggests that inhibition of GSK3 may be beneficial in obesity, diabetes and/or metabolic syndrome where a deficit in hypoxia mediated angiogenesis is thought to contribute to insulin resistance, inflammation and metabolic disease. On the other hand, activation of the ER stress pathway in malignant solid tumors could be considered as a therapeutic option as this would attenuate or prevent hypoxic adaptation due to accelerated HIFα degradation. While unraveling this was behind the scope of the current study, our results extend our molecular understanding of HIFα degradation and point to a new mechanism of HIFα regulation that is unrelated to oxygen and thus independent of the VHL-E3 ligase complex. Degradation of HIFα by βTrCP becomes an integral part of the complex molecular pathway linking hypoxic responses to ER stress, genetic alterations, and malignant progression. Overall, these findings offer the potential to affect HIFα-dependent processes by targeting GSK3, or βTrCP.
Author contributions
Conception and design, D.M. and T.K.; Acquisition of data (provided animals, provided facilities, etc.), D.M., K.K., G.S.R., D.C.F., K.-H.H., B.B., and T.K.; Analysis and interpretation of data, D.M., K.K., G.S.R., D.C.F., K.-H.H., B.B., and T.K.; Writing of the manuscript, D.M., B.B., and T.K.; Resources, K.-H.H., B.B., and T.K., Study supervision, T.K.
Declaration of competing interest
The authors declare that there is no conflict of interest-
Acknowledgments
This work was supported by the Academy of Finland SA296027, the Jane and Aatos Erkko Foundation 210031, the Finnish Cancer Foundation, the Sigrid Juselius Foundation, the University of Oulu, and Biocenter Oulu as a member of Biocenter Finland.
Footnotes
Supplementary data to this article can be found online at https://doi.org/10.1016/j.redox.2022.102243.
Appendix A. Supplementary data
The following is the Supplementary data to this article:
References
- 1.Kaelin W.G., Jr., Ratcliffe P.J. Oxygen sensing by metazoans: the central role of the HIF hydroxylase pathway. Mol. Cell. 2008;30:393–402. doi: 10.1016/j.molcel.2008.04.009. [DOI] [PubMed] [Google Scholar]
- 2.Majmundar A.J., Wong W.J., Simon M.C. Hypoxia-inducible factors and the response to hypoxic stress. Mol. Cell. 2010;40:294–309. doi: 10.1016/j.molcel.2010.09.022. [DOI] [PMC free article] [PubMed] [Google Scholar]
- 3.Manalo D.J., Rowan A., Lavoie T., et al. Transcriptional regulation of vascular endothelial cell responses to hypoxia by HIF-1. Blood. 2005;105:659–669. doi: 10.1182/blood-2004-07-2958. [DOI] [PubMed] [Google Scholar]
- 4.Prabhakar N.R., Semenza G.L. Oxygen sensing and homeostasis. Physiology. 2015;30:340–348. doi: 10.1152/physiol.00022.2015. [DOI] [PMC free article] [PubMed] [Google Scholar]
- 5.Semenza G.L. Hypoxia-inducible factors: mediators of cancer progression and targets for cancer therapy. Trends Pharmacol. Sci. 2012;33:207–214. doi: 10.1016/j.tips.2012.01.005. [DOI] [PMC free article] [PubMed] [Google Scholar]
- 6.Görlach A., Klappa P., Kietzmann T. The endoplasmic reticulum: folding, calcium homeostasis, signaling, and redox control. Antioxcid. Redox Signal. 2006;8:1391–1418. doi: 10.1089/ars.2006.8.1391. [DOI] [PubMed] [Google Scholar]
- 7.Mennerich D., Kellokumpu S., Kietzmann T. Hypoxia and reactive oxygen species as modulators of endoplasmic reticulum and golgi homeostasis. Antioxcid. Redox Signal. 2019;30:113–137. doi: 10.1089/ars.2018.7523. [DOI] [PubMed] [Google Scholar]
- 8.Rutishauser J., Spiess M. Endoplasmic reticulum storage diseases. Swiss Med. Wkly. 2002;132:211–222. doi: 10.4414/smw.2002.09861. [DOI] [PubMed] [Google Scholar]
- 9.Cao S.S., Kaufman R.J. Endoplasmic reticulum stress and oxidative stress in cell fate decision and human disease. Antioxcid. Redox Signal. 2014;21:396–413. doi: 10.1089/ars.2014.5851. [DOI] [PMC free article] [PubMed] [Google Scholar]
- 10.Luchetti F., Crinelli R., Cesarini E., et al. Endothelial cells, endoplasmic reticulum stress and oxysterols. Redox Biol. 2017;13:581–587. doi: 10.1016/j.redox.2017.07.014. [DOI] [PMC free article] [PubMed] [Google Scholar]
- 11.Ron D., Walter P. Signal integration in the endoplasmic reticulum unfolded protein response. Nat. Rev. Mol. Cell Biol. 2007;8:519–529. doi: 10.1038/nrm2199. [DOI] [PubMed] [Google Scholar]
- 12.Ron D., Hubbard S.R. How IRE1 reacts to ER stress Cell. 2008;132:24–26. doi: 10.1016/j.cell.2007.12.017. [DOI] [PubMed] [Google Scholar]
- 13.Shen X., Ellis R.E., Lee K., et al. Complementary signaling pathways regulate the unfolded protein response and are required for C. elegans development. Cell. 2001;107:893–903. doi: 10.1016/s0092-8674(01)00612-2. [DOI] [PubMed] [Google Scholar]
- 14.Harding H.P., Zhang Y., Bertolotti A., et al. Perk is essential for translational regulation and cell survival during the unfolded protein response. Mol. Cell. 2000;5:897–904. doi: 10.1016/s1097-2765(00)80330-5. [DOI] [PubMed] [Google Scholar]
- 15.Back S.H., Kaufman R.J. Endoplasmic reticulum stress and type 2 diabetes. Annu. Rev. Biochem. 2012;81:767–793. doi: 10.1146/annurev-biochem-072909-095555. [DOI] [PMC free article] [PubMed] [Google Scholar]
- 16.Urra H., Dufey E., Avril T., et al. Endoplasmic reticulum stress and the hallmarks of cancer. Trends Cancer. 2016;2:252–262. doi: 10.1016/j.trecan.2016.03.007. [DOI] [PubMed] [Google Scholar]
- 17.Wang M., Kaufman R.J. The impact of the endoplasmic reticulum protein-folding environment on cancer development. Nat. Rev. Cancer. 2014;14:581–597. doi: 10.1038/nrc3800. [DOI] [PubMed] [Google Scholar]
- 18.Koumenis C., Naczki C., Koritzinsky M., et al. Regulation of protein synthesis by hypoxia via activation of the endoplasmic reticulum kinase PERK and phosphorylation of the translation initiation factor eIF2alpha. Mol. Cell Biol. 2002;22:7405–7416. doi: 10.1128/MCB.22.21.7405-7416.2002. [DOI] [PMC free article] [PubMed] [Google Scholar]
- 19.Koritzinsky M., Magagnin M.G., van den B.T., et al. Gene expression during acute and prolonged hypoxia is regulated by distinct mechanisms of translational control. EMBO J. 2006;25(5):1114–1125. doi: 10.1038/sj.emboj.7600998. [DOI] [PMC free article] [PubMed] [Google Scholar]
- 20.Romero-Ramirez L., Cao H., Nelson D., et al. XBP1 is essential for survival under hypoxic conditions and is required for tumor growth. Cancer Res. 2004;64:5943–5947. doi: 10.1158/0008-5472.CAN-04-1606. [DOI] [PubMed] [Google Scholar]
- 21.Flugel D., Gorlach A., Kietzmann T. GSK-3beta regulates cell growth, migration, and angiogenesis via Fbw7 and USP28-dependent degradation of HIF-1alpha. Blood. 2012;119:1292–1301. doi: 10.1182/blood-2011-08-375014. [DOI] [PMC free article] [PubMed] [Google Scholar]
- 22.Fuhrmann D.C., Wittig I., Dröse S., et al. Degradation of the mitochondrial complex I assembly factor TMEM126B under chronic hypoxia. Cell. Mol. Life Sci. 2018;75:3051–3067. doi: 10.1007/s00018-018-2779-y. [DOI] [PMC free article] [PubMed] [Google Scholar]
- 23.Minchenko O.H., Kharkova A.P., Kubaichuk K.I., et al. Effect of hypoxia on the expression of CCN2, PLAU, PLAUR, SLURP1, PLAT and ITGB1 genes in ERN1 knockdown U87 glioma cells. Ukr.Biochem.J. 2014;86:79–89. [PubMed] [Google Scholar]
- 24.Kietzmann T., Knabe W., Schmidt-Kastner R. Hypoxia and hypoxia-inducible factor modulated gene expression in brain: involvement in neuroprotection and cell death. Eur. Arch. Psychiatr. Clin. Neurosci. 2001;251:170–178. doi: 10.1007/s004060170037. [DOI] [PubMed] [Google Scholar]
- 25.Kietzmann T., Samoylenko A., Roth U., et al. Hypoxia-inducible factor-1 and hypoxia response elements mediate the induction of plasminogen activator inhibitor-1 gene expression by insulin in primary rat hepatocytes. Blood. 2003;101:907–914. doi: 10.1182/blood-2002-06-1693. [DOI] [PubMed] [Google Scholar]
- 26.Yoshida H., Haze K., Yanagi H., et al. Identification of the cis-acting endoplasmic reticulum stress response element responsible for transcriptional induction of mammalian glucose-regulated proteins. Involvement of basic leucine zipper transcription factors. J. Biol. Chem. 1998;273:33741–33749. doi: 10.1074/jbc.273.50.33741. [DOI] [PubMed] [Google Scholar]
- 27.Immenschuh S., Hinke V., Ohlmann A., et al. Transcriptional activation of the haem oxygenase-1 gene by cGMP via a cAMP response element/activator protein-1 element in primary cultures of rat hepatocytes. Biochem. J. 1998;334(Pt 1):141–146. doi: 10.1042/bj3340141. [DOI] [PMC free article] [PubMed] [Google Scholar]
- 28.Roth U., Jungermann K., Kietzmann T. Modulation of glucokinase expression by hypoxia-inducible factor 1 and upstream stimulatory factor 2 in primary rat hepatocytes. Biol. Chem. 2004;385:239–247. doi: 10.1515/BC.2004.018. [DOI] [PubMed] [Google Scholar]
- 29.Yoshida H., Matsui T., Yamamoto A., et al. XBP1 mRNA is induced by ATF6 and spliced by IRE1 in response to ER stress to produce a highly active transcription factor. Cell. 2001;107:881–891. doi: 10.1016/s0092-8674(01)00611-0. [DOI] [PubMed] [Google Scholar]
- 30.Livak K.J., Schmittgen T.D. Analysis of relative gene expression data using real-time quantitative PCR and the 2(-Delta Delta C(T)) Method. Methods. 2001;25:402–408. doi: 10.1006/meth.2001.1262. [DOI] [PubMed] [Google Scholar]
- 31.Deldicque L., Cani P.D., Philp A., et al. The unfolded protein response is activated in skeletal muscle by high-fat feeding: potential role in the downregulation of protein synthesis. Am. J. Physiol. Endocrinol. Metab. 2010;299:E695–E705. doi: 10.1152/ajpendo.00038.2010. [DOI] [PubMed] [Google Scholar]
- 32.Zhang K., Kaufman R.J. From endoplasmic-reticulum stress to the inflammatory response. Nature. 2008;454:455–462. doi: 10.1038/nature07203. [DOI] [PMC free article] [PubMed] [Google Scholar]
- 33.Chen J., Yang Y., Yang Y., et al. Dietary supplementation with Glycine enhances intestinal mucosal integrity and ameliorates inflammation in C57bl/6J mice with high-fat diet-induced obesity. J. Nutr. 2021 doi: 10.1093/jn/nxab058. [DOI] [PubMed] [Google Scholar]
- 34.L. Li, X. Zeng, Z. Liu, et al., Mesenchymal stromal cells protect hepatocytes from lipotoxicity through alleviation of endoplasmic reticulum stress by restoring SERCA activity J. Cell Mol. Med. 25 (2021), 2976-2993. [DOI] [PMC free article] [PubMed]
- 35.Bellezza I., Scarpelli P., Pizzo S.V., et al. ROS-independent Nrf2 activation in prostate cancer. Oncotarget. 2017;8:67506–67518. doi: 10.18632/oncotarget.18724. [DOI] [PMC free article] [PubMed] [Google Scholar]
- 36.Zhao G., Kang J., Xu G., et al. Tunicamycin promotes metastasis through upregulating endoplasmic reticulum stress induced GRP78 expression in thyroid carcinoma. Cell Biosci. 2020;10 doi: 10.1186/s13578-020-00478-0. 115-020-00478-0. eCollection 2020. [DOI] [PMC free article] [PubMed] [Google Scholar]
- 37.Deniaud A., Sharaf El Dein O., Maillier E., et al. Endoplasmic reticulum stress induces calcium-dependent permeability transition, mitochondrial outer membrane permeabilization and apoptosis. Oncogene. 2008;27:285–299. doi: 10.1038/sj.onc.1210638. [DOI] [PubMed] [Google Scholar]
- 38.Liu Q., Moller U., Flugel D., et al. Induction of plasminogen activator inhibitor I gene expression by intracellular calcium via hypoxia-inducible factor-1. Blood. 2004;104:3993–4001. doi: 10.1182/blood-2004-03-1017. [DOI] [PubMed] [Google Scholar]
- 39.Berchner-Pfannschmidt U., Petrat F., Doege K., et al. Chelation of cellular calcium modulates hypoxia-inducible gene expression through activation of hypoxia-inducible factor-1alpha. J. Biol. Chem. 2004;279:44976–44986. doi: 10.1074/jbc.M313995200. [DOI] [PubMed] [Google Scholar]
- 40.Zhou J., Köhl R., Herr B., et al. Calpain mediates a von Hippel-Lindau protein-independent destruction of hypoxia-inducible factor-1alpha. Mol. Biol. Cell. 2006;17:1549–1558. doi: 10.1091/mbc.E05-08-0770. [DOI] [PMC free article] [PubMed] [Google Scholar]
- 41.Diebold I., Flugel D., Becht S., et al. The hypoxia-inducible factor-2alpha is stabilized by oxidative stress involving NOX4 Antioxid. Redox Signal. 2010;13:425–436. doi: 10.1089/ars.2009.3014. [DOI] [PubMed] [Google Scholar]
- 42.Bonello S., Zahringer C., BelAiba R.S., et al. Reactive oxygen species activate the HIF-1alpha promoter via a functional NFkappaB site. Arterioscler. Thromb. Vasc. Biol. 2007;27:755–761. doi: 10.1161/01.ATV.0000258979.92828.bc. [DOI] [PubMed] [Google Scholar]
- 43.Ivan M., Kaelin W.G., Jr. The EGLN-HIF O2-sensing system: multiple inputs and feedbacks. Mol. Cell. 2017;66:772–779. doi: 10.1016/j.molcel.2017.06.002. [DOI] [PMC free article] [PubMed] [Google Scholar]
- 44.Flugel D., Gorlach A., Michiels C., et al. Glycogen synthase kinase 3 phosphorylates hypoxia-inducible factor 1alpha and mediates its destabilization in a VHL-independent manner. Mol. Cell Biol. 2007;27:3253–3265. doi: 10.1128/MCB.00015-07. [DOI] [PMC free article] [PubMed] [Google Scholar]
- 45.Cassavaugh J.M., Hale S.A., Wellman T.L., et al. Negative regulation of HIF-1alpha by an FBW7-mediated degradation pathway during hypoxia. J. Cell. Biochem. 2011;112:3882–3890. doi: 10.1002/jcb.23321. [DOI] [PMC free article] [PubMed] [Google Scholar]
- 46.Fujiwara T., Suzuki M., Tanigami A., et al. The BTRC gene, encoding a human F-box/WD40-repeat protein, maps to chromosome 10q24-q25. Genomics. 1999;58:104–105. doi: 10.1006/geno.1999.5792. [DOI] [PubMed] [Google Scholar]
- 47.Hou H., Ge C., Sun H., et al. Tunicamycin inhibits cell proliferation and migration in hepatocellular carcinoma through suppression of CD44s and the ERK1/2 pathway. Cancer Sci. 2018;109:1088–1100. doi: 10.1111/cas.13518. [DOI] [PMC free article] [PubMed] [Google Scholar]
- 48.You S., Li W., Guan Y. Tunicamycin inhibits colon carcinoma growth and aggressiveness via modulation of the ERK-JNK-mediated AKT/mTOR signaling pathway. Mol. Med. Rep. 2018;17:4203–4212. doi: 10.3892/mmr.2018.8444. [DOI] [PMC free article] [PubMed] [Google Scholar] [Retracted]
- 49.Martínez J.A., Torres-Negrón I., Amigó L.A., et al. Tunicamycin inhibits capillary endothelial cell proliferation by inducing apoptosis. Targeting dolichol-pathway for generation of new anti-angiogenic therapeutics. Adv. Exp. Med. Biol. 2000;476:197–208. [PubMed] [Google Scholar]
- 50.Force T., Woodgett J.R. Unique and overlapping functions of GSK-3 isoforms in cell differentiation and proliferation and cardiovascular development. J. Biol. Chem. 2009;284:9643–9647. doi: 10.1074/jbc.R800077200. [DOI] [PMC free article] [PubMed] [Google Scholar]
- 51.Fels D.R., Koumenis C. The PERK/eIF2alpha/ATF4 module of the UPR in hypoxia resistance and tumor growth. Cancer Biol. Ther. 2006;5:723–728. doi: 10.4161/cbt.5.7.2967. [DOI] [PubMed] [Google Scholar]
- 52.Pereira E.R., Frudd K., Awad W., et al. Endoplasmic reticulum (ER) stress and hypoxia response pathways interact to potentiate hypoxia-inducible factor 1 (HIF-1) transcriptional activity on targets like vascular endothelial growth factor (VEGF) J. Biol. Chem. 2014;289:3352–3364. doi: 10.1074/jbc.M113.507194. [DOI] [PMC free article] [PubMed] [Google Scholar]
- 53.Ehrismann D., Flashman E., Genn D.N., et al. Studies on the activity of the hypoxia-inducible-factor hydroxylases using an oxygen consumption assay. Biochem. J. 2007;401:227–234. doi: 10.1042/BJ20061151. [DOI] [PMC free article] [PubMed] [Google Scholar]
- 54.Ivanova I.G., Park C.V., Yemm A.I., et al. PERK/eIF2alpha signaling inhibits HIF-induced gene expression during the unfolded protein response via YB1-dependent regulation of HIF1alpha translation. Nucleic Acids Res. 2018;46:3878–3890. doi: 10.1093/nar/gky127. [DOI] [PMC free article] [PubMed] [Google Scholar]
- 55.Mottet D., Dumont V., Deccache Y., et al. Regulation of hypoxia-inducible factor-1alpha protein level during hypoxic conditions by the phosphatidylinositol 3-kinase/Akt/glycogen synthase kinase 3beta pathway in HepG2 cells. J. Biol. Chem. 2003;278:31277–31285. doi: 10.1074/jbc.M300763200. [DOI] [PubMed] [Google Scholar]
- 56.Song L., De Sarno P., Jope R.S. Central role of glycogen synthase kinase-3beta in endoplasmic reticulum stress-induced caspase-3 activation. J. Biol. Chem. 2002;277:44701–44708. doi: 10.1074/jbc.M206047200. [DOI] [PubMed] [Google Scholar]
- 57.von der Lehr N., Johansson S., Wu S., et al. The F-box protein Skp2 participates in c-Myc proteosomal degradation and acts as a cofactor for c-Myc-regulated transcription. Mol. Cell. 2003;11:1189–1200. doi: 10.1016/s1097-2765(03)00193-x. [DOI] [PubMed] [Google Scholar]
- 58.Cepeda D., Ng H.F., Sharifi H.R., et al. CDK-mediated activation of the SCF(FBXO) (28) ubiquitin ligase promotes MYC-driven transcription and tumourigenesis and predicts poor survival in breast cancer. EMBO Mol. Med. 2013;5:1067–1086. doi: 10.1002/emmm.201202341. [DOI] [PMC free article] [PubMed] [Google Scholar]
- 59.Fang X., Zhou W., Wu Q., et al. Deubiquitinase USP13 maintains glioblastoma stem cells by antagonizing FBXL14-mediated Myc ubiquitination. J. Exp. Med. 2017;214:245–267. doi: 10.1084/jem.20151673. [DOI] [PMC free article] [PubMed] [Google Scholar]
- 60.Welcker M., Orian A., Jin J., et al. The Fbw7 tumor suppressor regulates glycogen synthase kinase 3 phosphorylation-dependent c-Myc protein degradation. Proc. Natl. Acad. Sci. U.S.A. 2004;101:9085–9090. doi: 10.1073/pnas.0402770101. [DOI] [PMC free article] [PubMed] [Google Scholar]
- 61.Adhikary S., Marinoni F., Hock A., et al. The ubiquitin ligase HectH9 regulates transcriptional activation by Myc and is essential for tumor cell proliferation. Cell. 2005;123:409–421. doi: 10.1016/j.cell.2005.08.016. [DOI] [PubMed] [Google Scholar]
- 62.Ren H., Koo J., Guan B., et al. The E3 ubiquitin ligases beta-TrCP and FBXW7 cooperatively mediates GSK3-dependent Mcl-1 degradation induced by the Akt inhibitor API-1, resulting in apoptosis. Mol. Cancer. 2013;12 doi: 10.1186/1476-4598-12-146. 146-4598-12-146. [DOI] [PMC free article] [PubMed] [Google Scholar]
Associated Data
This section collects any data citations, data availability statements, or supplementary materials included in this article.