

Abstract
Sodium 2-mercaptoethane sulfonate (MESNA) is a thiol-containing compound that has proven to be effective in inactivating acrolein, the toxic metabolite of some anti-cancer drugs (e.g., cyclophosphamide and ifosphamide). Also, it scavenges free radicals which cause numerous disorders by attacking biological molecules. Current methods available to analyze MESNA in biological matrices include colorimetry and high-performance liquid chromatography (HPLC) with ultraviolet, fluorescence, or electrochemical detection. These methods have several limitations including low sensitivity, poor selectivity, a high degree of difficulty, and long analysis times. Hence, a rapid, simple, and sensitive HPLC tandem mass spectrometry (MS/MS) method was developed and validated to quantify MESNA in rat plasma following IP administration. The analysis of MESNA was accomplished via plasma protein precipitation, centrifugation, supernatant evaporation, reconstitution, and HPLC-MS/MS analysis. The method showcases an outstanding limit of detection (20 nM), excellent linearity (R2= 0.999, and percent residual accuracy > 90%) and a wide linear range (0.05–200 μM). The method also produced good accuracy and precision (100±10% and <10% relative standard deviation, respectively). The validated method was successfully used to analyze MESNA from treated animals and will allow easier development of MESNA for therapeutic purposes.
Keywords: antineoplastic, chemoprotectant, free radical, LC-MS/MS, method development
1.0. Introduction
The sodium salt of 2-mercaptoethane sulfonate (MESNA) is a thiol-containing drug used to combat urothelial toxicity in patients treated with antineoplastic drugs (e.g., ifosphamide and cyclophosphamide)[1-5] Specifically, some antineoplastic drugs produce toxic side products (e.g., acrolein). MESNA interacts with these metabolites to reduce their toxicity. Because it is important that a chemoprotective agent does not deactivate the potency of anti-cancer drugs, the inability of both MESNA and diMESNA (i.e., oxidized form of MESNA) to passively cross biological lipid membranes due to their hydrophilicity is advantageous since they do not enter cells to disrupt the mechanism of action of anti-cancer drugs.[3] Other uses of MESNA in the medical field include prevention of cisplatin-induced nephrotoxicity by locally reacting with cisplatin species in the kidneys[6-10] and scavenging reactive oxygen species (ROS) due to the ability of its thiol functional group to act as an antioxidant. [2,11-13]
Due to the importance of MESNA in the medical field, several methods have been developed over the years for its bioanalysis, including colorimetry and high-performance liquid chromatography (HPLC) methods using ultraviolet detection (UV),[14] fluorescence detection (FLD),[4] and electrochemical detection (ECD).[15] However, each of these methods has major limitations. Table 1 lists methods for the analysis of MESNA from biological matrices, along with important analytical characteristics. Ellman in 1959 reported the first analysis of MESNA by non-specific colorimetric assay, however the method was not selective enough to distinguish between MESNA and endogenous thiols in biological samples, such as cysteine.[16] To address this limitation, several HPLC techniques were developed to more selectively analyze MESNA from biological samples.[16-19][14]An HPLC-UV technique using 2-chloro-1-methylquinolinium tetrafluoro-borate for precolumn derivatization was reported by Glowacki et al in 2001.[18-20] The method produced excellent accuracy and precision, but suffered from small linear range. Moreover, the selectivity of the method for practical use was limited, with other thiol containing compounds from the biological sample producing similar retention times as MESNA. Verschraagen et al.[21] developed a micro-HPLC method using dual ECD with walled-jacked electrodes to selectively analyze MESNA. Although the method worked to selectively analyze MESNA, the recoveries were poor, the linear range was small, and the analysis time was lengthy. The method also produced poor sensitivity relative to other bioanalytical techniques for analysis of MESNA.[20,22] Mare et al.[2] reported an HPLC-FLD method for analysis of MESNA from plasma and tissues but it requires long sample preparation steps making it inconvenient to analyze large number of samples.[2,23,24]
Table 1.
Comparison of bioanalytical methods for analysis of MESNA.
| Reference | Year | Analytical method |
Approximate sample preparation and analysis time (min) |
R2 | Precision (%RSD) |
Accuracy (%) |
LOD (nM) |
Linearity (μM) |
|---|---|---|---|---|---|---|---|---|
| Ellman et al[16] | 1959 | Ellman’s free thiol assay | NR | NR | NR | NR | NR | NR |
| Glowacki et al. [18] | 2001 | HPLC-UV | NR | 0.997 | < 3% | 100 ± 3 | 40 | 0.16-30 |
| Verschraagen et al.[4] | 2003 | HPLC-ECD | 45 | 0.999 | < 5% | 100 ± 6 | NR | 3–120 |
| Mare et al.[2] | 2005 | HPLC-FLD | 40 | 0.999 | < 10% | 100 ± 8.7 | 1.6 | 0.0025–2.5 |
| Current technique | 2021 | HPLC-MS/MS | 20 | 0.999 | < 10% | 100 ± 10 | 20 | 0.05–200 |
NR = not reported, HPLC = high performance liquid chromatography, UV = ultraviolet (detection), ECD = electrochemical detection, FLD = fluorescence detection, MS/MS = tandem mass spectrometry
Due to the drawbacks of the currently available bioanalytical methods, a highly robust and sensitive method for the analysis of MESNA in biological samples is needed. Therefore, the objective of the current study was to (develop and validate an HPLC-MS/MS method to analyze MESNA from rat plasma.
Materials and Methods
2.1. Materials
All reagents and solvents were at least HPLC grade, unless otherwise stated. Ammonium formate was purchased from Sigma-Aldrich (St. Louis, MO, USA). Methanol and acetone (LC–MS grade) were obtained from Fisher Scientific (Hanover Park, IL, USA). MESNA (>98% purity) and the internal standard, sodium 3-mercapto-1-propane sulfonate (3-MPS, >90% purity), were purchased from Sigma-Aldrich (St. Louis, MO, USA). Water used for this study was purified by reverse osmosis and filtered through a Lab Pro polishing unit from Labconco (Kansas City, KS, USA). Stock solutions of MESNA and 3-MPS (10 mM) were prepared in water and stored at 4 °C. The stock solutions of MESNA and 3-MPS were freshly diluted to desired working solutions in water or plasma immediately prior to each experiment.
2.2. Biological Samples
Plasma from Wister Hannover rats with 3.2% sodium citrate anticoagulant (0.2 μm filtered), was purchased from BioIVT for the analytical method development and validation. The plasma was stored at −80 °C until used. To evaluate the ability of the method to detect MESNA in the plasma of treated animals, plasma samples were obtained from MESNA-treated male Sprague-Dawley rats. For this experiment, male Sprague-Dawley rats were obtained from Charles River Laboratories and acclimated at the University of Colorado Denver-Anschutz Medical Campus (AAALAC International accredited) for at least 7 days prior to study. All procedures were approved by the UCD-AMC Institutional Animal Care and Use Committee. A pharmaceutical grade formulation of MESNA (Baxter Healthcare Corporation, NDC 10019-953-01) was administered to rats at 300 mg/kg by intraperitoneal (IP) injection. Control animals received an equivalent volume (3 mL/kg) of saline (Hospira) containing 0.25 mg/mL EDTA (Sigma 03690) by IP injection. At various times following treatment (20 min, 1, 3, or 6 hr), rats were anesthetized by IP injection of a mixture of ketamine (75 mg/kg), xylazine (7.5 mg/kg), and acepromazine (1.5 mg/kg) for blood collection. Blood was collected from the abdominal aorta into 3.2% trisodium citrate anticoagulant (1:9 citrate: blood). Plasma was obtained by centrifugation of blood at 2050 x g for 15 minutes at 4 °C and subsequent transfer of plasma to a clean centrifuge tube (2 mL). The plasma was then flash frozen in liquid nitrogen and shipped on dry ice (overnight) to South Dakota State University. Upon receipt, the plasma was stored at −80 °C until analysis was performed.
2.3. Sample preparation for HPLC-MS/MS analysis
To plasma samples (150 μL), internal standard (100 μL of 10 μM 3-MPS) was added and the mixture was vigorously stirred. Acetone (750 μL) was then added to the plasma to precipitate proteins. The sample was vortexed 3-4 times, and then cold centrifuged (−5 °C) at 13,000 rpm (12,300 × g) for 7 min. An aliquot (900 μL) of the supernatant was transferred into a 4-mL glass screw-top vial and dried at room temperature under nitrogen flow. After drying, the contents of the glass vial were reconstituted with 200 μL of HPLC mobile phase A (10 mM ammonium formate in water). The solution was thoroughly mixed, filtered with a 0.22-μm tetrafluoropolyethylene membrane syringe filter, and transferred into a 2-mL HPLC vial with glass insert (200 μL) for analysis.
2.4. HPLC-MS/MS Analysis
HPLC was performed on a Shimazu UFLC with model LC-20ADXR controller. The column used for chromatography was an Agilent polymeric reversed phase column, Zorbax eclipse-XDB C18 (4.6 × 150 mm, 5.0 μm, part #: PN 993967-902). The chromatographic separation was achieved using isocratic elution at a flow rate of 1 mL/min at 60% B (10 mM ammonium formate in methanol, 5:95) held constant for 5 min. The column was equilibrated for 1 min and 10 μL sample volume was injected for HPLC-MS/MS analysis.
For MS analysis, a tandem mass spectrometer (Sciex Q-Trap 5500 MS) equipped with an electrospray ionization interface in the negative polarity mode was used to detect MESNA. Optimization of MS conditions was accomplished by direct infusion of a standard solution of MESNA into the spectrometer at a flow rate of 10 μL/min. Nitrogen (50 psi) was used as the curtain and nebulization gas. The ion spray voltage was 4,500 V, the source temperature was 500 °C, and both the nebulizer (GS1) and heater (GS2) gas pressures were 90 psi. The collision cell was operated with an entrance potential of 10.0 V and an exit potential of 11.0 V at a “medium” collision gas flow rate. Multiple reaction monitoring mode (MRM) was used for MESNA analysis. Table 2 shows the MS/MS MRM operating parameters for the method. Data analysis was completed using the Analyst software program.
Table 2.
MRM transitions, optimized collision energies (CEs), cell exit potentials (CXPs) and declustering potentials (DPs) for the detection of MESNA and 3-MPS by MS/MS analysis.
| Compounds | Q1 (m/z) | Q3 (m/z) | Time (ms) | CE (V) | CXP(V) | DP (V) |
|---|---|---|---|---|---|---|
| MESNA (quantification) | 140.40 | 79.9 | 100 | −25.29 | −9.27 | −24.24 |
| MESNA (identification) | 140.40 | 138.9 | 100 | −21.20 | −9.00 | −16.11 |
| 3-MPS (quantification) | 154.70 | 80.0 | 100 | −43.25 | −14.09 | −89.93 |
| 3-MPS (identification) | 154.70 | 93.9 | 100 | −24.10 | −7.20 | −51.02 |
2.5. Calibration, quantification, and limit of detection
The developed method was validated based on the bioanalytical method development guidelines provided by the Food and Drug Administration (FDA).[3,25,26] The limit of detection (LOD) of MESNA, which is described as the lowest concentration of MESNA that reproducibly produced a signal-to-noise (S/N) of 3, was obtained by analyzing multiple concentrations of MESNA in plasma below the lower limit of quantification (LLOQ) using the developed HPLC-MS/MS method. The noise was calculated as peak-to-peak noise in the blank samples over the retention time of MESNA.
To define the linear range and estimate the accuracy and precision of the method, stock solution of MESNA (10 mM) in water, was diluted in rat plasma to prepare the calibration standards (0.05, 0.1, 0.2, 0.5, 1, 2, 5, 10, 20, 50, 100 and 200 μM) and quality-control (QC) standards (3, 30, and 70 μM). The QC standard concentrations were not included in the calibration range. Each calibration standard was prepared in triplicate and QC standards were prepared in quintuplicate. The calibration curve was plotted using the average peak area signal ratios of MESNA to IS plotted as a function of calibrator concentration. Peak areas of MESNA and IS were obtained by manual integration. To obtain the linearity, accuracy, and precision of the calibration standards, both nonweighted and weighted (1/x and 1/x2) calibration curves were constructed using linear least squares. Since the coefficient of variation (R2) does not accurately quantify goodness-of-fit (GOF) throughout the calibration range,[27] Percent Residual Accuracy (PRA) was used together with the coefficient of determination to determine GOF with PRA values ≥90% indicating an excellent fit.[28,29] A weighted 1/x2 fit was chosen as the best model to fit the calibration data based on R2 and PRA. The LLOQ and upper limit of quantification (ULOQ) were determined using the inclusion criteria of <15% relative standard deviation (%RSD, as a measure of precision) and a percent error (as a measure of accuracy) of 100±15%. The percent error was calculated based on the comparison of the MESNA concentration back calculated from the calibration curve to the nominal MESNA concentration of the QC standard.
To evaluate the intraassay and interassay accuracy and precision of the method, quality control (QC) standards of 3 μM (low QC), 30 μM (medium QC), and 70 μM (high QC) were analyzed over three days (within 5 calendar days). A calibration curve was constructed each day together with the QCs. Intraassay (within same day) precision and accuracy were calculated for each individual day, and interassay precision and accuracy were calculated by comparing the data gathered over three separate days (over 3 days within 5 calendar days).
2.6. Recovery, matrix effect, and selectivity
Assay recovery of MESNA was determined by analyzing low, medium, and high QC standards of MESNA from spiked plasma and aqueous samples. Low, medium, and high QC standards were prepared in quintuplicate for both matrices. Recovery was determined as the percentage of the average analyte peak area from spiked plasma which went through the sample preparation procedure to the average peak area or signal ratio of aqueous QC standards containing MESNA reconstituted in mobile phase. Internal standard was not used to calculate recovery because the purpose of the recovery experiment was to evaluate incomplete recovery of MESNA during sample preparation. Incorporation of the internal standard in the recovery calculation would correct for loss of MESNA. The matrix effect for MESNA analysis was determined by comparing the slopes (m) of calibration curves created in both aqueous and plasma matrices. The value of the slope ratio (plasma slope/aqueous slope) from the calibration curves was used to quantify the matrix effect. A slope ratio (mplasma/maq) equal to one indicates the matrix does not affect the analysis. On the other hand, mplasma/maq greater than one indicates multiplicative enhancement of the analyte in plasma, whereas slope ratio less than one indicates suppression of the analyte signal by plasma matrix. The efficacy of the IS to correct for the matrix effect was evaluated by comparing the ratio of mplasma/maq of non-IS corrected calibration curves with the IS-corrected calibration curves. To evaluate the selectivity of the method, we confirmed the absence of interfering compounds via evaluation of prominent signals above the baseline in blanks over the retention time of MESNA by comparing several blank rat plasma and MESNA-spiked rat plasma samples.
2.7. Stability
The short- and long-term storage stability of MESNA were evaluated by analyzing low (LQC) and high QC (HQC) MESNA-spiked plasma samples stored at different temperatures and multiple storage times. The stability of MESNA was determined as a ratio of MESNA signal at time(t) to the signal at time “zero”, expressed as a percentage. MESNA was considered stable in plasma at a specific storage condition if the signal was within 10% of the initial signal. For short-term stability of MESNA, both low and high QCs were assessed over 24-hr, both in the autosampler (at 15 and 5°C) and on the benchtop (at room temperature). The autosampler stability was assessed twice on different days by placing triplicates of low and high QCs on the autosampler of the HPLC at 15 and 5°C and analyzing them at approximately 0, 1.5, 2, 4, 8, 12, and 24 hr following preparation. Benchtop stability was evaluated by placing low and high QC plasma samples on the benchtop (room temperature) for 0, 1, 2, 4, 8, 12, and 24 hr and analyzing them after each time point utilizing the procedure above (Section 2.3). The IS was added after storage and prior to sample preparation to correct for the day-to-day instrument signal variation. For freeze-thaw (FT) stability, four sets of LQCs and HQCs were prepared in triplicates without IS. One set of both QCs was analyzed in triplicate immediately, while the other sets were stored at −80 °C. For each cycle, all QC standards were thawed unassisted at room temperature. One set of the thawed QCs was analyzed in triplicate after adding IS to evaluate the first cycle FT stability and the remaining two sets of QCs were again stored at −80 °C. This procedure was repeated twice more to evaluate the remaining two freeze-thaw cycles. A total of three freeze-thaw cycles were evaluated. For the long-term stability studies, QC standards were stored at various storage conditions (−80, −20, 4 °C and room temperature) and analyzed over 30 days (at 0, 1, 5 10, 15, and 30 days). IS was added to each storage stability standard after storage to correct for day-to-day variation in instrument sensitivity.
3. Results and Discussion
3.1. HPLC-MS/MS Analysis of MESNA
The HPLC-MS/MS method developed for analysis of MESNA from rat plasma features quick and simple sample preparation and analysis. The sample preparation is comprised of 4 simple steps: 1) protein precipitation, 2) centrifugation, 3) transfer and drying of the supernatant, and 4) reconstitution in aqueous mobile phase for HPLC-MS/MS analysis. This quick plasma sample preparation is vital to minimize the potential for conversion of MESNA to diMESNA. The simple sample preparation procedure also allows for analysis of about 90 samples within 24-hr period compared to some existing methods. For example, Mare et al.[2] reports an HPLC-FLD method for MESNA utilizing derivatization with Thioglo (TM) 3 solution but requires a 33 min sample preparation procedure and 7 min analysis time. Verschraagen et al.[21] also reports an HPLC-ECD method with sample preparation time of 35 min and chromatographic run time of 12.5 mins.[21] Conversely, our method utilizes a shorter sample preparation and analysis time of 15 and 5 min, respectively. The mass spectra of MESNA and 3-MPS produced by ESI (−)-MS with the most abundant ions identified are shown in Fig. 1A and B, respectively. The m/z ratios of 140.40 and 154.70 correspond to the molecular ions ([M–H]−) of MESNA and 3-MPS, respectively. The ([M–2H]) of MESNA and 3-MPS also correspond to 138.9 m/z and 153 m/z respectively. For MESNA, the 140.40→79.9 and 140.40→138.9 transitions were selected as the quantification and identification transitions, respectively. For the internal standard, 3-MPS, the 154.70→80.0 and 154.70→138.9 transitions were selected as the quantification and identification transitions, respectively.
Figure 1.
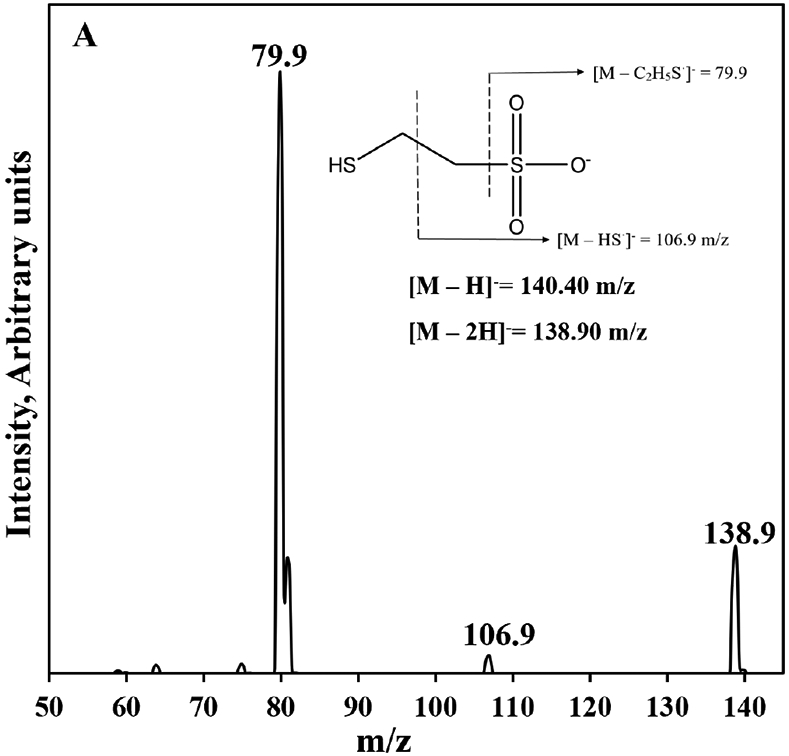
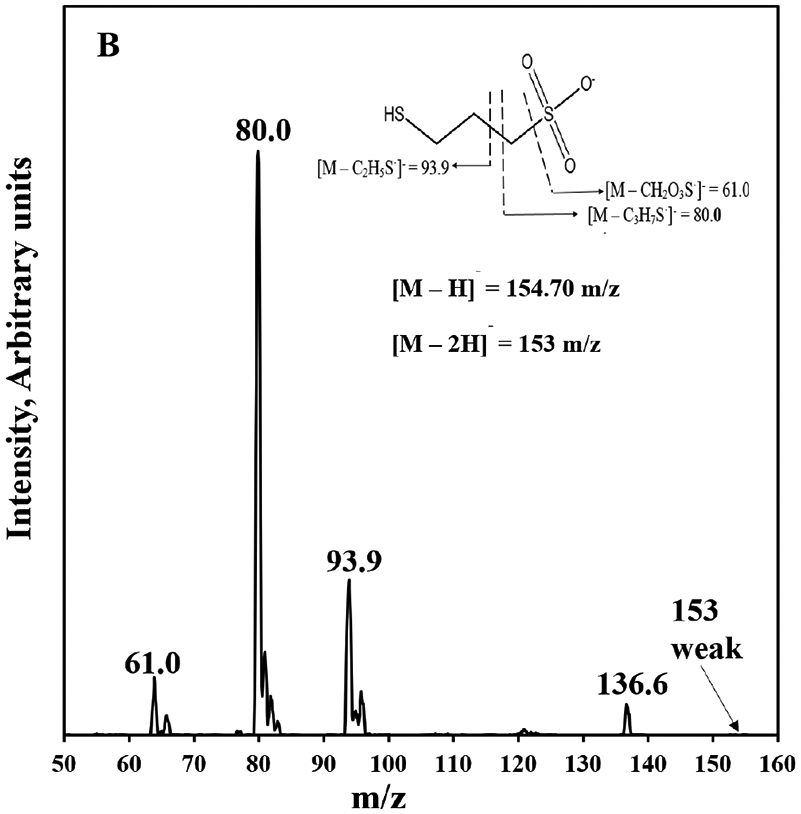
ESI (−) product ion mass spectra of MESNA (a) and 3-MPS (b) with identification of the abundant ions. Molecular ions of MESNA and 3-MPS [M–H]− correspond to 140.40 and 154.70 m/z, respectively. The ([M–2H]−) of MESNA and 3-MPS also correspond to 138.9 m/z and 153 m/z, respectively. Insets, structures of MESNA (a) and 3-MPS (b) with abundant fragments indicated.
HPLC-MS/MS chromatograms of MESNA and its internal standard, 3-MPS, prepared from spiked plasma are shown in Figures 2A and B, respectively. Both peaks eluted at approximately 1.3 min. Our method produced excellent selectivity for both MESNA and 3-MPS with no other prominent peaks present in the chromatograms. The selectivity of the method addresses a disadvantage of multiple methods listed in table.
Figure 2.


Representative HPLC-MS/MS chromatograms of spiked (5 μM) and non-spiked (a) MESNA and (b) 3-MPS (IS) in rat plasma. The chromatograms show signal response to the MRM transitions of MESNA (140.40 → 79.9 and 140.40 → 138.9 m/z) and 3-MPS (154.70 → 80.0 and 154.70 → 93.9 m/z).
3.2. Linear range, calibration, and limit of detection
The linearity of the method was determined by constructing calibration curves over the initial concentration range of 0.05–200 μM. Based on the linear range inclusion criteria for accuracy and precision, the 0.05, 0.1 and 0.2 μM calibrators were excluded. Thus, the linear range of the method was 0.5 μM (LLOQ) to 200 μM (ULOQ) as best defined by 1/x2 weighted linear regression. All the calibrators within the linear range had individual PRAs >90% indicating an excellent GOF of the calibration equation for each calibrator. This linear range spanned over three orders of magnitude, which is outstanding for bioanalytical methods.[30,31] This wide linear range is very beneficial when it comes to pharmacological studies where analysis of wide range of MESNA concentrations may be necessary. Additionally, the method showed an excellent LOD of 20 nM.
Calibration curves were constructed over a period of 3 days to determine the consistency of the calibration. As shown in Table 3, the R2 and PRAs were consistent and excellent. PRAs were >90% and R2 were >0.999 over the period of 3 days but the calibration equation varied significantly. Therefore, the calibration curve should be prepared on the day of analysis.
Table 3.
Linear equations, coefficients of determination (R2), and percent residual accuracy (PRA) for calibration curves created over 3 days.
| Day | Equation | R2 | PRA (%) |
|---|---|---|---|
| 1 | y = 10.0428x -1.345 | 0.9932 | 96 |
| 2 | y = 5.8609x - 0.970 | 0.9943 | 93 |
| 3 | y = 9.9436x - 0.511 | 0.9998 | 97 |
3.3. Accuracy and precision
The accuracy and precision of the method were estimated by quintuplicate analysis of low, medium and high QCs on three different days within 5 calendar days (Table 4). The accuracy and precision of the method were excellent for all the 3 days tested. The intraassay and interassay accuracies were both 100±10% of the nominal QC concentrations. The accuracy and precision of the method were remarkable, with all QCs producing %RSDs <10% and accuracies of 100 ± 10% while within the FDA-acceptable range for method validation from a biological matrix.[32-34]
Table 4.
The intra- and interassay accuracies and precisions of MESNA analysis from spiked rat plasma by HPLC-MS/MS.
| Conc (μM) |
Intraassay |
Interassay |
||||||
|---|---|---|---|---|---|---|---|---|
| Accuracy (%) |
Precision (%RSD) |
Accuracy (%)a |
Precision (%RSD)a |
|||||
| Day 1 | Day 2 | Day 3 | Day 1 | Day 2 | Day 3 | |||
| 3 | 100±0.4 | 100±2.0 | 100±7.0 | 8.7 | 4.6 | 8.8 | 100±7.0 | <8.8 |
| 30 | 100±5.9 | 100±5.9 | 100±3.2 | 9.0 | 8.6 | 4.2 | 100±5.9 | <9.0 |
| 70 | 100±1.9 | 100±9.6 | 100±0.3 | 7.8 | 4.0 | 6.5 | 100±9.6 | <7.8 |
Aggregate of three days of QC method validation (N = 15)
3.4. Matrix effect, recovery, and stability
The evaluation of matrix effects reveals the direct or indirect alteration of response owing to the presence of interfering substances in the plasma matrix. To determine the effect of the plasma matrix on the analysis of MESNA, calibration curves were constructed in both plasma and aqueous samples. The slopes of standard curves of MESNA spiked in aqueous solutions and plasma (mplasma/maq) were compared to obtain the matrix effect value of 0.96, showing only a minor matrix effect for the analysis of MESNA in plasma. The recoveries for low, medium, and high QCs of MESNA in rat plasma were 90%, 91%, and 99% respectively. Addition of internal standard corrected for incomplete recoveries for low, medium, and high QCs to produce 97%, 95%, and 100% signal accuracy, respectively. Since the percent recovery determined in this manner is a combination of matrix effect and recovery, the minor matrix effect in rat plasma does slightly contribute to recoveries less than 100%.
For the benchtop stability, MESNA was stable in rat plasma for the 24-hr period tested. Conversely, MESNA was unstable in prepared samples after 2 hr in the autosampler at 15 °C. Moreover, while samples were stored on the autosampler at 15 °C, both MESNA and the IS signals were inconsistent, leading to the IS not correcting for the loss of MESNA. In an attempt to stabilize the MESNA and 3-MPS in the autosampler, the autosampler was cooled to 5 °C. At this temperature, the stability of MESNA was greatly improved with MESNA producing stable signals for at least 24 hr. Because the IS is added to samples prior to storage on the autosampler, the loss of MESNA signals in the autosampler at 15 °C may be due to the instability of the IS at higher temperatures or reaction of the IS with MESNA at 15 °C. For freeze-thaw stability, MESNA stability was excellent in plasma (−80 °C) over the three freeze-thaw cycles evaluated with not more than 10% deviation from the control. The long-term stability of MESNA was evaluated at multiple storage temperatures. For MESNA samples stored at room temperature and 4 °C, stability was within 10% of the initial signals for 5 days and 2 weeks, respectively, and MESNA signals for both high and low QCs decreased rapidly after 15 days of storage for both storage conditions. Conversely, MESNA showed excellent stability (i.e., not more than 10% deviation from the control) in plasma when the sample was frozen (i.e., at both −20 °C and −80 °C) for at least 30 days (longest time period tested). This is consistent with the results obtained by Verschraagen et al.[35] who showed that MESNA stored at −20°C in deproteinized plasma was stable for at least 35 days. Overall, based on the results of the stability studies, we recommend that when storage is necessary, plasma samples should be stored at either −20 °C or −80 °C and can be thawed and refrozen at least three times for analysis. If samples are to be analyzed within 15 days, they can be stored at 4 °C. Once samples are prepared for the autosampler, they should be kept at 5 °C until analyzed.
3.5. Analysis of MESNA in Treated Animals
The developed method was used to analyze plasma from MESNA-treated rats. Chromatograms from HPLC-MS/MS analysis of the plasma of rats treated with MESNA and rat plasma obtained prior to treatment are shown in Figure 3. In the plasma of treated rats, MESNA was detected as a major peak eluting at 1.30 min. This result shows the applicability of the method for analysis of MESNA-treated animals, and consequently verified the selectivity and usefulness of the method for analysis of MESNA from rat plasma.
Figure 3.


HPLC-MS/MS chromatogram from the plasma of MESNA-treated rats and rat plasma obtained prior to MESNA treatment. The chromatograms represent signal response to MRM quantification transition of (a) MESNA (140.40 → 79.9 m/z) and (b) 3-MPS (154.70 → 80.0).
4.0. Conclusion
A simple and sensitive HPLC-MS/MS method for the determination of MESNA in plasma was developed. The method presented was accurate and precise and showed the ability to analyze MESNA from plasma of treated animals. This technique will allow for simple and rapid analysis of MESNA for further development of this important therapeutic.
Highlights.
MESNA is a drug used to combat the toxic effects of the anti-cancer agents: cyclophosphamide and ifosfamide.
A simple and effective method of analysis for MESNA in plasma via HPLC-MS/MS was developed and validated.
The method has a limit of detection of 20 nM and showcases wide linear range (0.05–200 μM).
The method was used to detect MESNA from the plasma of MESNA-treated rats.
Acknowledgements
We gratefully acknowledge support from the CounterACT Program, National Institutes of Health Office of the Director, and the National Institute of Environmental Health Sciences (NIEHS), Grant number U54 ES027698 (CWW). The opinions or assertions contained herein are the private views of the authors and are not to be construed as official or as reflecting the views of the National Institutes of Health or the CounterACT Program.
Footnotes
Declaration of interests
The authors declare that they have no known competing financial interests or personal relationships that could have appeared to influence the work reported in this paper.
Publisher's Disclaimer: This is a PDF file of an unedited manuscript that has been accepted for publication. As a service to our customers we are providing this early version of the manuscript. The manuscript will undergo copyediting, typesetting, and review of the resulting proof before it is published in its final form. Please note that during the production process errors may be discovered which could affect the content, and all legal disclaimers that apply to the journal pertain.
Reference
- [1].Dechant KL, Brogden RN, Pilkington T, Faulds D, Ifosfamide/mesna, Drugs. 42 (1991) 428–467. [DOI] [PubMed] [Google Scholar]
- [2].Mare S, Penugonda S, Ercal N, High performance liquid chromatography analysis of MESNA (2-mercaptoethane sulfonate) in biological samples using fluorescence detection, Biomed Chromatogr. 19 (2005) 80–86. 10.1002/bmc.420. [DOI] [PubMed] [Google Scholar]
- [3].Shaw IC, Graham MI, Mesna—a short review, Cancer Treatment Reviews. 14 (1987) 67–86. [DOI] [PubMed] [Google Scholar]
- [4].Verschraagen M, Bosma M, Zwiers THU, Torun E, van der Vijgh WJF, Quantification of mesna and total mesna in kidney tissue by high-performance liquid chromatography with electrochemical detection, Journal of Chromatography B. 783 (2003) 33–42. [DOI] [PubMed] [Google Scholar]
- [5].Laauser C, Habekost G, Habekost A, Mass Spectrometric Detection and Reductive Degradation of the Anti-cancer Drugs Ifosfamide and Cyclophosphamide, Applied Ecology and Environmental Sciences. 6 (2018) 15–22. 10.12691/aees-6-1-3. [DOI] [Google Scholar]
- [6].Verschraagen M, Boven E, Zegers I, Hausheer FH, van der Vijgh WJ, Pharmacokinetics of BNP7787 and its metabolite mesna in plasma and ascites: a case report, Cancer Chemother Pharmacol. 51 (2003) 525–529. 10.1007/s00280-003-0578-z. [DOI] [PubMed] [Google Scholar]
- [7].Bokemeyer C, Schmoll HJ, Ludwig E, Harstrick A, Dunn T, Casper J, The anti-tumour activity of ifosfamide on heterotransplanted testicular cancer cell lines remains unaltered by the uroprotector mesna, British Journal of Cancer. 69 (1994) 863–867. [DOI] [PMC free article] [PubMed] [Google Scholar]
- [8].Ahmed NR, An indirect spectrophotometric determination of mesna in pharmaceuticals and environmental samples, Iraqi National Journal of Chemistry. 44 (2011) 492–500. [Google Scholar]
- [9].Takamoto S, Sakura N, Yashiki M, Kojima T, Inactivation of acrolein by sodium 2-mercaptoethanesulfonate using headspace-solid-phase microextraction gas chromatography and mass spectrometry, Journal of Chromatography B. 791 (2003) 365–369. 10.1016/s1570-0232(03)00259-9. [DOI] [PubMed] [Google Scholar]
- [10].Haggag RS, Gawad DA, Belal SF, Elbardisy HM, Spectrophotometric and spectrofluorimetric determination of mesna, acetylcysteine and timonacic acid through the reaction with acetoxymercuri fluorescein, Analytical Methods. 8 (2016) 2479–2493. 10.1039/c5ay02279g. [DOI] [Google Scholar]
- [11].Shusterman T, Sela S, Cohen H, Kristal B, Sbeit W, Reshef R, Effect of the antioxidant Mesna (2-mercaptoethane sulfonate) on experimental colitis, Digestive Diseases and Sciences. 48 (2003) 1177–1185. [DOI] [PubMed] [Google Scholar]
- [12].Burkert H, Clinical overview of mesna, Cancer Treatment Reviews. 10 (1983) 175–181. [DOI] [PubMed] [Google Scholar]
- [13].Şener G, Sehirli Ö, Cetinel Ş, Yeğen BG, Gedik N, Ayanoğlu-Dülger G, Protective effects of MESNA (2-mercaptoethane sulphonate) against acetaminophen-induced hepatorenal oxidative damage in mice, Journal of Applied Toxicology: An International Journal. 25 (2005) 20–29. [DOI] [PubMed] [Google Scholar]
- [14].El-Yazigi A, Ernst P, Al-Rawithi S, Legayada E, Raines DA, Pharmacokinetics of mesna and dimesna after simultaneous intravenous bolus and infusion administration in patients undergoing bone marrow transplantation, The Journal of Clinical Pharmacology. 37 (1997) 618–624. [DOI] [PubMed] [Google Scholar]
- [15].Mare S, Penugonda S, Ercal N, High performance liquid chromatography analysis of MESNA (2-mercaptoethane sulfonate) in biological samples using fluorescence detection, Biomedical Chromatography. 19 (2005) 80–86. [DOI] [PubMed] [Google Scholar]
- [16].Ellman GL, Tissue sulfhydryl groups, Archives of Biochemistry and Biophysics. 82 (1959) 70–77. [DOI] [PubMed] [Google Scholar]
- [17].El-Yazigi A, Yusuf A, Al-Rawithi S, Liquid chromatographic analysis of mesna and dimesna in plasma and urine of patients treated with mesna, Therapeutic Drug Monitoring. 17 (1995) 153–158. [DOI] [PubMed] [Google Scholar]
- [18].Głowacki R, Wójcik K, Bald E, Facile and sensitive method for the determination of mesna in plasma by high-performance liquid chromatography with ultraviolet detection, Journal of Chromatography A. 914 (2001) 29–35. [DOI] [PubMed] [Google Scholar]
- [19].Kuśmierek K, Chwatko G, Głowacki R, Kubalczyk P, Bald E, Ultraviolet derivatization of low-molecular-mass thiols for high performance liquid chromatography and capillary electrophoresis analysis, Journal of Chromatography B. 879 (2011) 1290–1307. [DOI] [PubMed] [Google Scholar]
- [20].Kuśmierek K, Chwatko G, Głowacki R, Bald E, Determination of endogenous thiols and thiol drugs in urine by HPLC with ultraviolet detection, Journal of Chromatography B. 877 (2009) 3300–3308. [DOI] [PubMed] [Google Scholar]
- [21].Verschraagen M, Zwiers THU, Torun E, Donker MG, Reinhoud NJ, van der Vijgh WJF, Simultaneous determination of BNP7787 and its metabolite mesna in plasma and tissue by micro-HPLC with a dual electrochemical detector, Journal of Pharmaceutical Sciences. 92 (2003) 1040–1050. [DOI] [PubMed] [Google Scholar]
- [22].Verschraagen M, Bosma M, Zwiers THU, Torun E, van der Vijgh WJF, Quantification of mesna and total mesna in kidney tissue by high-performance liquid chromatography with electrochemical detection, Journal of Chromatography B. 783 (2003) 33–42. [DOI] [PubMed] [Google Scholar]
- [23].James CA, Mant TG, Rogers HJ, Pharmacokinetics of intravenous and oral sodium 2-mercaptoethane sulphonate (mesna) in normal subjects, British Journal of Clinical Pharmacology. 23 (1987) 561–568. [DOI] [PMC free article] [PubMed] [Google Scholar]
- [24].James CA, Rogers HJ, Estimation of mesna and dimesna in plasma and urine by high-performance liquid chromatography with electrochemical detection, Journal of Chromatography B: Biomedical Sciences and Applications. 382 (1986) 394–398. [DOI] [PubMed] [Google Scholar]
- [25].Shah VP, Midha KK, Findlay JWA, Hill HM, Hulse JD, McGilveray IJ, McKay G, Miller KJ, Patnaik RN, Powell ML, Bioanalytical method validation—a revisit with a decade of progress, Pharmaceutical Research. 17 (2000) 1551–1557. [DOI] [PubMed] [Google Scholar]
- [26].U.S.D. of Health, H. Services, Bioanalytical method validation, guidance for industry, Http://Www. Fda. Gov./Cder/Guidance/4252fnl. Htm. (2001).
- [27].Bhadra S, Zhang Z, Zhou W, Ochieng F, Rockwood GA, Lippner D, Logue BA, Analysis of potential cyanide antidote, dimethyl trisulfide, in whole blood by dynamic headspace gas chromatography–mass spectroscopy, Journal of Chromatography A. 1591 (2019) 71–78. [DOI] [PubMed] [Google Scholar]
- [28].Gyamfi OA, Bortey-Sam N, Donkor AB, White CW, Logue BA, Analysis of TRPA1 antagonist, A-967079, in plasma using high-performance liquid chromatography tandem mass-spectrometry, Journal of Pharmaceutical Analysis. 10 (2020) 157–163. [DOI] [PMC free article] [PubMed] [Google Scholar]
- [29].Logue BA, Manandhar E, Percent residual accuracy for quantifying goodness-of-fit of linear calibration curves, Talanta. 189 (2018) 527–533. [DOI] [PubMed] [Google Scholar]
- [30].Causon R, Validation of chromatographic methods in biomedical analysis viewpoint and discussion, Journal of Chromatography B: Biomedical Sciences and Applications. 689 (1997) 175–180. [DOI] [PubMed] [Google Scholar]
- [31].Gyamfi OA, Development of Analytical Methods for Toxic Inhaled Hazards (TIH) and Their Metabolites, (2020). [Google Scholar]
- [32].Braggio S, Barnaby RJ, Grossi P, Cugola M, A strategy for validation of bioanalytical methods, Journal of Pharmaceutical and Biomedical Analysis. 14 (1996) 375–388. [DOI] [PubMed] [Google Scholar]
- [33].Shabir GA, Validation of high-performance liquid chromatography methods for pharmaceutical analysis: Understanding the differences and similarities between validation requirements of the US Food and Drug Administration, the US Pharmacopeia and the International Conference on Harmonization, Journal of Chromatography A. 987 (2003) 57–66. [DOI] [PubMed] [Google Scholar]
- [34].Shabir GA, John Lough W, Arain SA, Bradshaw TK, Evaluation and application of best practice in analytical method validation, Journal of Liquid Chromatography & Related Technologies. 30 (2007) 311–333. [Google Scholar]
- [35].Verschraagen M, Zwiers THU, de Koning PE, Welink J, van der Vijgh WJF, Quantification of BNP7787 (dimesna) and its metabolite mesna in human plasma and urine by high-performance liquid chromatography with electrochemical detection, Journal of Chromatography B: Biomedical Sciences and Applications. 753 (2001) 293–302. [DOI] [PubMed] [Google Scholar]