Abstract
Poor bone quality is associated with Type 2 Diabetes (T2D), with patients having a higher risk of fracture despite normal to high bone mineral density (BMD). Diabetes contributes to modifications of the mineral and organic matrix of bone. Hyperglycemia has been linked to the formation of advanced glycation end-products (AGEs) which increase the risk for skeletal fragility fractures. To this end, we investigated diabetes-induced skeletal fragility using a high-fat diet (HFD) mouse model and evaluated the efficacy of phenacyl thiazolium chloride (PTC) for in vitro removal of glycation products to rescue bone toughness. Ten-week-old C57BL/6J male mice (n=6/group) were fed a HFD or low-fat diet (LFD) for 22 weeks. Mice given a HFD developed T2D and increased body mass compared to LFD-fed mice. MicroCT results showed that diabetic mice had altered microarchitecture and increased mineralization as determined by volumetric BMD and increased mineral crystal size as determined by X-ray Diffraction (XRD). Diabetic mice demonstrated loss of initiation and maximum toughness, which represent estimates of the stress intensity factor at a notch tip using yield force and ultimate force, respectively. Diabetic mice also showed higher accumulation of AGEs measured by biochemical assay (total fAGEs) and confocal Raman spectroscopy (Pentosidine (PEN), Carboxymethyl-lysine (CML)). Regression analyses confirmed the association between increased glycoxidation (CML, PEN) and loss of fracture toughness. Within the diabetic group, CML was the most significant predictor of initiation toughness while PEN predicted maximum toughness as determined by stepwise linear regression (i.e., stepAIC). Contralateral femora from HFD group were harvested and treated with PTC in vitro. PTC-treated samples showed total fAGEs decreased by 41.2%. PTC treatment partially restored bone toughness as, compared to T2D controls, maximum toughness increased by 35%. Collectively, our results demonstrate that matrix modifications in diet-induced T2D, particularly AGEs, induce bone fragility and their removal from bone matrix partially rescues T2D associated bone fragility.
Keywords: Diabetes, Glycoxidation, Glycation, Bone Quality, Preclinical Studies, Collagen, Biomechanics
Graphical abstract

1. Introduction
Type 2 diabetes (T2D) is a worldwide epidemic that is characterized by a decline in β-cell function and worsening of insulin resistance progressing into hyperglycemia [1]. Patients diagnosed with T2D have a 3-fold increase in the risk for fragility fractures [2–7] despite observed normal to elevated bone mineral density (BMD) [8]. Therefore, the weakened state of diabetic bones cannot be explained by the sheer quantity of bone requiring investigation of bone quality [9].
Most of the damage that diabetic bone undergoes begins with the state of hyperglycemia, the hallmark of T2D. With the elevated blood glucose levels seen with hyperglycemia, there is an increase in oxidative stress which produces reactive oxygen species (ROS) [10]. Elevated levels of ROS can damage type 1 collagen, a structural protein which makes up 90% of the total proteins found in bone [11]. Additionally, hyperglycemia causes an increase of circulating glucose molecules to be free to react with amino acid residues of proteins, a process known as a Maillard reaction that non-enzymatically produces advanced glycation end-products (AGEs) [12,13].
Accumulation of AGEs can reduce bone turnover and bone’s resistance to fracture [13–15]. In particular, the increased presence of AGEs has been found to stiffen the organic matrix [12], disrupt collagen organization, [15] and alter fibrillar sliding [16] leading to reduced energy dissipation in bone. Furthermore, AGEs can reduce the amount of collagen bound water [17] which is associated with a loss of fracture properties in bone such as toughness [18].
AGE products, including pentosidine (PEN) and carboxymethyl-lysine (CML), have been found to accumulate in bone [18, 19]. Traditionally, AGE content in bone has been measured by quantifying the levels of fluorescent AGEs (fAGEs) “in bulk,” including PEN. Interestingly, another type of AGE, a non-fluorescent glycation product, CML, is present in bone in amounts up to a hundred times higher as compared to PEN [19]. Accumulation of PEN and CML have both been associated with the loss of bone quality [19,20]. While PEN has been mainly correlated to the stiffening of the organic matrix [21], CML can disrupt signaling of the receptor for AGEs (RAGE) and directly introduce pro-inflammatory effects [22] as well as interfere with healthy mineralization [23, 24]. CML has a negatively charged carboxyl group that can potentially attract positively charged calcium ions, link the organic and inorganic matrix, and promote mineralization [23, 24]. Furthermore, glycoxidation products (e.g., PEN, CML) can lead to metabolic changes, as they up-regulate pro-inflammatory cytokines which have been found to affect lipid metabolism and increase risk for development of hyperlipidemia [25, 26]. Furthermore, elevation of glycation processes depends upon an increase in glucose levels, a direct casualty of hyperglycemia [26]. Both glycation and glycoxidative processes can therefore alter bone quality in T2D.
Due to detrimental effects of AGEs on bone health [11–15], there is a need to develop rescue treatments. Interestingly, several precursors of AGEs (e.g., Glyoxal, Methylglyoxal, 3-Deoxyglycosone) contain a dicarbonyl group that is functionally asymmetrical allowing the carbon-carbon bond of α-diketones to be selectively cleaved in reactions with certain thiazolium salts [27, 28]. Moreover, phenacyl thiazolium bromide (PTB), 3-(2-Oxo-2-phenylethyl)-1,3-thiazol-3-ium bromide, has been tested as an AGE cross-link breaker specifically in bone tissue [29]. In vitro PTB was shown to remove “in bulk” fAGEs, and their removal restored the material-level post-yield properties of the trabecular architecture in aging bone [29]. Such an in vitro approach is useful in removal of AGEs for bone grafts obtained from diabetic and aging population. [30] However, PTB is known to be unstable, and long-term use may cause side effects due to its toxicity [31]. Recent work (see below) has shifted towards 4,5-dimethyl-3-(2-oxo-2-phenylethyl) thiazolium chloride, or phenacyl thiazolium chloride (PTC), which is an analog compound of PTB. While the primary mechanism of action remains the same as with PTB, the PTC compound contains chloride that makes PTC a safer alternative to the long-term toxicity problems associated with bromide derivatives.
Several animal and human studies have tested the efficacy and toxicity of PTC, also commonly known as ALT-711 or Alagebrium, and have demonstrated its safety [32–37]. Clinical studies have tested the effect of PTC on vascular function, lipoproteins and liver function, collagen turnover, and inflammation [32–34]. Early studies have shown that PTC reduces collagen turnover and the levels of several inflammatory markers, while showing no harmful in vivo effects [34]. In vivo daily injections of PTC to Cy/+ rats as well as to a murine model for chronic kidney disease-mineral bone disorder demonstrated significant reduction of fAGE accumulation in bone, but not in PEN [35]. Furthermore, in vivo PTC treatment on the diabetic BKS.Cg-m+/+ Leprdb mice showed increased serum CML levels after 1st week of treatment [36]. Interestingly, by the 3rd week of treatment, PTC had significantly reduced serum CML [36]. These results suggest that PTC may have several mechanisms of action. While the primary mechanism of the PTC action involves the cleavage of AGEs by targeting α-dicarbonyl carbon-carbon bonds formed in cross-linked structures [37], it has been reported that PTC could also act as a methylglyoxal inhibitor through metal chelation [37].
We previously demonstrated PTC to be safe in vivo while achieving high removal of fAGEs glycation cross-links in aging bone [38]. In contrast to aging bone, T2D bone may accumulate an expanded variety of AGEs including PEN and CML which are linked to the process of glycoxidation. However, little is known about their accumulation in bone during diet-induced T2D. Furthermore, efficacy of PTC in removing the variety of AGEs and rescuing bone fragility has not yet been established.
Therefore, the goal of this study was to investigate the impact of diabetes-induced bone fragility using a high fat diet (HFD) mouse model and to evaluate the efficacy of phenacyl thiazolium chloride (PTC) for removal of AGEs to rescue bone toughness in a T2D mouse model through a combination of in vivo and in vitro approaches. We hypothesized that diabetic mice would show increased levels of glycation and in vivo bone fragility, both of which could be restored in vitro using PTC treatment.
2. Materials and methods
2.1. Study design
This study and all procedures within were approved and carried out according to the rules and regulations of the Rensselaer Polytechnic Institutes’ Institutional Animal Care and Use Committee. Twelve male C57BL/6J mice (8 weeks of age) were obtained from Taconic Biosciences (Rensselaer, NY) and transferred to our BioResearch Core animal facility. After 2 weeks of acclimation, the animals were randomly divided into two groups of 6 animals. One group was fed a low-fat diet (LFD), and the other fed a high-fat diet (HFD). Food was purchased from TestDiets (St. Louis, MO) and can be found under catalog #58Y2 (LFD), and #58V8 (HFD). Energy (kcal/g)2 from fat, protein and carbohydrates was altered between LFD (10% fat, 72% carbs, 18% proteins) and HFD (46% fat, 36% carbs, 18% proteins). For this formulation, fat-soluble vitamins and the needed polyunsaturated acids (PUFAs) for solubilization were altered between LFD (3.8 IU/g Vitamin A, 0.9 IU/g Vitamin D-3, 49.3 IU/kg Vitamin E, 0.48 ppm Vitamin K; 1.59% PUFAs) and HFD (4.7 IU/g Vitamin A, 1.2 IU/g Vitamin D-3, 60.6 IU/kg Vitamin E, 0.59 ppm Vitamin K; 3.83% PUFAs). The dietary intervention started at 10 weeks of age for 22 weeks until 32 weeks of age. All animals were fed ad-libitum and given unrestricted access to filtered water while kept on a regular 12-hour light/dark cycle.
2.2. Body mass and glucose measurements
Body mass measurements were taken every 7 weeks to measure weight changes associated with the diet intervention. These timepoints also coincided with oral glucose tolerance tests (OGTTs) for the mice as a measure of impact from the dietary intervention on glycemic control. Fasting period prior to the start of each OGTT was 6 hours. Mice were given an oral glucose dose (2 grams/kg body mass) by feeding needle. Blood glucose measurements were collected at five intervals corresponding to 0, 15, 30, 60, and 120-minute time points [39]. Baseline measurements at timepoint 0 represent the fasting blood glucose (also after 6 hours of fasting), which was used to categorize the animal’s glycemic control as normal (< 199 mg/dL), pre-diabetic (200–249 mg/dL), or diabetic (> 250 mg/dL) [40].
2.3. Tissue collection and harvest
At 32 weeks of age, all animals were euthanized by isoflurane overdose and cervical dislocation as secondary method of confirmation. Soft tissues were completely removed, and hind limbs were separated. For the LFD group (n=6), one femur was randomly selected for harvesting from each mouse. Notably, we ensured a balance between left and right femur selection. For the HFD group, left and right femora were harvested (n=12) from each mouse and randomly divided between groups (6 samples per group). With the HFD cohort, a control group received saline as treatment, and an experimental group received the in vitro PTC treatment. Again, we ensured that each group contained equal number of left and right femur specimens. All femora samples (N=18, includes one femur from each mouse fed with LFD (N=6) and both femurs from mice fed with HFD (N=12)) were stored in Eppendorf tubes submerged with saline and frozen at a temperature of −80°C until further use.
2.4. Micro-computed tomography analysis
Whole-bone femora were scanned by micro-computed tomography (microCT) (Scanco, vivaCT40, Swizterland), following guidelines by Bouxsein et al. [41]. Cortical and trabecular regions of femora were assessed by high resolution scans (70 kVp, 21.5 mm FOV, 10.5 mm voxel size, 301 integration time). Scans utilized a hydroxyapatite (HA) phantom for calibration, thus here we are reporting BMD in units of milligrams of HA per cubic centimeter [41]. Global threshold was set for 656 mg HA/cm3 for segmentation along with a gaussian filtration (σ = 0.8, support = 1). Cortical morphology was evaluated from 30 slices morphed from a ~0.3 mm region at the midshaft. Given that we scanned whole-bone specimens, we were able to consistently locate the mid-point of the diaphysis (i.e., the region of interest). Location of the mid-point was achieved by subtracting the number of the final slice, where the specimen appeared, from the number of the first slice, where the specimen appeared, and dividing the difference by two (i.e., [final slice # - first slice #]/2). The following variables were also collected: periosteal diameter, endosteal diameter, cortical thickness (Ct.Th), moment of inertia in the medio-lateral plane (Iml), cortical bone area fraction (Ct. Ar/Tt.Ar), and cortical tissue mineral density (cTMD). Reconstruction images (2D, 3D) were collected and recorded. To perform trabecular analysis, the most distal slice in which the condyles meet was identified and used as a point of reference. The VOI for trabecular analysis was defined by first locating the growth plate in the distal end of the femora. Contouring was started 5 slices from it for a ~0.5mm region with contours every 10 slices and a 5% reduction to ensure no cortical bone was included in the analyses. Variables of interest were: bone volume fraction (BV/TV), trabecular volumetric BMD (tBMD), trabecular thickness (Tb.Th), trabecular number (Tb.N), and trabecular separation (Tb.Sp). Reconstruction images (2D, 3D) were collected and recorded.
2.5. In vitro PTC treatment
The femora samples from mice given a HFD received either the in vitro PTC treatment or were kept in saline as a control. All femora samples (n=6/group) had the head and condyle cut off using a slow speed (150 rpm) diamond saw blade (Buehler Isomet 100, Lake Bluff, IL). This allowed for complete removal of the bone marrow using a saline-filled needle to wash it out. Samples were cleaned as follows. Each specimen was washed in 100 μL of saline, followed by three washes in 100 μL of 1 × PBS (pH = 7.0). The same PBS buffer was also used to solubilize PTC to the final 50 mM concentration. PTC was purchased from TimTec, LLC (New Castle, DE) and can be found under CAS Number 341028–37-3. Samples were incubated for 7 days at 37°C, with solutions changed at the mid-point of the incubation time. Afterwards, samples were washed again three times in 100 μL of 1 × PBS (pH = 7.0) and then stored in saline at −80°C until used.
2.6. Mechanical characterization
Femora samples were cut using a slow speed (150 rpm) diamond saw blade (Buehler Isomet 100, Lake Bluff, IL) to obtain a specimen with approximate cylindrical morphology by removing both ends. Further, a razorblade was used to create a sharp and controlled notched at the mid-diaphysis. This notched was created to measure bone’s resistance to fracture. To analyze the angle of the created notch, we rescanned the mid-shaft using microCT and created 3D reconstruction images that were then analyzed by ImageJ software. All samples were then tested under wet conditions using an electromechanical testing system (EnduraTEC 3200, TA Instruments, Delaware) at a ramp speed of 0.001 mm/s and span length of 5 mm in a three-point bending set-up. Left and right femora specimens (equal number, i.e., 50% of left femora and 50% of right ones) were loaded on the posterior surface, as the notched region corresponded to the anterior surface, with the medial side facing forward. Load and displacement curves were recorded and initiation toughness (Kc, in), and maximum toughness (Kc, max) were calculated for all samples [42, 43]. Toughness values were calculated from the loads corresponding to the intercept of a 5% secant line [42] (Kc, in) or the maximum load recorded (Kc, max).
2.7. Measurement of fluorescent advanced glycation end-products (fAGEs) “in bulk”
The protocol used to clean bone tissue and measure fAGEs “in bulk” in bone samples has been described in detail elsewhere [11–13]. Briefly, following fracture toughness, a ~2 mm section from the midshaft of each femora sample was cut for measurement of fAGEs. This represented approximately 10 mg of cortical bone. These sections were de-fatted in a solution of 100% isopropyl ether. Specimens were then lyophilized overnight (i.e., for approx. 16 hours). Each dry specimen was placed in a glass vial and submerged with 6N HCl solution (50 μL per 1 mg of bone). All vials were incubated at 110°C. After cooling, two hydrolysates out of each sample were made by dilution with nanopure water (i.e., for two separate assays).
For the first assay, the quinine sulphate was used to prepare solutions for a standard curve (1 μg Quinine/mL 0.1 M H2SO4), which was diluted with sulfuric acid. Using a 96-microtiter plate, triplicates of each sample hydrolysate and the standards were dispensed into the wells of a microtiter-plate (MT-plate). The fluorescence of the standards and the samples was measured using a spectrophotometer (Infinite 200, Tecan Trading AG, Switzerland) at 360 nm excitation and 460 nm emission.
For the second assay, the hydroxyproline content of each sample was measured. A standard curve was made from a hydroxyproline stock (2000 μg L-hydroxyproline / mL 0.001 M HCl). Different concentrations of hydroxyproline standards were made by diluting the stock with nano-pure water. A solution of chloramine-T was added to each standard and sample hydrolysate and then incubated at room temperature. Following, a 3.15 M perchloric acid solution was added and incubated at room temperature. Finally, a p-dimethylaminobenzaldehyde solution was added and incubated at 60°C. Triplicates of each standard and sample hydrolysate were placed in a 96-well plate. The absorbance of each sample was measured at 570 nm using the spectrophotometer (Infinite 200, Tecan Trading AG, Switzerland). The fAGEs content for each sample was then calculated and expressed as ng of quinine per mg of collagen (i.e., quinine/collagen [ng/mg]) [13].
2.8. Confocal Raman spectroscopy
Femora were sectioned from the mid-diaphysis using a slow speed diamond saw. After drying, specimens were embedded in epoxy (EpoHeat CLR Resin & Hardener, Buehler, Lake Bluff, IL). Embedded specimens were transversely cut to produce ~500 μm sections that were polished with carbide and diamond papers to achieve a smooth finish. Raman analysis was performed using a confocal Raman spectroscopy system (WITec Alpha 300R; WITec, Ulm, Germany) equipped with a 532 nm green laser. Confocal spectroscopy was selected as it allows for the magnification to be adjusted and the signal can reach beyond the surface level of the epoxy resin into the bone tissue. An objective lens of 20x was first used to differentiate the bone tissue from epoxy resin (see Supplementary Figure 2). Spectra were then obtained using an objective lens of 100X, grating set to 600 g/cm, BLZ at 500 nm, and at spectral resolution of 2 Δcm−1 with a spectral center at 2302 cm−1 shift. A single line spectrum was acquired over 10 μm with 20 accumulations at an integration time of 1s along the longitudinal axis of the sample. Single point spectra with an integration time of 4s and 10 accumulations were also acquired to verify the spectra obtained from the line spectrum. WITec software was used for baseline correction which was performed from the spectra of the epoxy resin (see Supplementary Figure 2) prior to peak analysis. Acquisitions from the line spectrum were averaged and convoluted by a second-order Savitzky-Golay digital filter (window size 21) for analysis.
The full-width half-maximum (FWHM) of several peak intensities of interest were calculated using a custom script in MATLAB (R2018b, MathWorks, Natick, MA), following published methods [44–53]. Peak intensity of phosphate (ν1PO43−, 961.4 cm−1; ν2PO4, 430–450 cm−1), carbonate (ν1CO32−, 1070 cm−1), Amide I (1667 cm−1), Amide III (1242 cm−1), methylene wag (CH2-wag, 1453 cm−1), pentosidine (PEN, 1345 cm−1), carboxymethyl-lysine (CML, 1150 cm−1), OH-band at (2950 cm−1) and bound water (3220 cm−1) were measured and then used to analyze intensities of bone matrix composites. Peak visibility was confirmed by the average peak intensity over standard deviation. Mineral-to-matrix ratio was calculated using polarization-dependent and - independent peaks, as the relative ratio between the ν1PO4 and Amide I and ν2PO4 and Amide III intensity peaks, respectively. Level of Type-B carbonate substitution was measured as the ratio between the 1060 cm−1 carbonate subpeak and (ν1) phosphate peaks. Glycation cross-links and non-crosslinked, in form of PEN and CML, respectively, were normalized to methylene [46, 47]. CML standard was purchased from Neta Scientific (MFCD04114278) and analyzed by confocal Raman spectroscopy to confirm the Raman marker band for CML (~1150 cm−1) in bone (Supplementary Figure 1).
2.9. X-ray Diffraction
Humeri were dissected from the LFD mouse group (n=6) and HFD mouse group (n=6). Equal number of left or right humeri was randomly selected for each group (n=6: left humeri=3 and right humeri=3). Soft tissues were removed, and all specimens were cleaned. Humeri were cut at the ends using a slow speed (150 rpm) diamond saw blade (Buehler Isomet 100, Lake Bluff, IL) and the shaft was washed free of blood. Dry specimens were then powdered using a mortar and pestle. X-ray diffraction (XRD) patterns were obtained using the Panalytical X’Pert Diffractometer (Malvern Panalytical, Malvern, United Kingdom) operated at 45 kV and 40 mA with Copper (Cu) Kα with wavelength λ = 1.5405980 Å. Diffractograms were taken from 20 to 55° in a 2θ scale with a 0.01° step size and 499 s step count. Diffractograms were then analyzed using the HighScore software (Malvern Panalytical, Malvern, United Kingdom), where background subtraction and smoothing was done prior to peak fitting. The diffraction peak of 002, related to the length of the c-axis, was analyzed. The d-spacing and full width half-maximum (FWHM) of the 002 peak was calculated, and the mineral crystal size was determined using the Scherrer equation, B = kλ/Lcosθ, as previously reported [54–57].
2.10. Statistical Analyses
All data were tested for normality (Kolmogorov-Smirnov) and equal variances (F-test). Statistically significant differences were determined by t-tests (unpaired, two-tailed, α = 0.05) or by paired t-tests (two-tailed, α = 0.05). Longitudinal blood glucose data were tested with Two-Factor ANOVA with Replication (α < 0.05) to discern diet (e.g., LFD and HFD), time progression (e.g., 16-, 23-, and 31-week time-points) and interaction effects. Data are displayed as boxplots (with median and interquartile range) showing all data points. Tables show mean ± SD. Following literature specific to bone, whole-bone properties were adjusted for body mass using a Linear Regression Method [58]. Pearson’s R was used to determined coefficient of correlation between variables. Stepwise linear regression was used to determine the most significant predictor of fracture properties. Statistical analyses were done using R Project (https://www.rproject.org) and data presentation was generated using MATLAB R2020b (The MathWorks, Natick, MA).
3. Results
3.1. C57BL/6J mice given a high-fat diet during growth developed obesity and Type 2 Diabetes
C57BL/6J male mice given a high-fat diet (HFD) had a significantly higher body mass (p = 0.00013, Figure 1A) when compared to mice fed a low-fat diet (LFD). HFD-fed mice also showed an increase in fasting blood glucose (Figure 1B) compared to LFD-fed mice.
Figure 1: C57BL/6J mice given a high-fat diet during development developed obesity and type 2 diabetes.
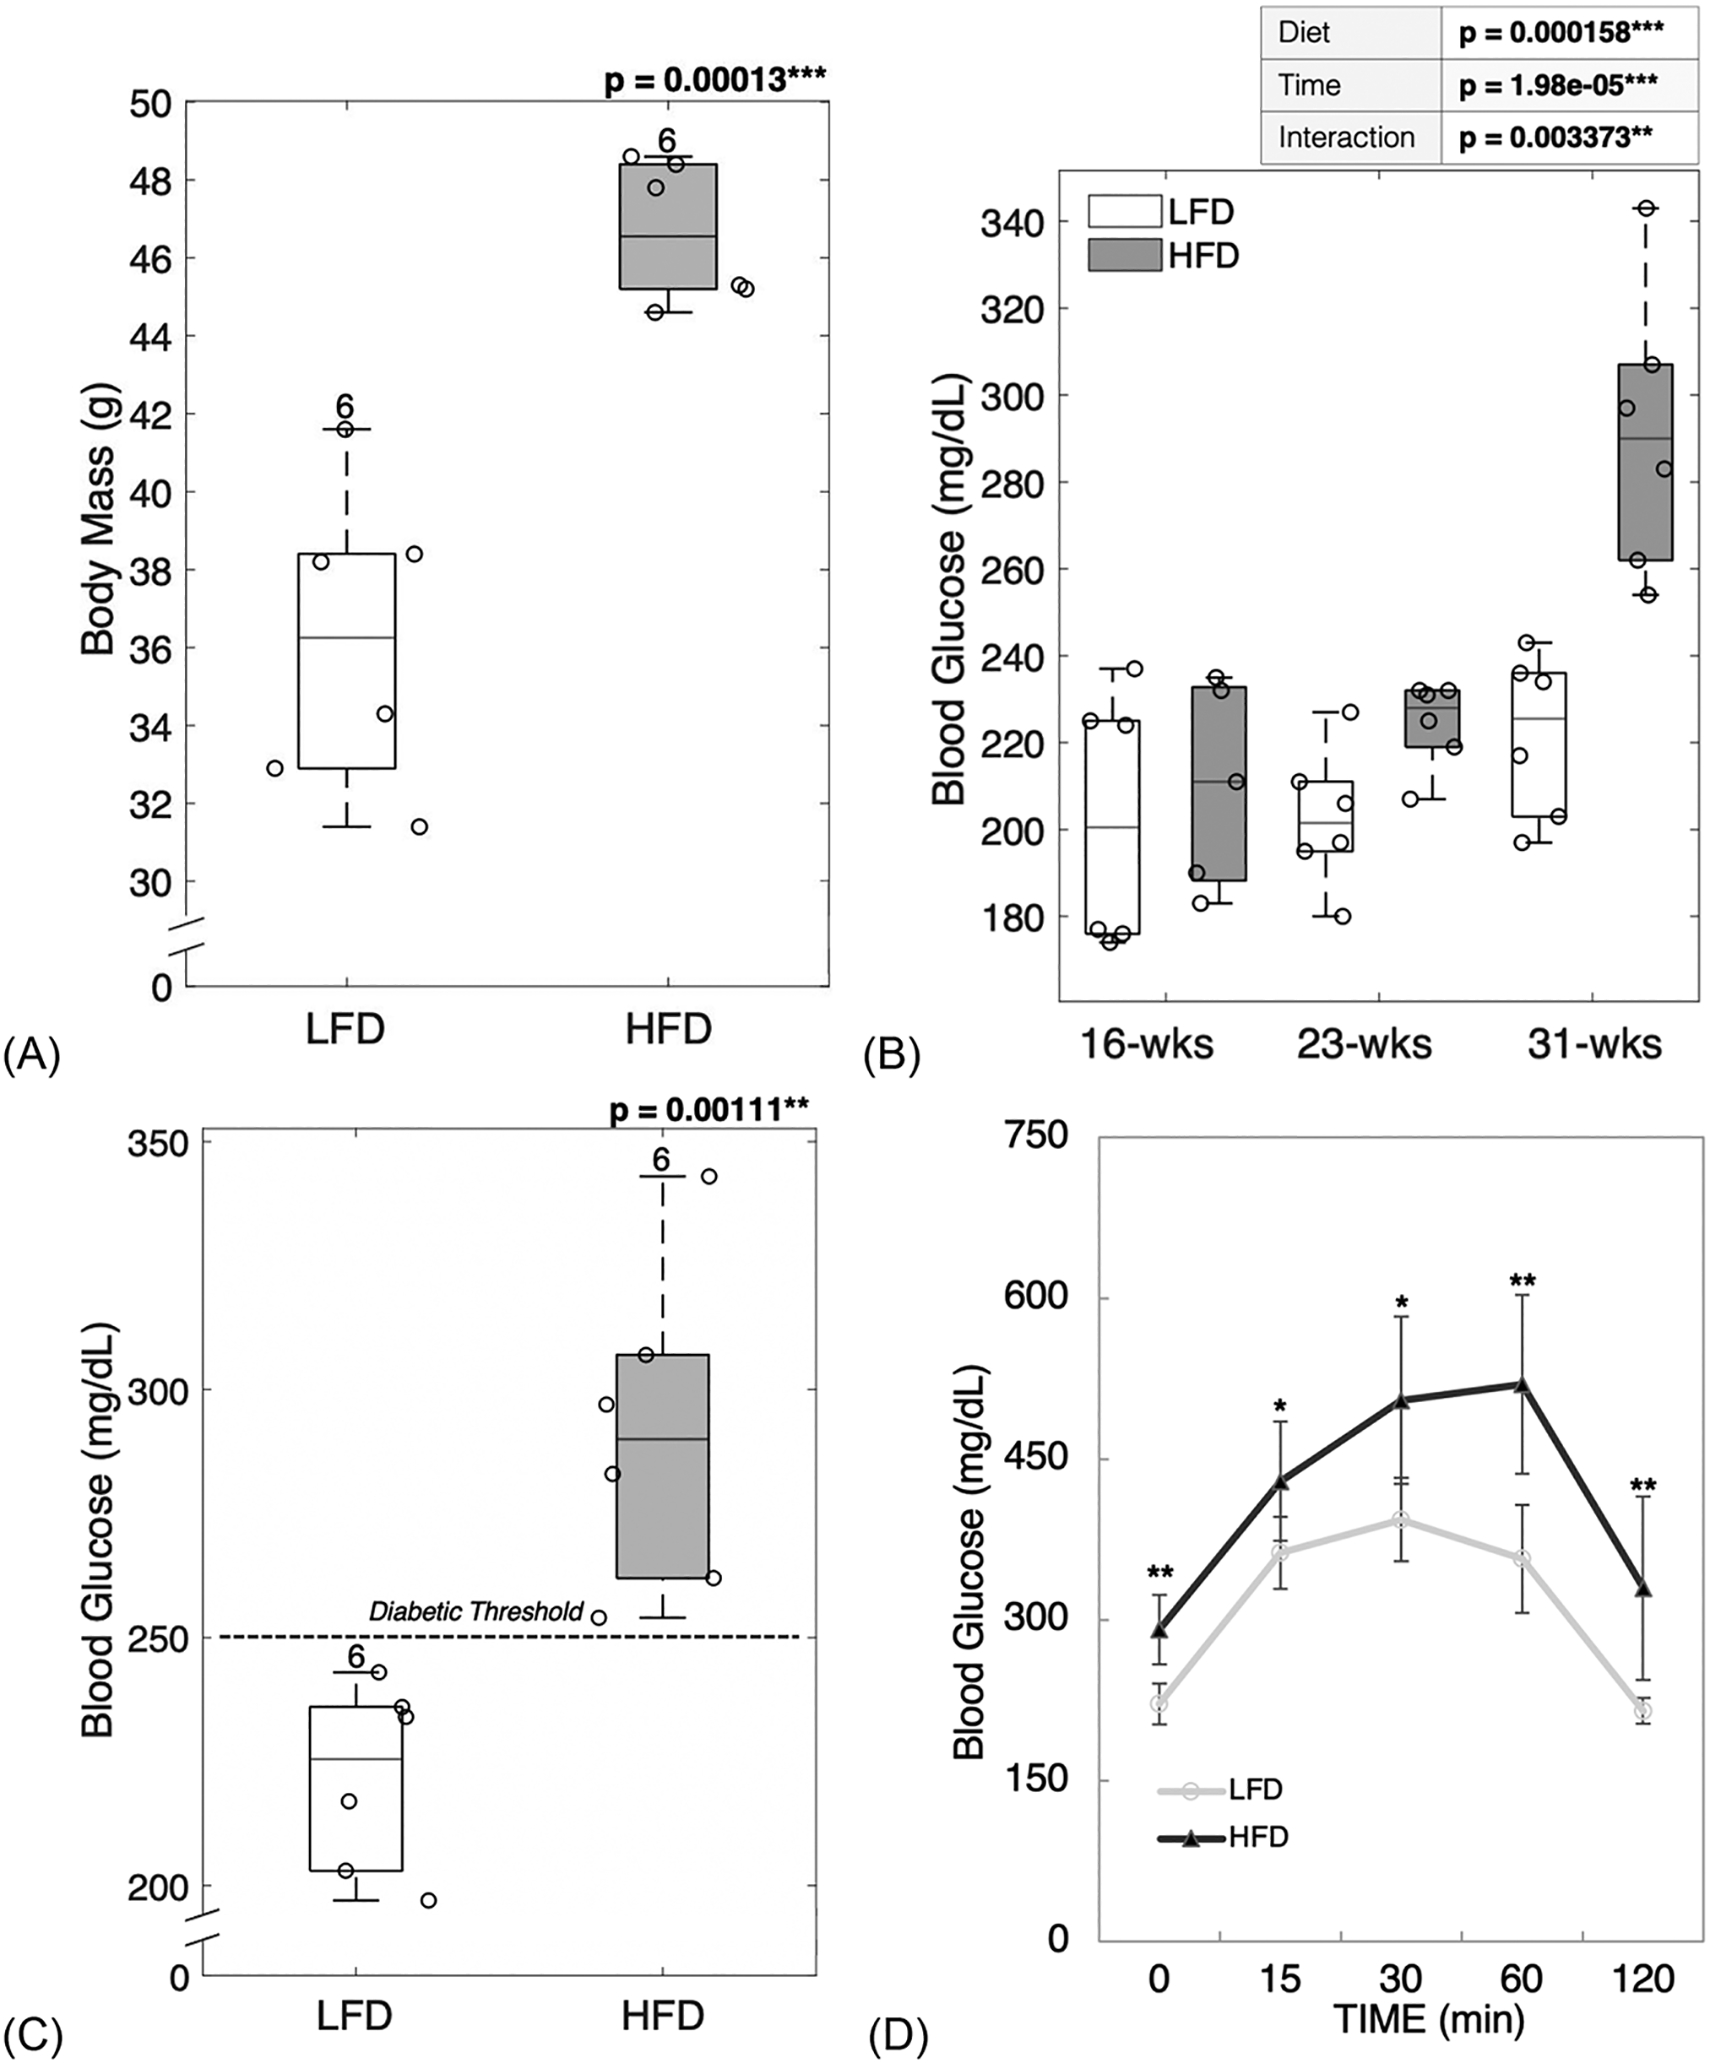
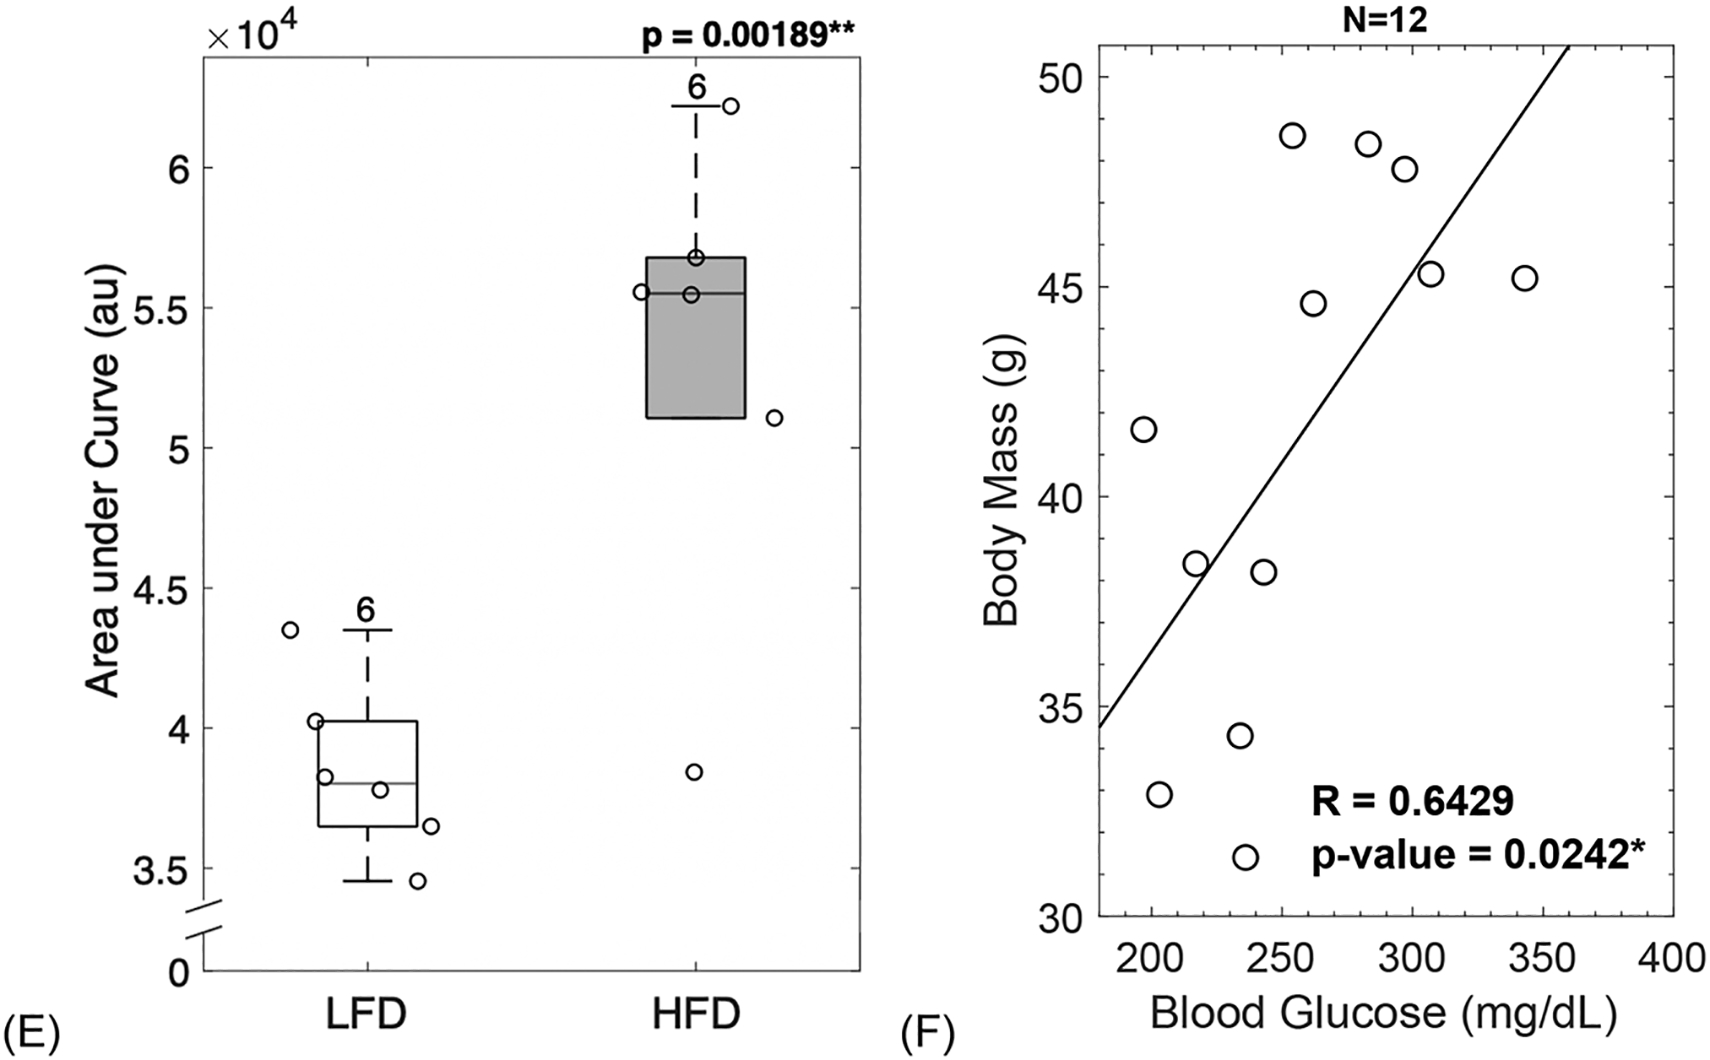
HFD-fed mice showed greater body mass gain compared to LFD-fed mice (A). HFD-fed mice had higher levels of fasting blood glucose throughout the study (B). After diet treatment for 22 weeks, HFD-fed mice had fasting blood glucose in the diabetic range (C), showed a lag-curve in the final OGTT (D) and demonstrated impaired insulin production assessed by the AUC of final glucose tolerance test (E). The increase in body mass correlated with the increase in blood glucose showing interconnection between obesity and diabetic status (F). LFD = low-fat diet; HFD = high-fat diet; AUC = area under curve. Results are shown as boxplots (with median and interquartile range) showing all data points. Statistically significant differences were determined by t-tests (unpaired, two-tailed, α=0.05) or Two-Factor ANOVA with Replication (α < 0.05). Number on top of each boxplot indicates sample size. Coefficient of correlation determined by Pearson’s R test (α=0.05). Significant codes: p < 0.05 ‘*’, p < 0.01 ‘**’, p < 0.001 ‘***’.
Two-Factor ANOVA with Replication (α < 0.05) was used to discern diet (e.g., LFD and HFD), time progression (e.g., 16-, 23-, and 31-week time-points) and interaction effects. Fasting blood glucose was significantly different between diets (p = 0.000158), time-points (p = 1.98e-05) and the combination of diet and time progression was also significant (p = 0.003373) emphasizing the negative impact of prolonged poor dietary habits. At 16-weeks of age, both groups of mice showed similar levels of blood glucose (p = 0.6349, Figure 1B). However, by 23-weeks of age, HFD fed mice showed a significant increase in blood glucose (p = 0.0181, Figure 1B) that reached and surpassed the diabetic threshold for mice (> 250 mg/dL) [40]. Within the LFD group, blood glucose was not statistically significantly different between time points. Within the HFD group, blood glucose was significantly higher between the 23rd and 31st week (p = 0.0007121) and between the 16th and 31st week (p = 0.001254).
Fasting blood glucose measurements taken at the end of the study demonstrated a stark contrast between LFD and HFD-fed mice with all mice fed a HFD becoming diabetic (p = 0.0011, Figure 1C). Interestingly, LFD-fed mice reached blood glucose levels in the pre-diabetic by the 31st week (Figure 1C). The OGTT measurements taken at the end of the study (Figure 1D) showed glucose excursion for HFD-fed mice had a lag-curve typical or delayed storage.
The area under the OGTT curve (AUC) was calculated and used as an index of glucose tolerance. In agreement with the fasting blood glucose, AUC results showed that HFD fed mice experienced significantly greater difficulty in restoring glucose levels back to baseline (p = 0.00189, Figure 1E).
The increase seen in body mass correlated with the increase in blood glucose (R = 0.6429, p = 0.0242, Figure 1F). Thus, it is likely that obesity and diabetic status were interconnected.
3.2. Diabetic mice showed altered microarchitecture and increased BMD
Diabetic mice displayed significantly increased trabecular thickness (p = 0.0138, Figure 2A). However, trabecular number (p = 0.899, Figure 2B) and trabecular spacing (p = 0.165, Figure 2C) remained unchanged. T2D mice showed significantly increased bone volume fraction (BV/TV) (p = 0.0397, Figure 2D) and trabecular volumetric bone mineral density (BMD) (p = 0.00395, Figure 2E).
Figure 2: Diabetic mice showed altered microarchitecture and increased mineralization.
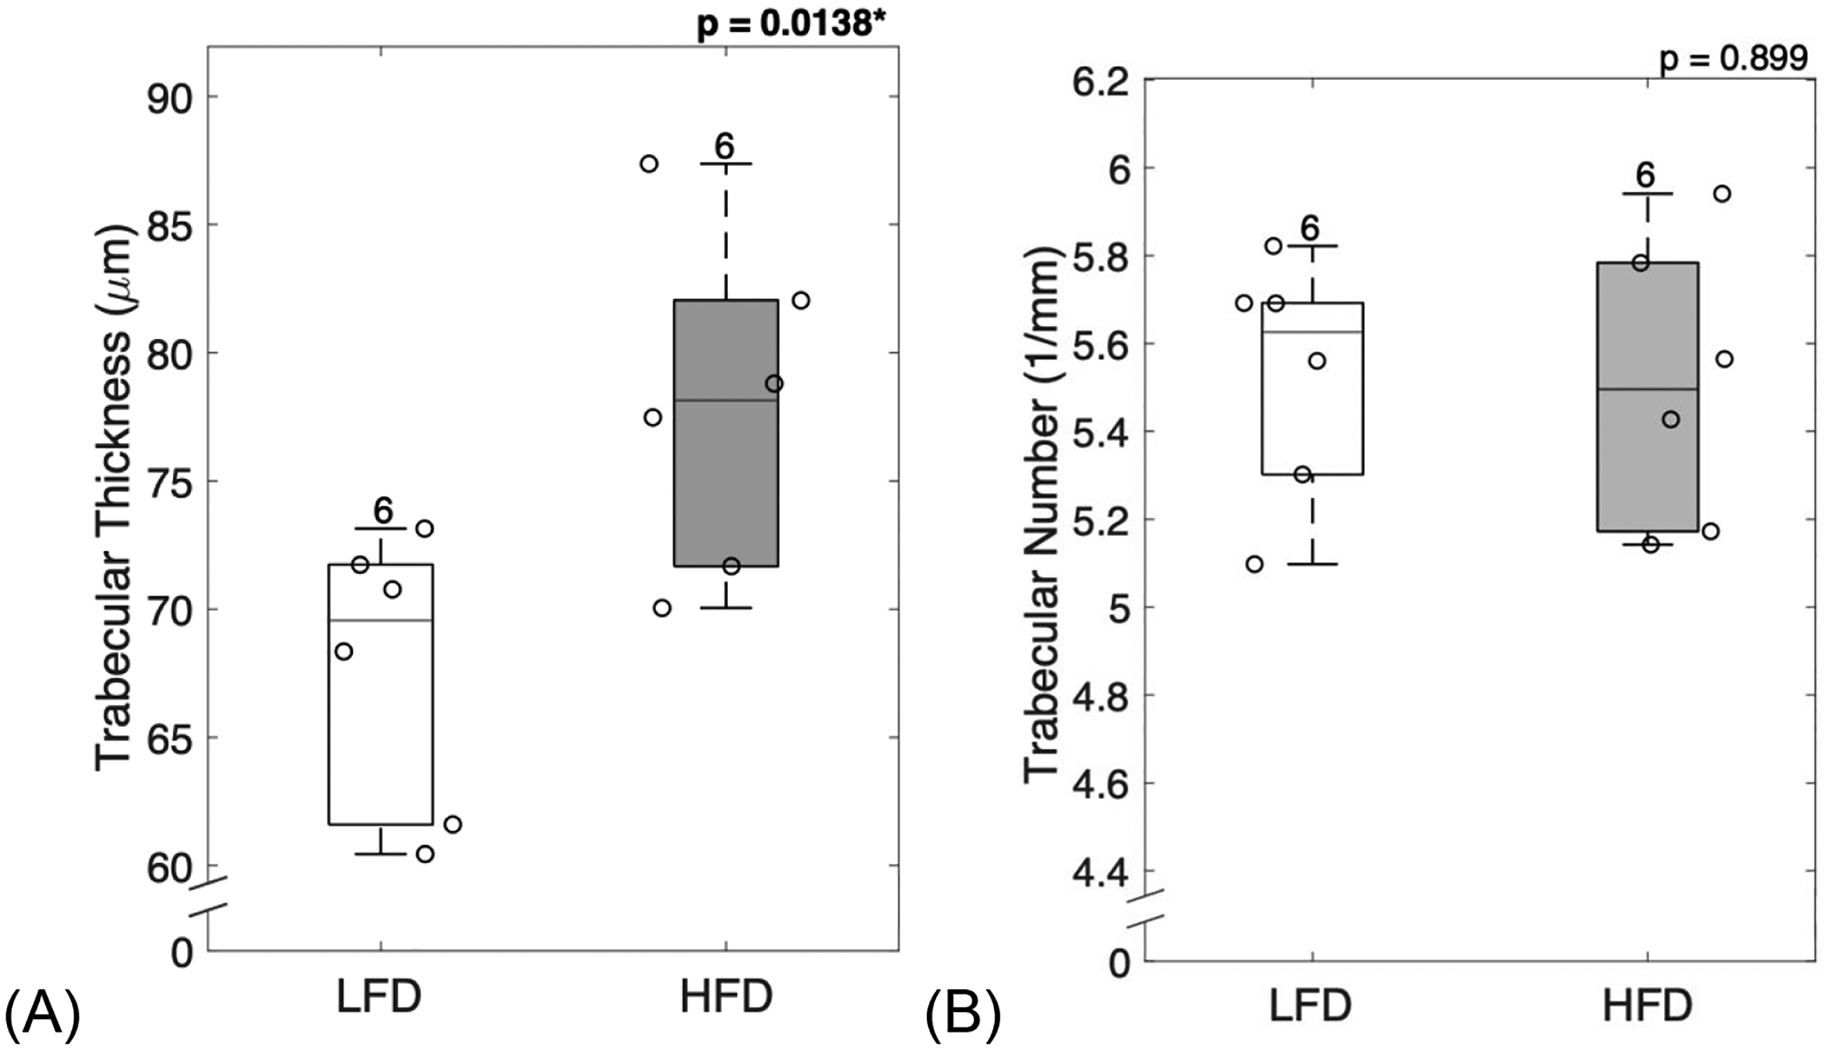
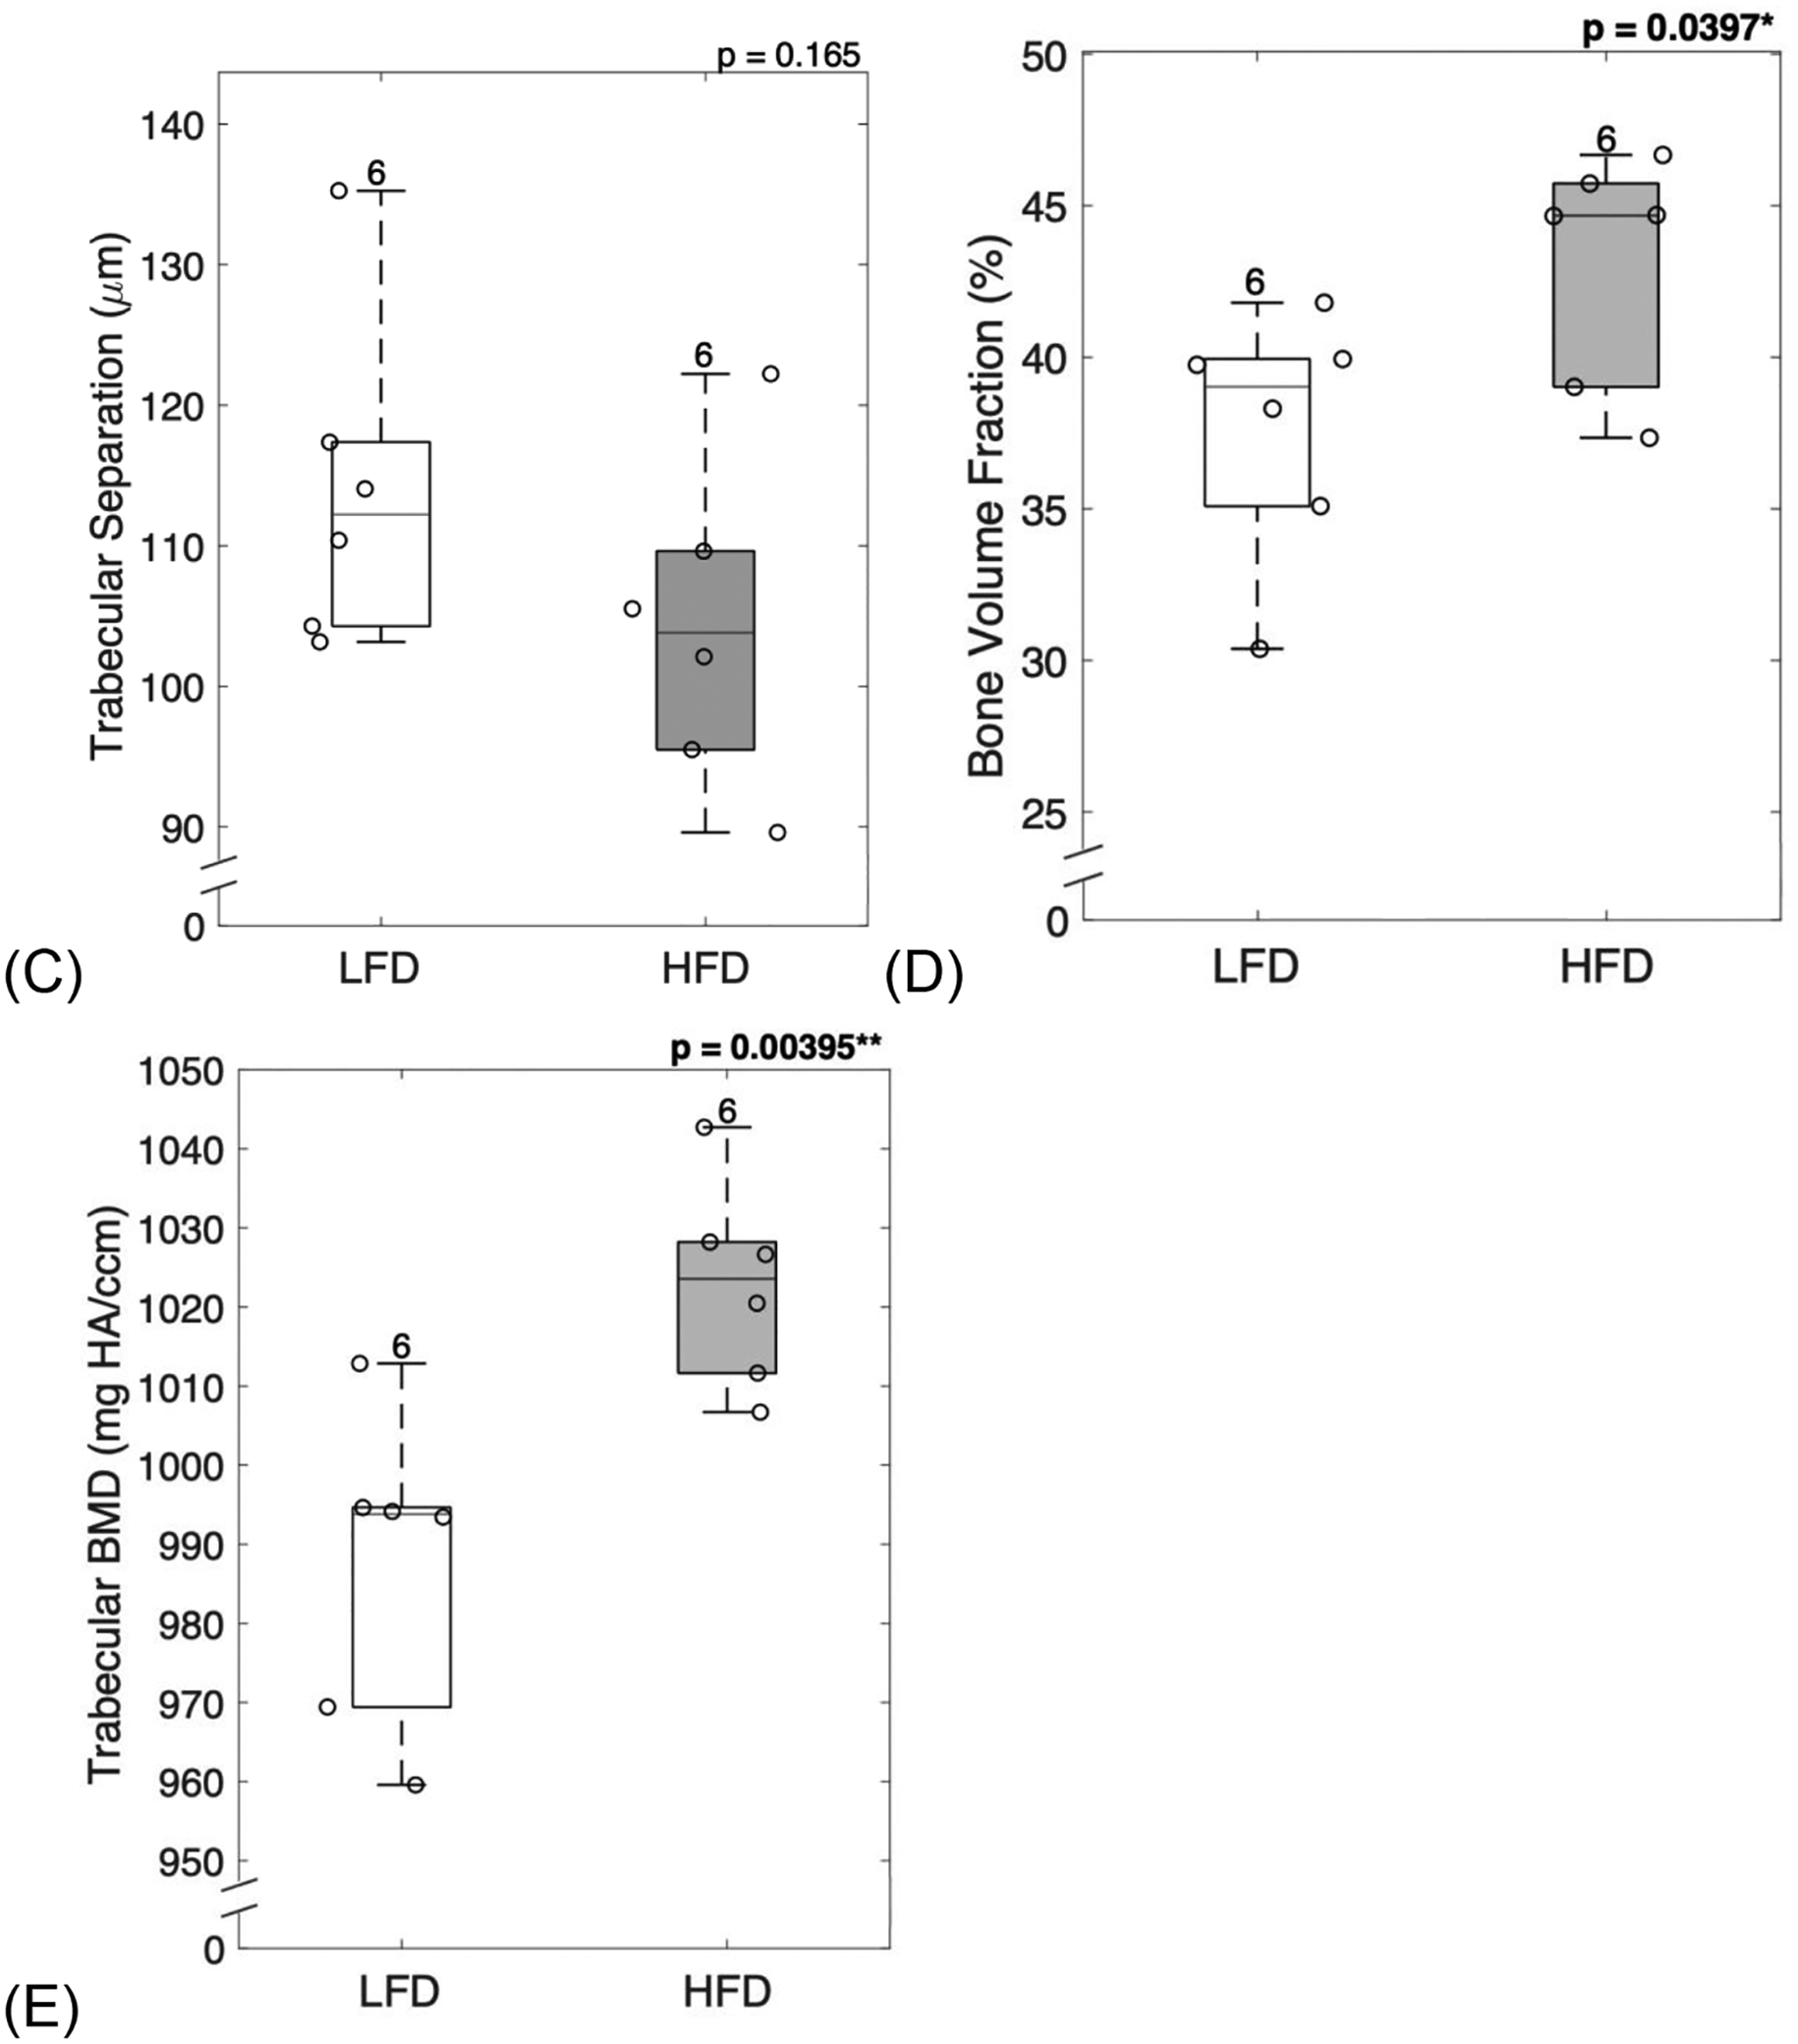
Trabecular structure analyzed at the distal femur showed that diabetic mice had increased trabecular thickness (A), but no changes in trabecular number (B) or trabecular separation (C). Diabetic mice demonstrated typical increase in bone volume fraction (D) and trabecular volumetric BMD (E). LFD = low-fat diet; HFD = high-fat diet; BMD = bone mineral density. Results are shown as boxplots (with median and interquartile range) showing all data points. Statistically significant differences were determined by t-tests (unpaired, two-tailed, α=0.05). Number on top of each boxplot indicates sample size. Significant codes: p < 0.05 ‘*’, p < 0.01 ‘**’.
3.3. Diabetic mouse bones showed changes in geometry and a significant reduction in marrow expansion
Femoral cortical structure analyzed at the mid-diaphysis showed non-significant increases in inner and outer surface expansion, cortical thickness, and cortical area fraction (Table 1). However, there was a significant reduction in the moment of inertia (Iml). Cortical tissue mineral density did not show significant changes with HFD intervention.
Table 1.
Femoral cortical morphology assessed by microCT imaging.
| LFD | HFD | ||
|---|---|---|---|
| (n = 6) | (n = 6) | ||
| Endosteal Dia. (mm) | 1.0472 ± 0.0520 | 1.0765 ± 0.0569 | p = 0.3734 |
| Periosteal Dia. (mm) | 1.4188 ± 0.0623 | 1.4659 ± 0.0562 | p = 0.1995 |
| Ct. Th (μm) | 185.8 ± 13.9 | 194.7 ± 7.2 | p = 0.194 |
| Ct.Ar/Tt.Ar (%) | 41.28 ± 02.41 | 42.43 ± 01.06 | p = 0.3119 |
| Iml (mm^4) | 0.2663 ± 0.0568 | 0.1943 ± 0.0538 | p = 0.048 * |
| cTMD (mg HA/ccm) | 1258.77 ± 14.37 | 1249.39 ± 10.72 | p = 0.2288 |
Results are presented as mean ± STD. Ct.Th = cortical thickness, Ct.Ar/Tt.Ar = cortical area fraction, Iml = moment of inertia in the medio-lateral plane, cTMD = cortical tissue mineral density. Groups represent ten-week-old C57BL/6J male mice fed a low-fat diet (LFD) or a high-fat diet (HFD) for 22 weeks. Statistically significant differences were determined by t-tests (unpaired, two-tailed, α=0.05).
Significant codes: p < 0.05 ‘*’.
3.4. HFD-fed mice did not show changes in inorganic matrix properties
HFD intervention did not cause significant changes in the surface properties from the mineral component of femoral cortical sections (Supplementary Table 1). Carbonate substitutions, the mineral to matrix ratio, and crystallinity remained unchanged between HFD-fed mice and LFD-fed mice.
3.5. Diabetic mice showed an increase in glycation and glycoxidative products
Confocal Raman spectroscopy (Supplementary Table 1) and assay for AGEs were used to measure organic matrix properties of femoral cortical bone sections. HFD-fed mice showed a significant increase in total fAGEs (p = 0.00047, Figure 3A) when compared to LFD-fed mice. Diabetic mice also showed a significant increase in glycoxidative products as determined by the levels of pentosidine (p = 0.00548, Figure 3B) and carboxymethyl-lysine (p = 0.0113, Figure 3C) which were significantly higher in HFD-fed mice when compared to LFD-fed mice. Moreover, diabetic mice showed a reduction in collagen bound water molecules (p = 0.0466, Figure 3D).
Figure 3: Diabetic mice showed an increase in AGEs, and a decrease in bound water.
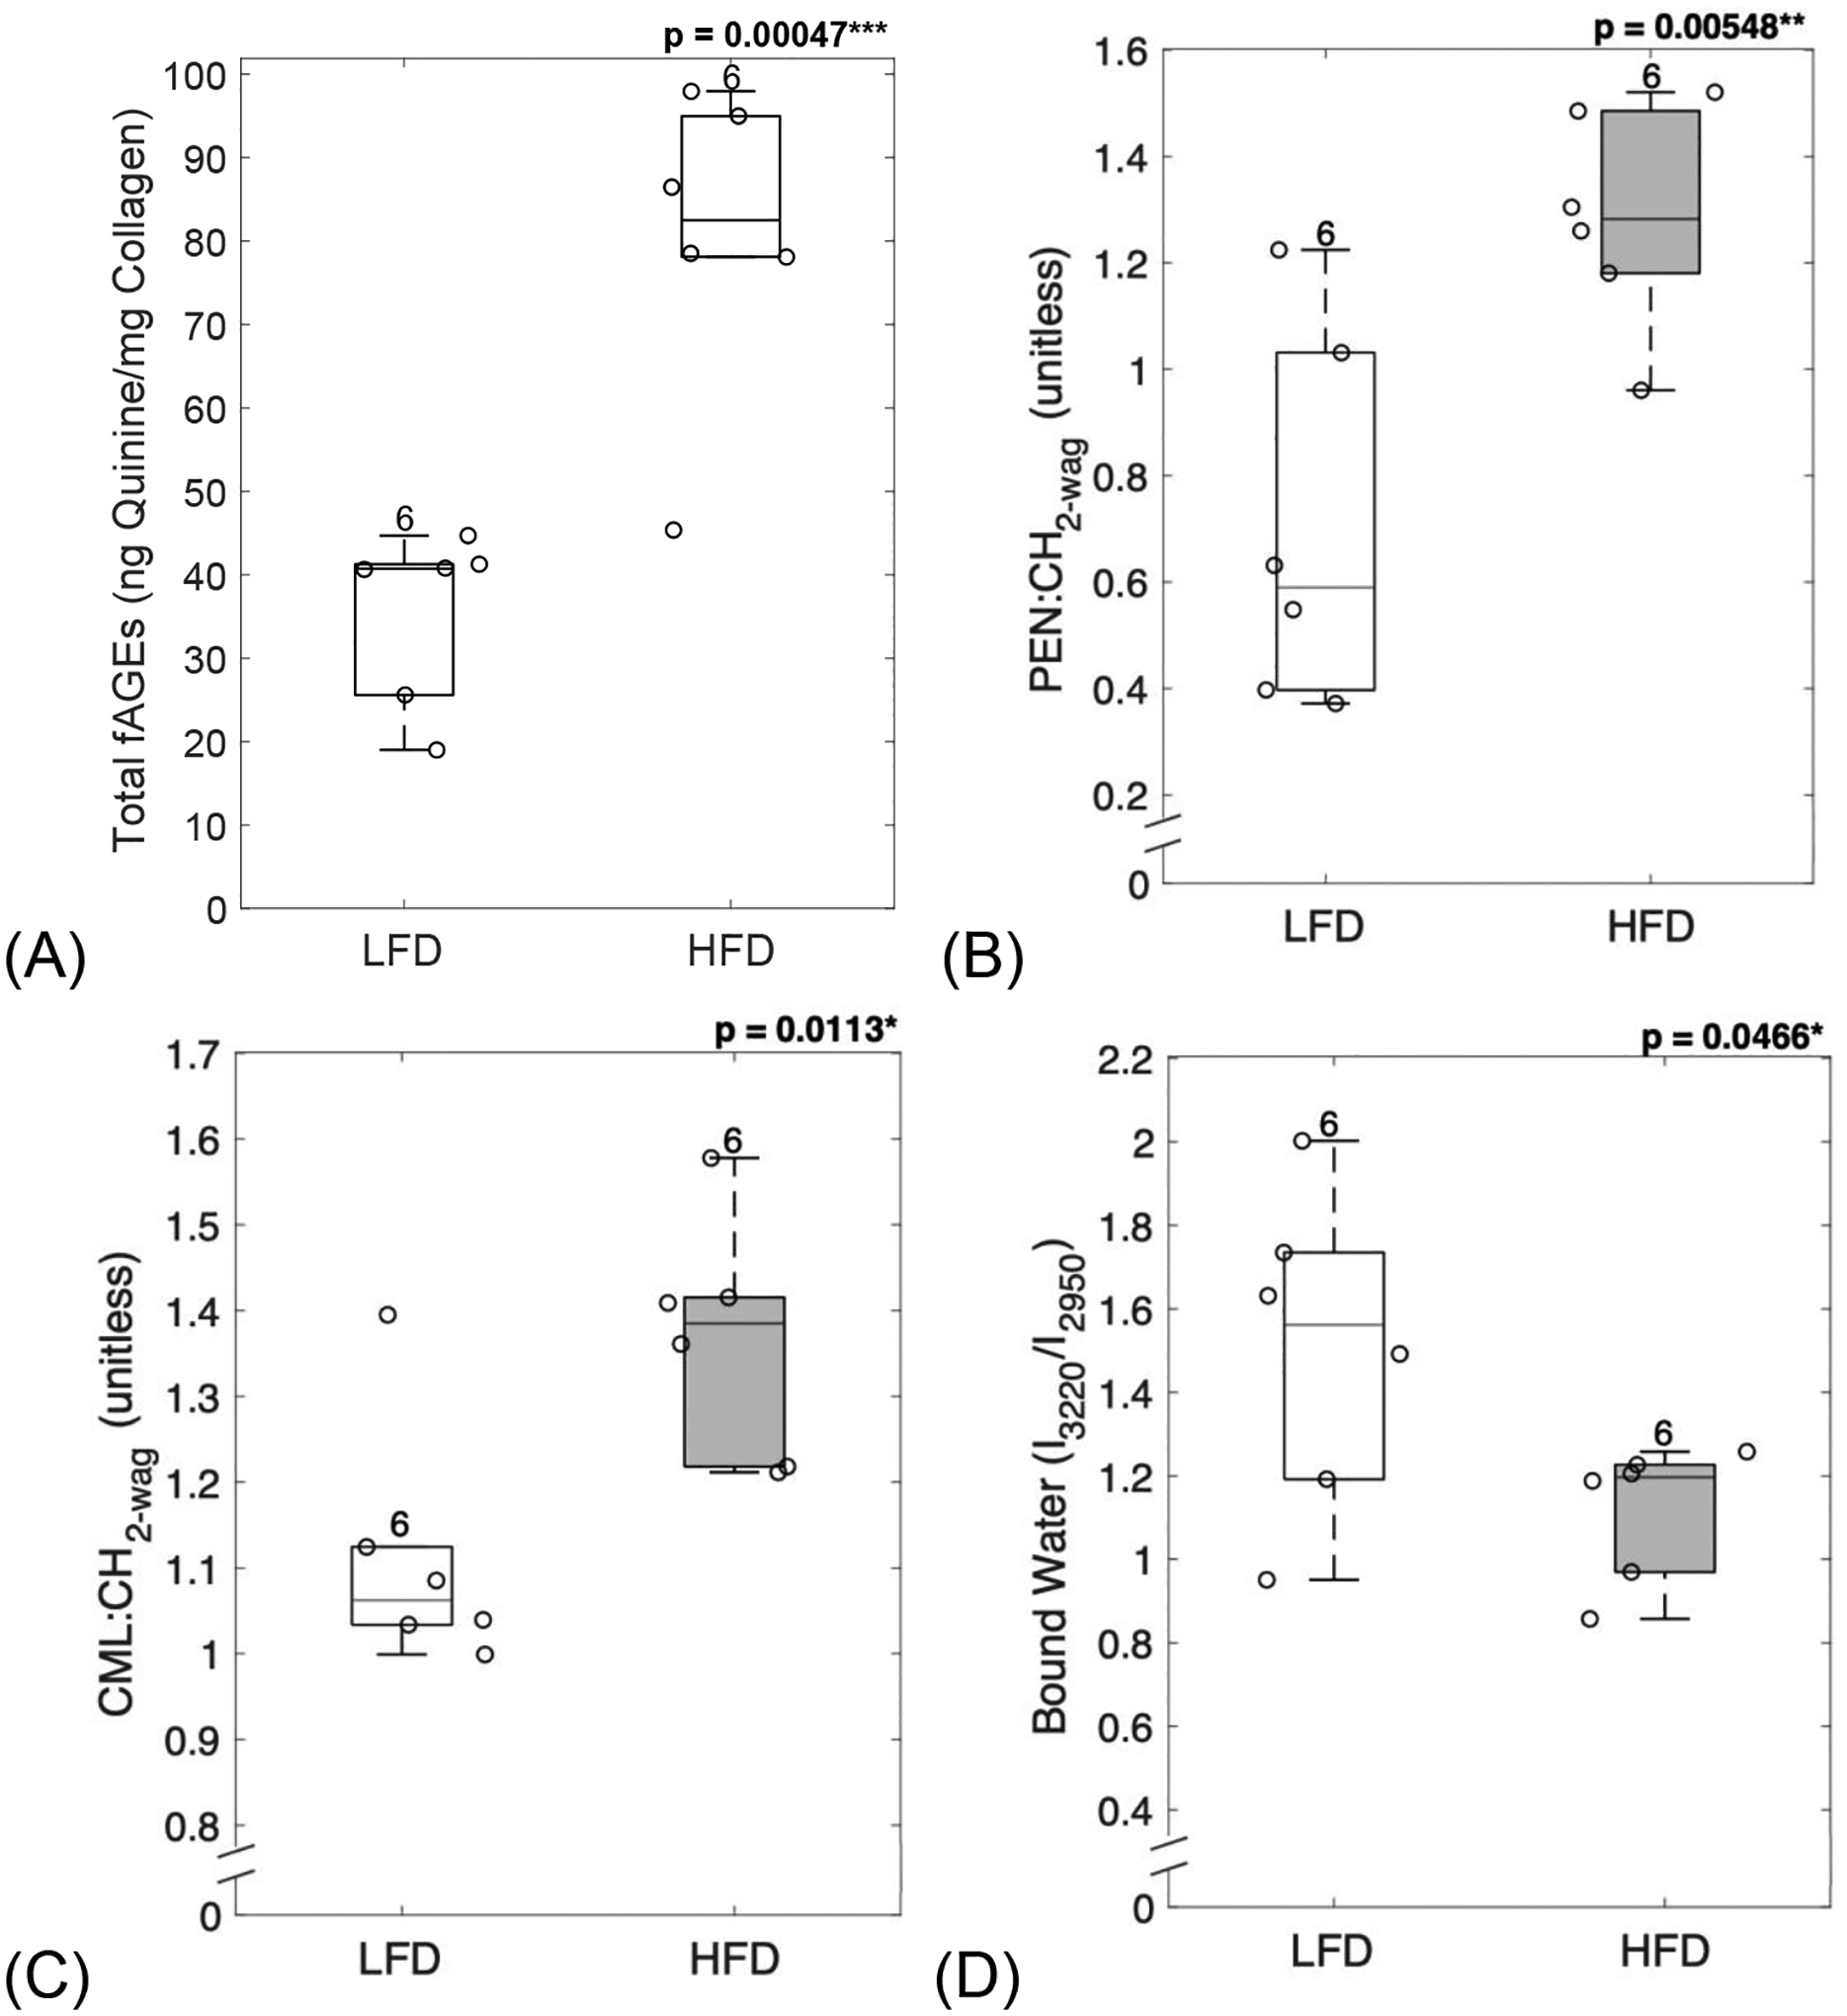
AGEs assay and confocal Raman spectroscopy were used to evaluate organic matrix properties from femoral cortical sections. Diabetic mice showed a significant increase in total fAGEs (A), pentosidine (B) and carboxymethyl-lysine (C), and a significant reduction in collagen bound water (D). LFD = low-fat diet; HFD = high-fat diet, fAGEs = fluorescent advanced glycation end-products. Results are shown as boxplots (with median and interquartile range) showing all data points. Statistically significant differences were determined by t-tests (unpaired, two-tailed, α=0.05). Number on top of each boxplot indicates sample size. Significant codes: p < 0.05 ‘*’, p < 0.01 ‘**’, p < 0.001 ‘***’.
3.6. HFD-induced T2D increased mineral crystal size
XRD was used to evaluate the mineral properties of bone. The FWHM of peak 002 was used to calculate the mean crystal size. HFD-induced T2D led to a significant increase in crystal size (p = 0.0024, Figure 4A). The interplanar spacing, or simply d-spacing, of the mineral crystal lattice was also increased in HFD-fed mice when compared to the LFD group (p = 0.01272, Figure 4B). Taken together, T2D group demonstrated the poorer crystalline lattice (Figure 4C) compared to LFD group.
Figure 4: HFD-induced T2D increased mineral crystal size.
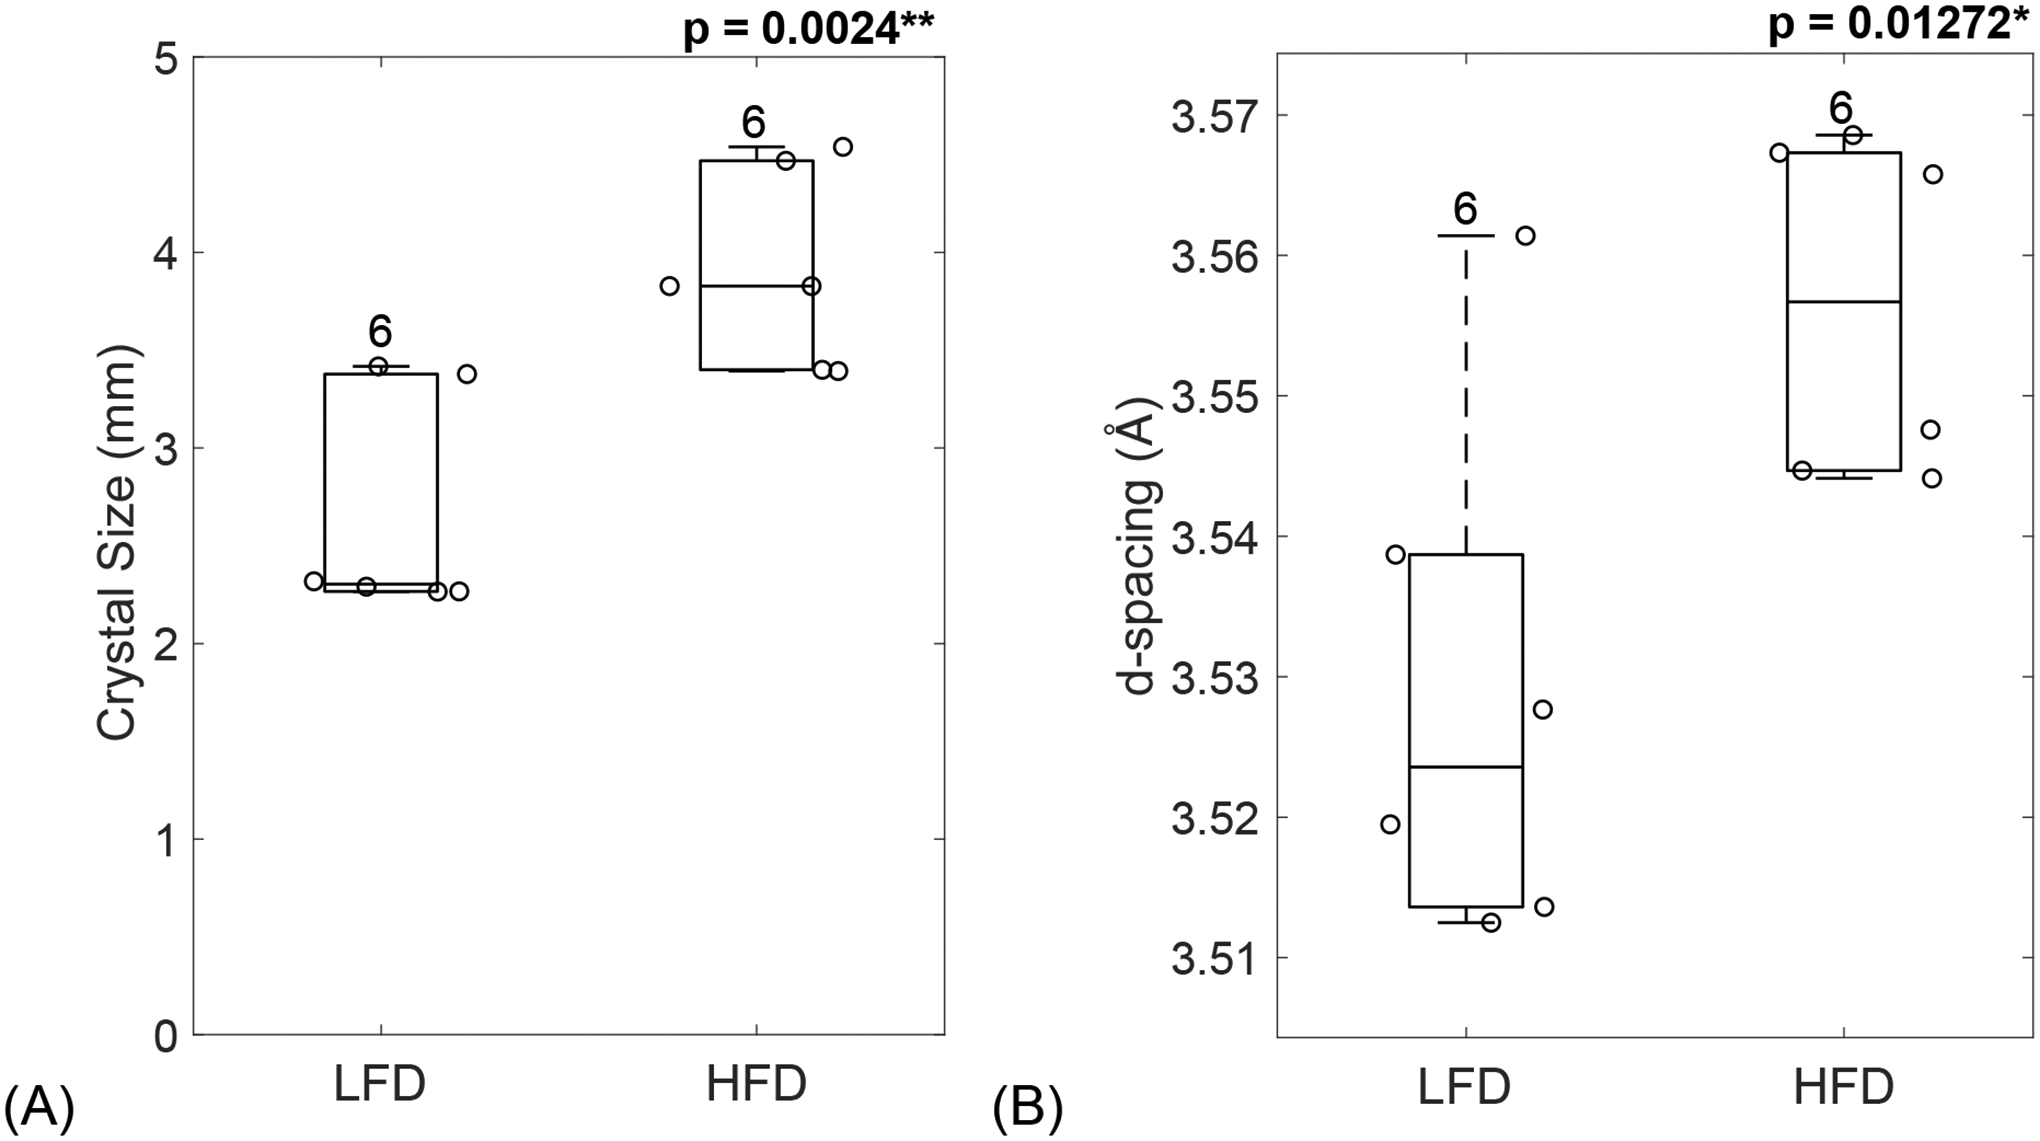
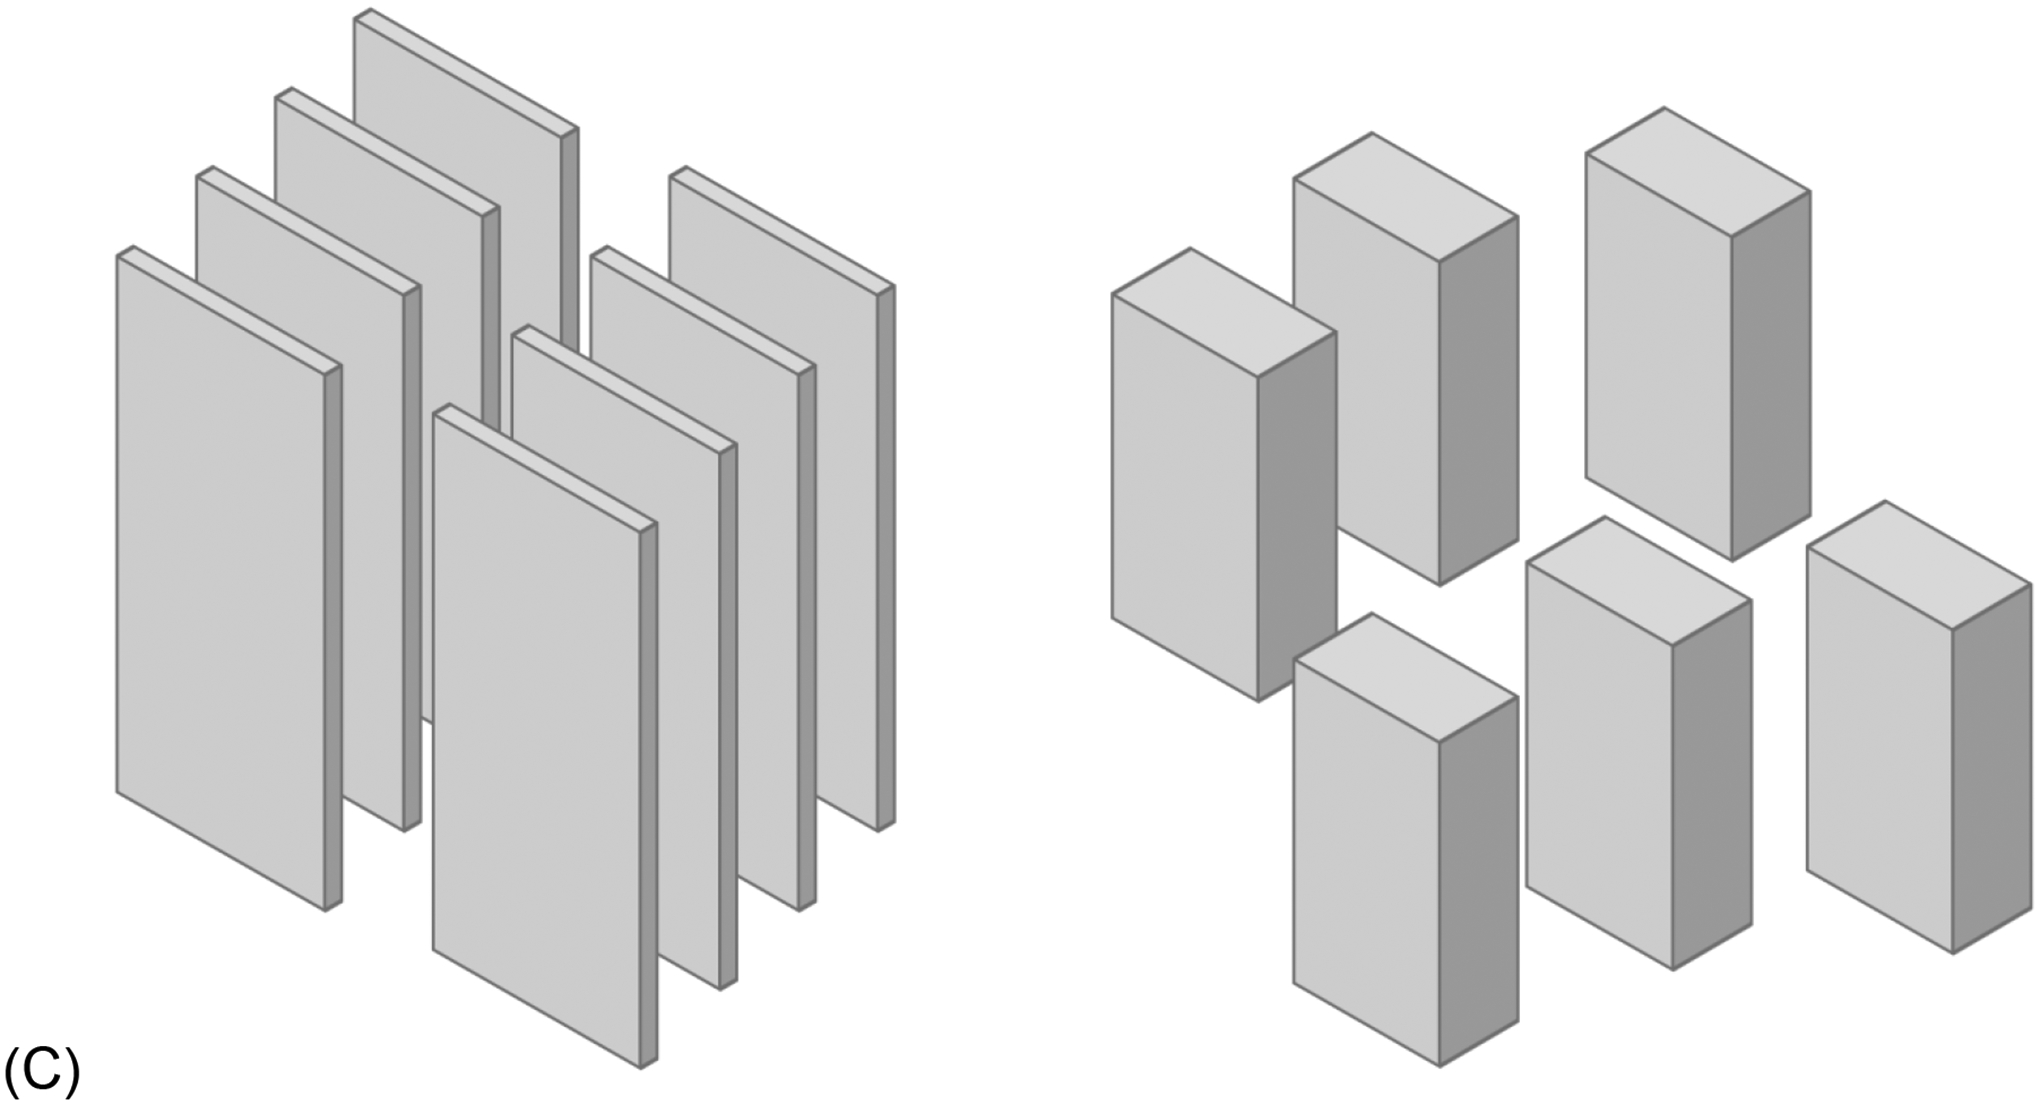
XRD was used to measure the FWHM of peak 002, which was used to calculate the mineral crystal size (A) which was significantly increased in diabetic mice. Peak analysis also revealed an increase in d-spacing for HFD-fed mice compared to the LFD group (B). (C) Schematic of mineral crystal arrangement in LFD (left) and HFD (right). LFD = low-fat diet; HFD = high-fat diet. Results are shown as boxplots (with median and interquartile range) showing all data points. Statistically significant differences were determined by t-tests (unpaired, two-tailed, α=0.05). Number on top of each boxplot indicates sample size. Significant codes: p < 0.05 ‘*’, p < 0.01 ‘**’, p < 0.001 ‘***’.
3.7. Loss of bone toughness in diabetic mice
Fracture toughness from three-point bending testing on femora showed loss of toughness in diabetic mice. Initiation toughness (p = 4.81e-05, Figure 5A) was significantly lower for diabetic mice compared to LFD-fed mice. Maximum toughness (p = 0.00081, Figure 5B) was also significantly lower for diabetic mice compared to LFD-fed mice. Interestingly, the increase seen in d-spacing correlated with a decrease in initiation toughness (R = −0.62, p = 0.032, Figure 6A). Moreover, the increased in mineral crystal size negatively correlated with a loss of maximum toughness (R = −0.64, p = 0.025, Figure 6B).
Figure 5: Loss of bone toughness in diabetic mice.
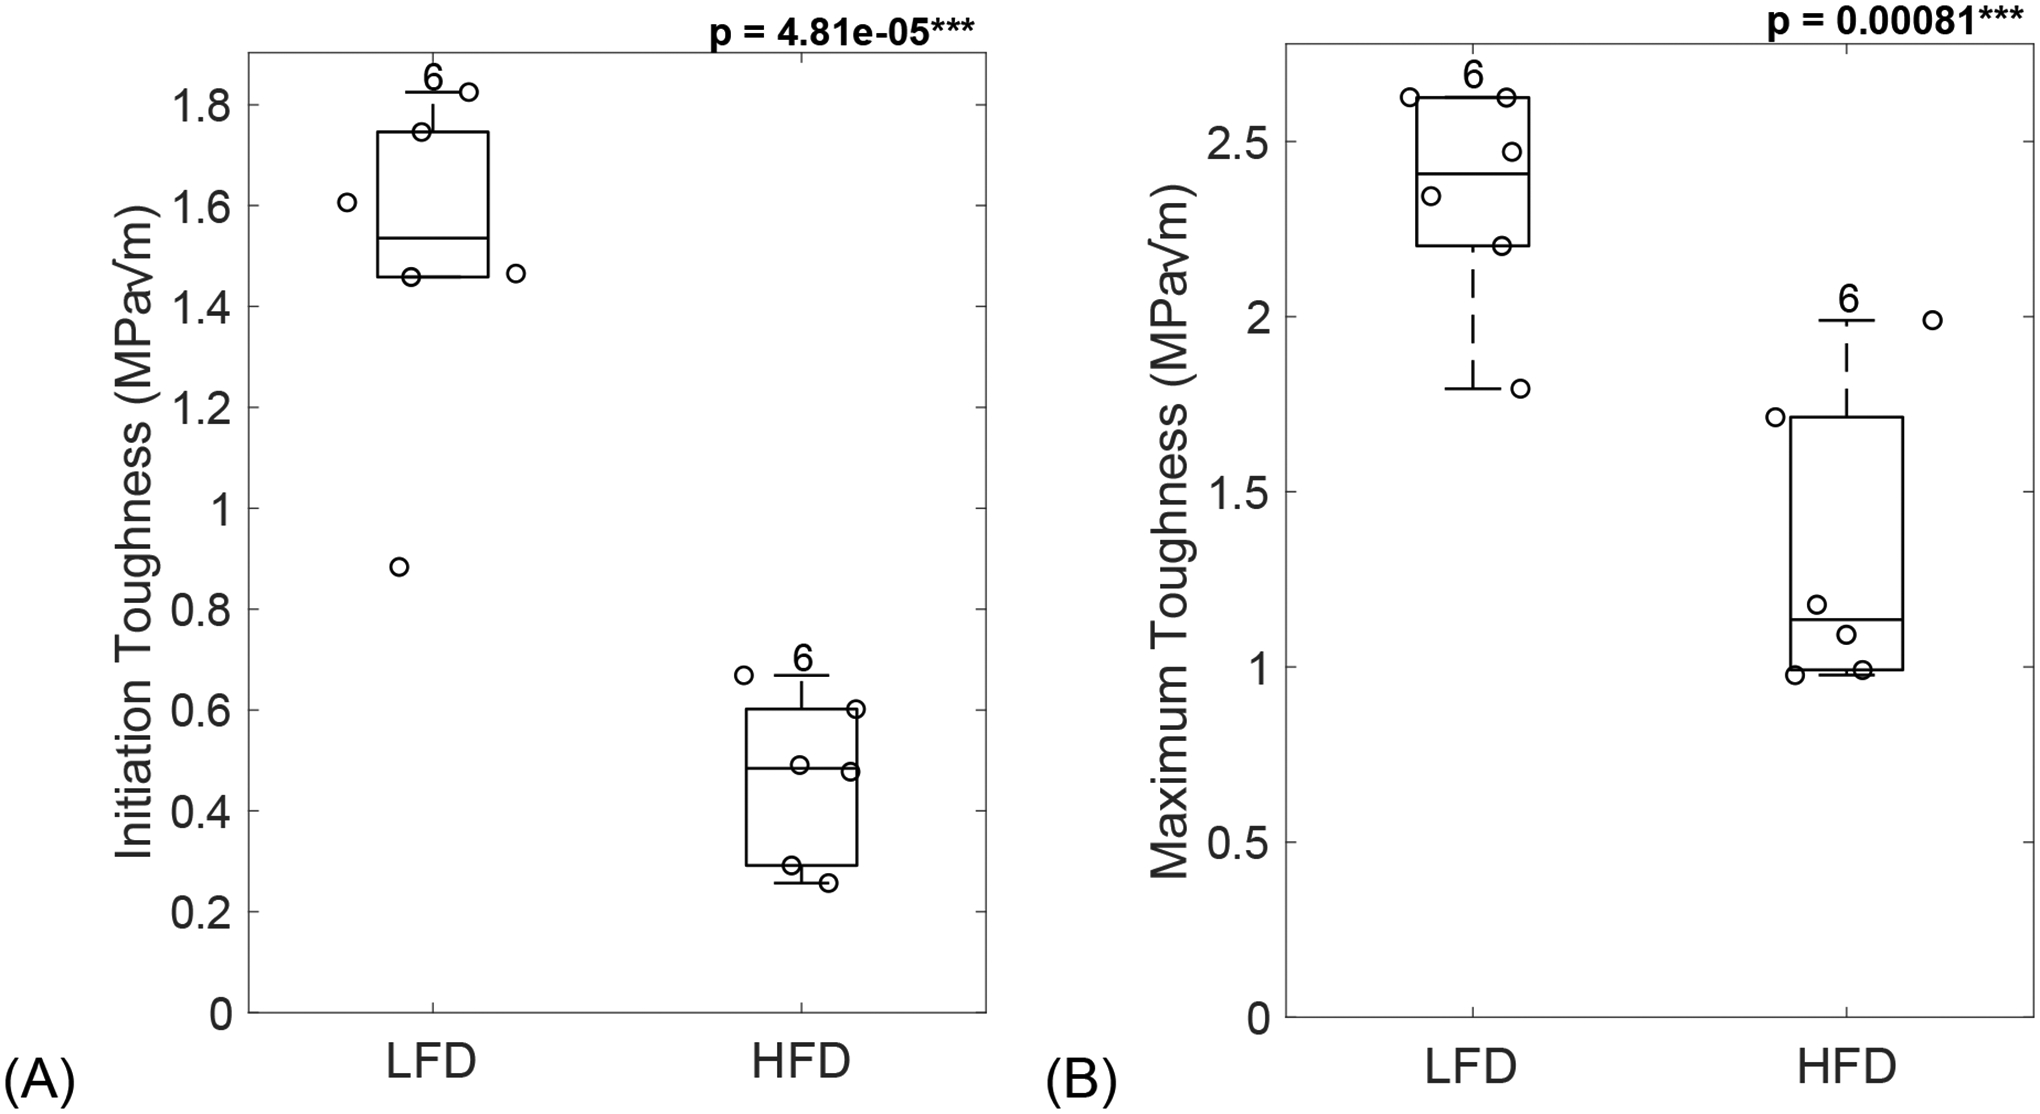
Diabetic mice showed loss of bone toughness, seen by a significant decrease in initiation toughness (A) and maximum toughness (B). LFD = low-fat diet; HFD = high-fat diet. Results are shown as boxplots (with median and interquartile range) showing all data points. Statistically significant differences were determined by t-tests (unpaired, two-tailed, α=0.05). Number on top of each boxplot indicates sample size. Significant codes: p < 0.001 ‘***’.
Figure 6: Loss of bone toughness in diabetic mice could be explained by mineral changes.
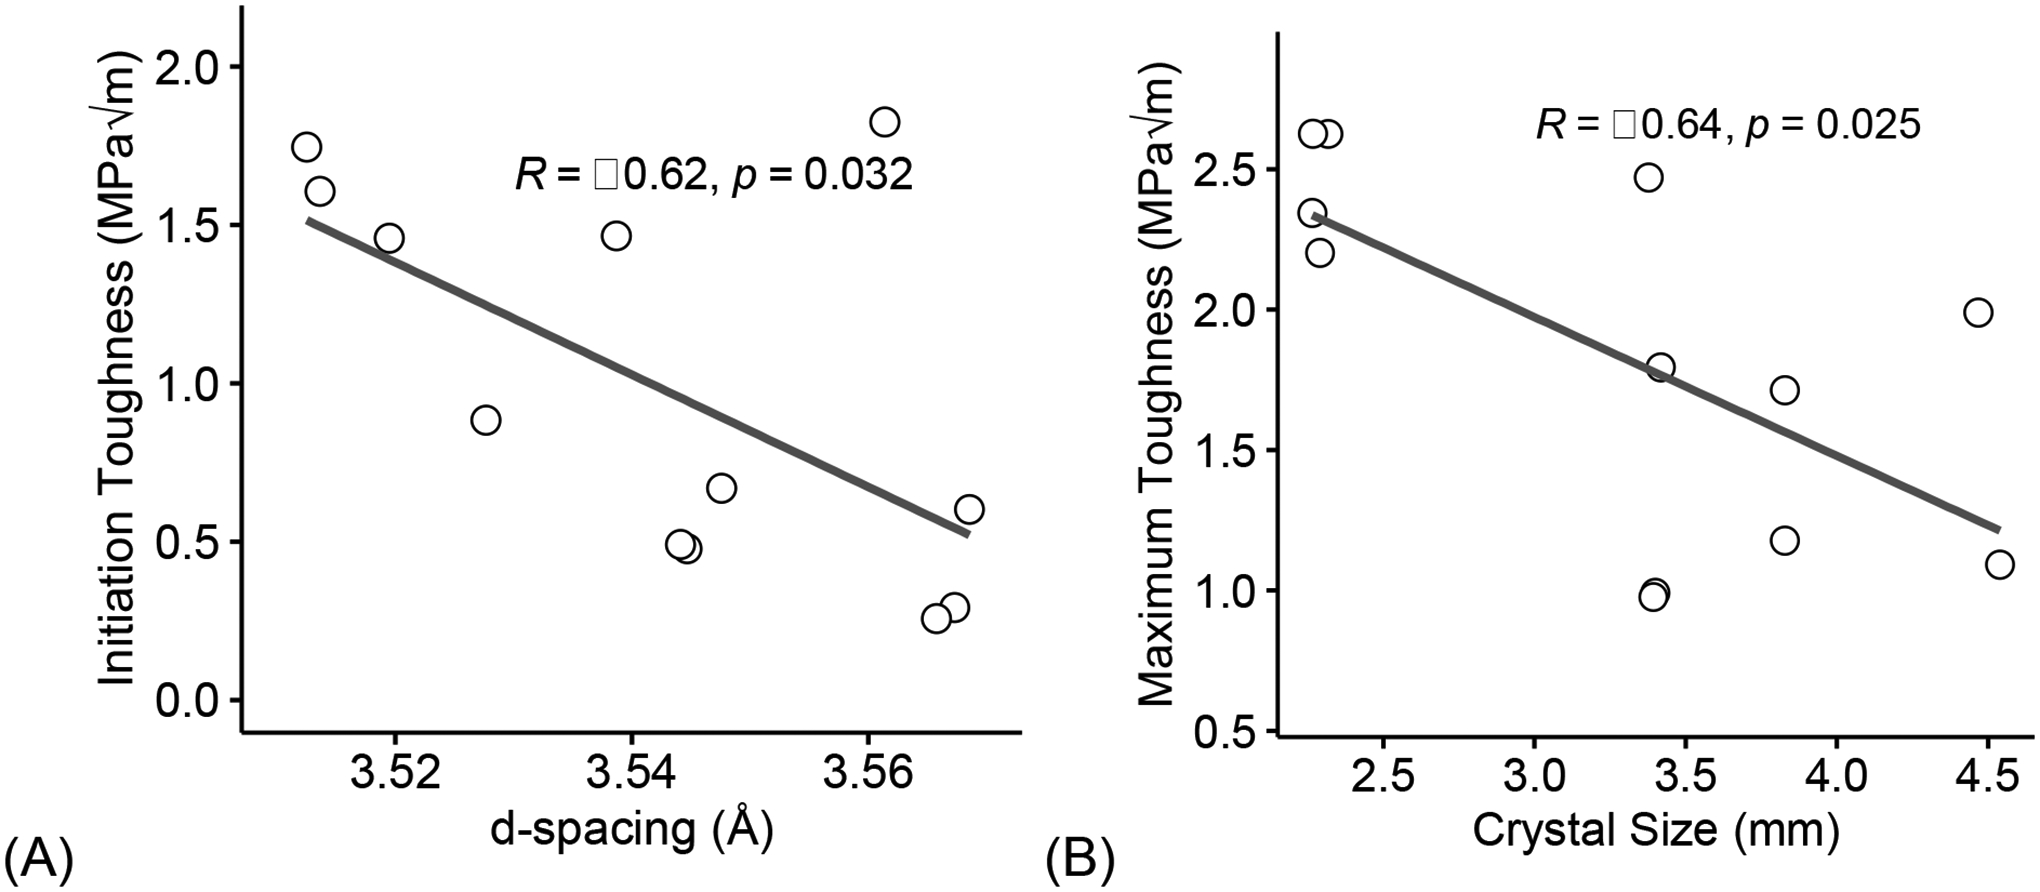
Increase in interfibrillar space, determined from XRD diffractions, correlated with a decrease in initiation toughness (A). Larger mineral crystal size negatively correlated with a loss of maximum toughness (B). Coefficient of correlation determined by Pearson’s R test (α=0.05). Significant codes: p < 0.05 ‘*’, p < 0.01 ‘**’, p < 0.001 ‘***’.
3.8. Hyperglycemia associates with increase of glycation products which negatively correlate to loss in toughness
Pearson’ R correlation (Figure 5) were used to evaluate the impact of increase in blood glucose with different AGEs, and in turn, their effect on bone toughness. Increase in blood glucose significantly correlated with accumulation of fAGEs (R = 0.68, p = 0.014, Figure 7A), CML (R = 0.72, p = 0.0078, Figure 7B), and PEN (R = 0.76, p = 0.0042, Figure 7C).
Figure 7: Hyperglycemia associates with increase of glycation products.
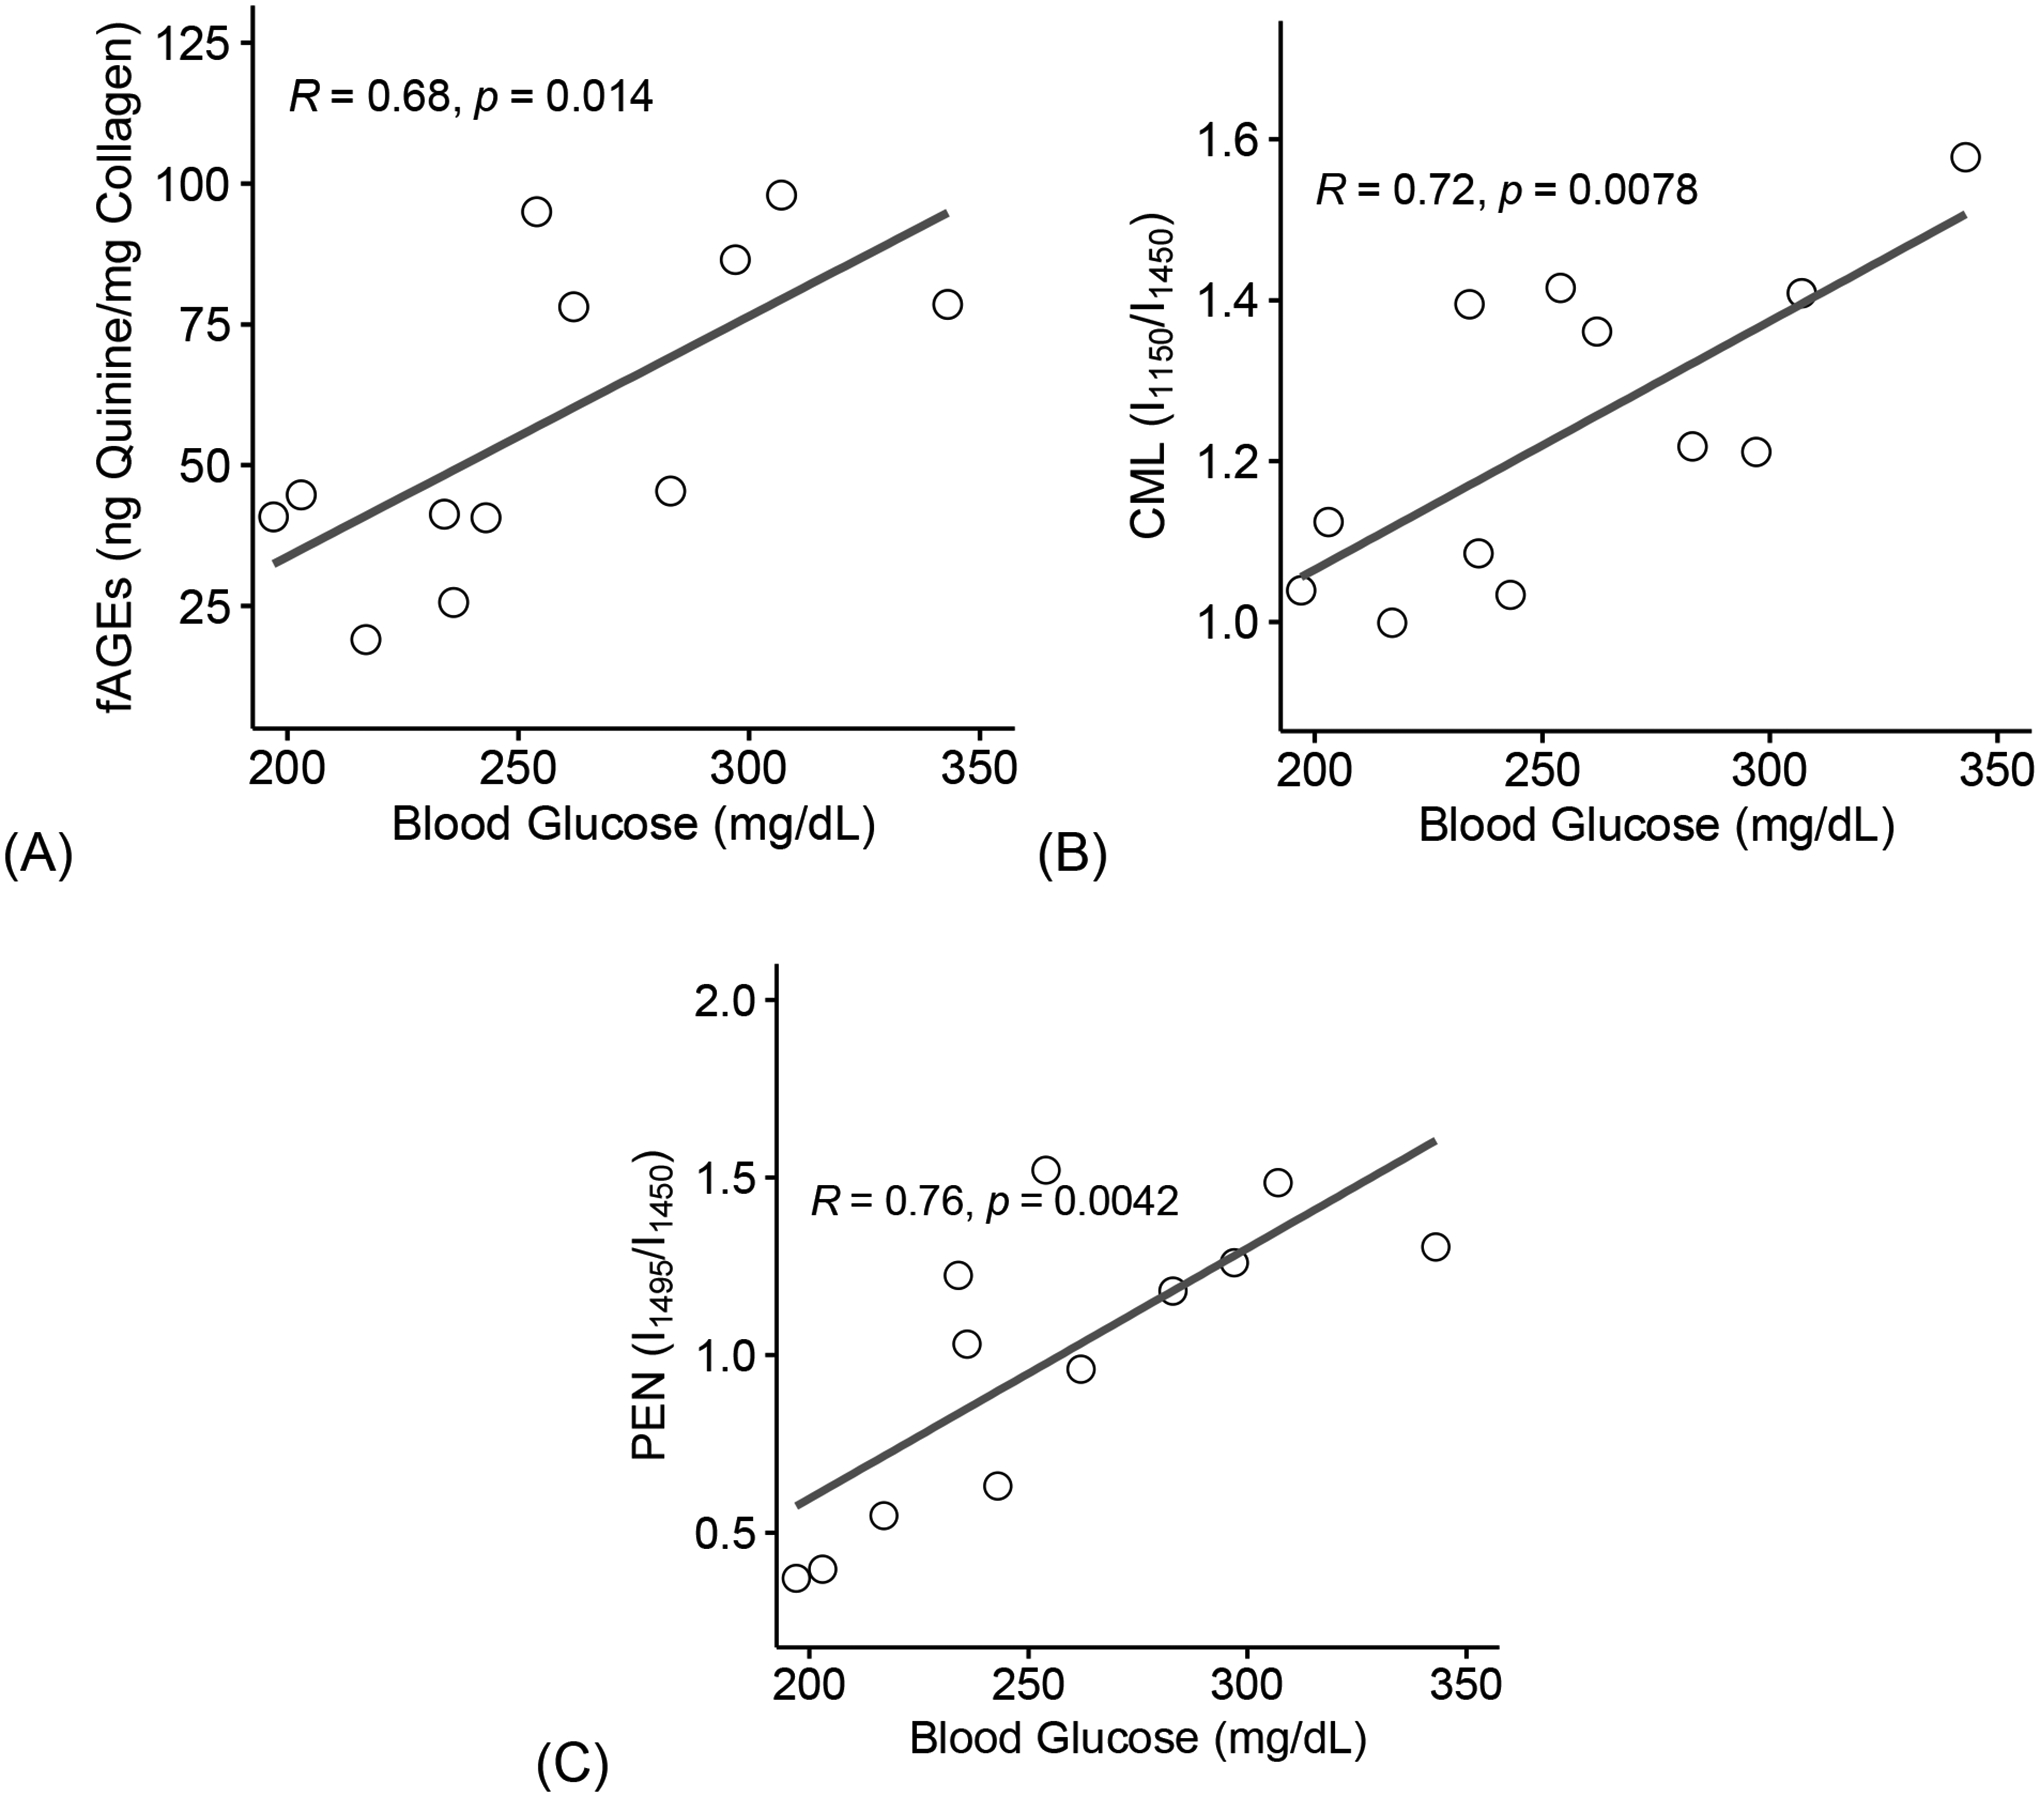
Increase in blood glucose levels correlated with an increase in fAGEs (A), CML (B), and PEN (C). fAGEs = fluorescent advanced glycation end-products; CML = carboxymethyl-lysine; PEN= pentosidine. Coefficient of correlation determined by Pearson’s R test (α=0.05). Significant codes: p < 0.05 ‘*’, p < 0.01 ‘**’, p < 0.001 ‘***’.
Furthermore, loss of initiation toughness negatively correlated with an increase in fAGEs (R = −0.80, p = 0.0017, Figure 8A), CML (R = −0.71, p = 0.01, Figure 8B), and PEN (R = −0.73, p = 0.0068, Figure 8C).
Figure 8: Increase of glycation products negatively correlate to loss in toughness.
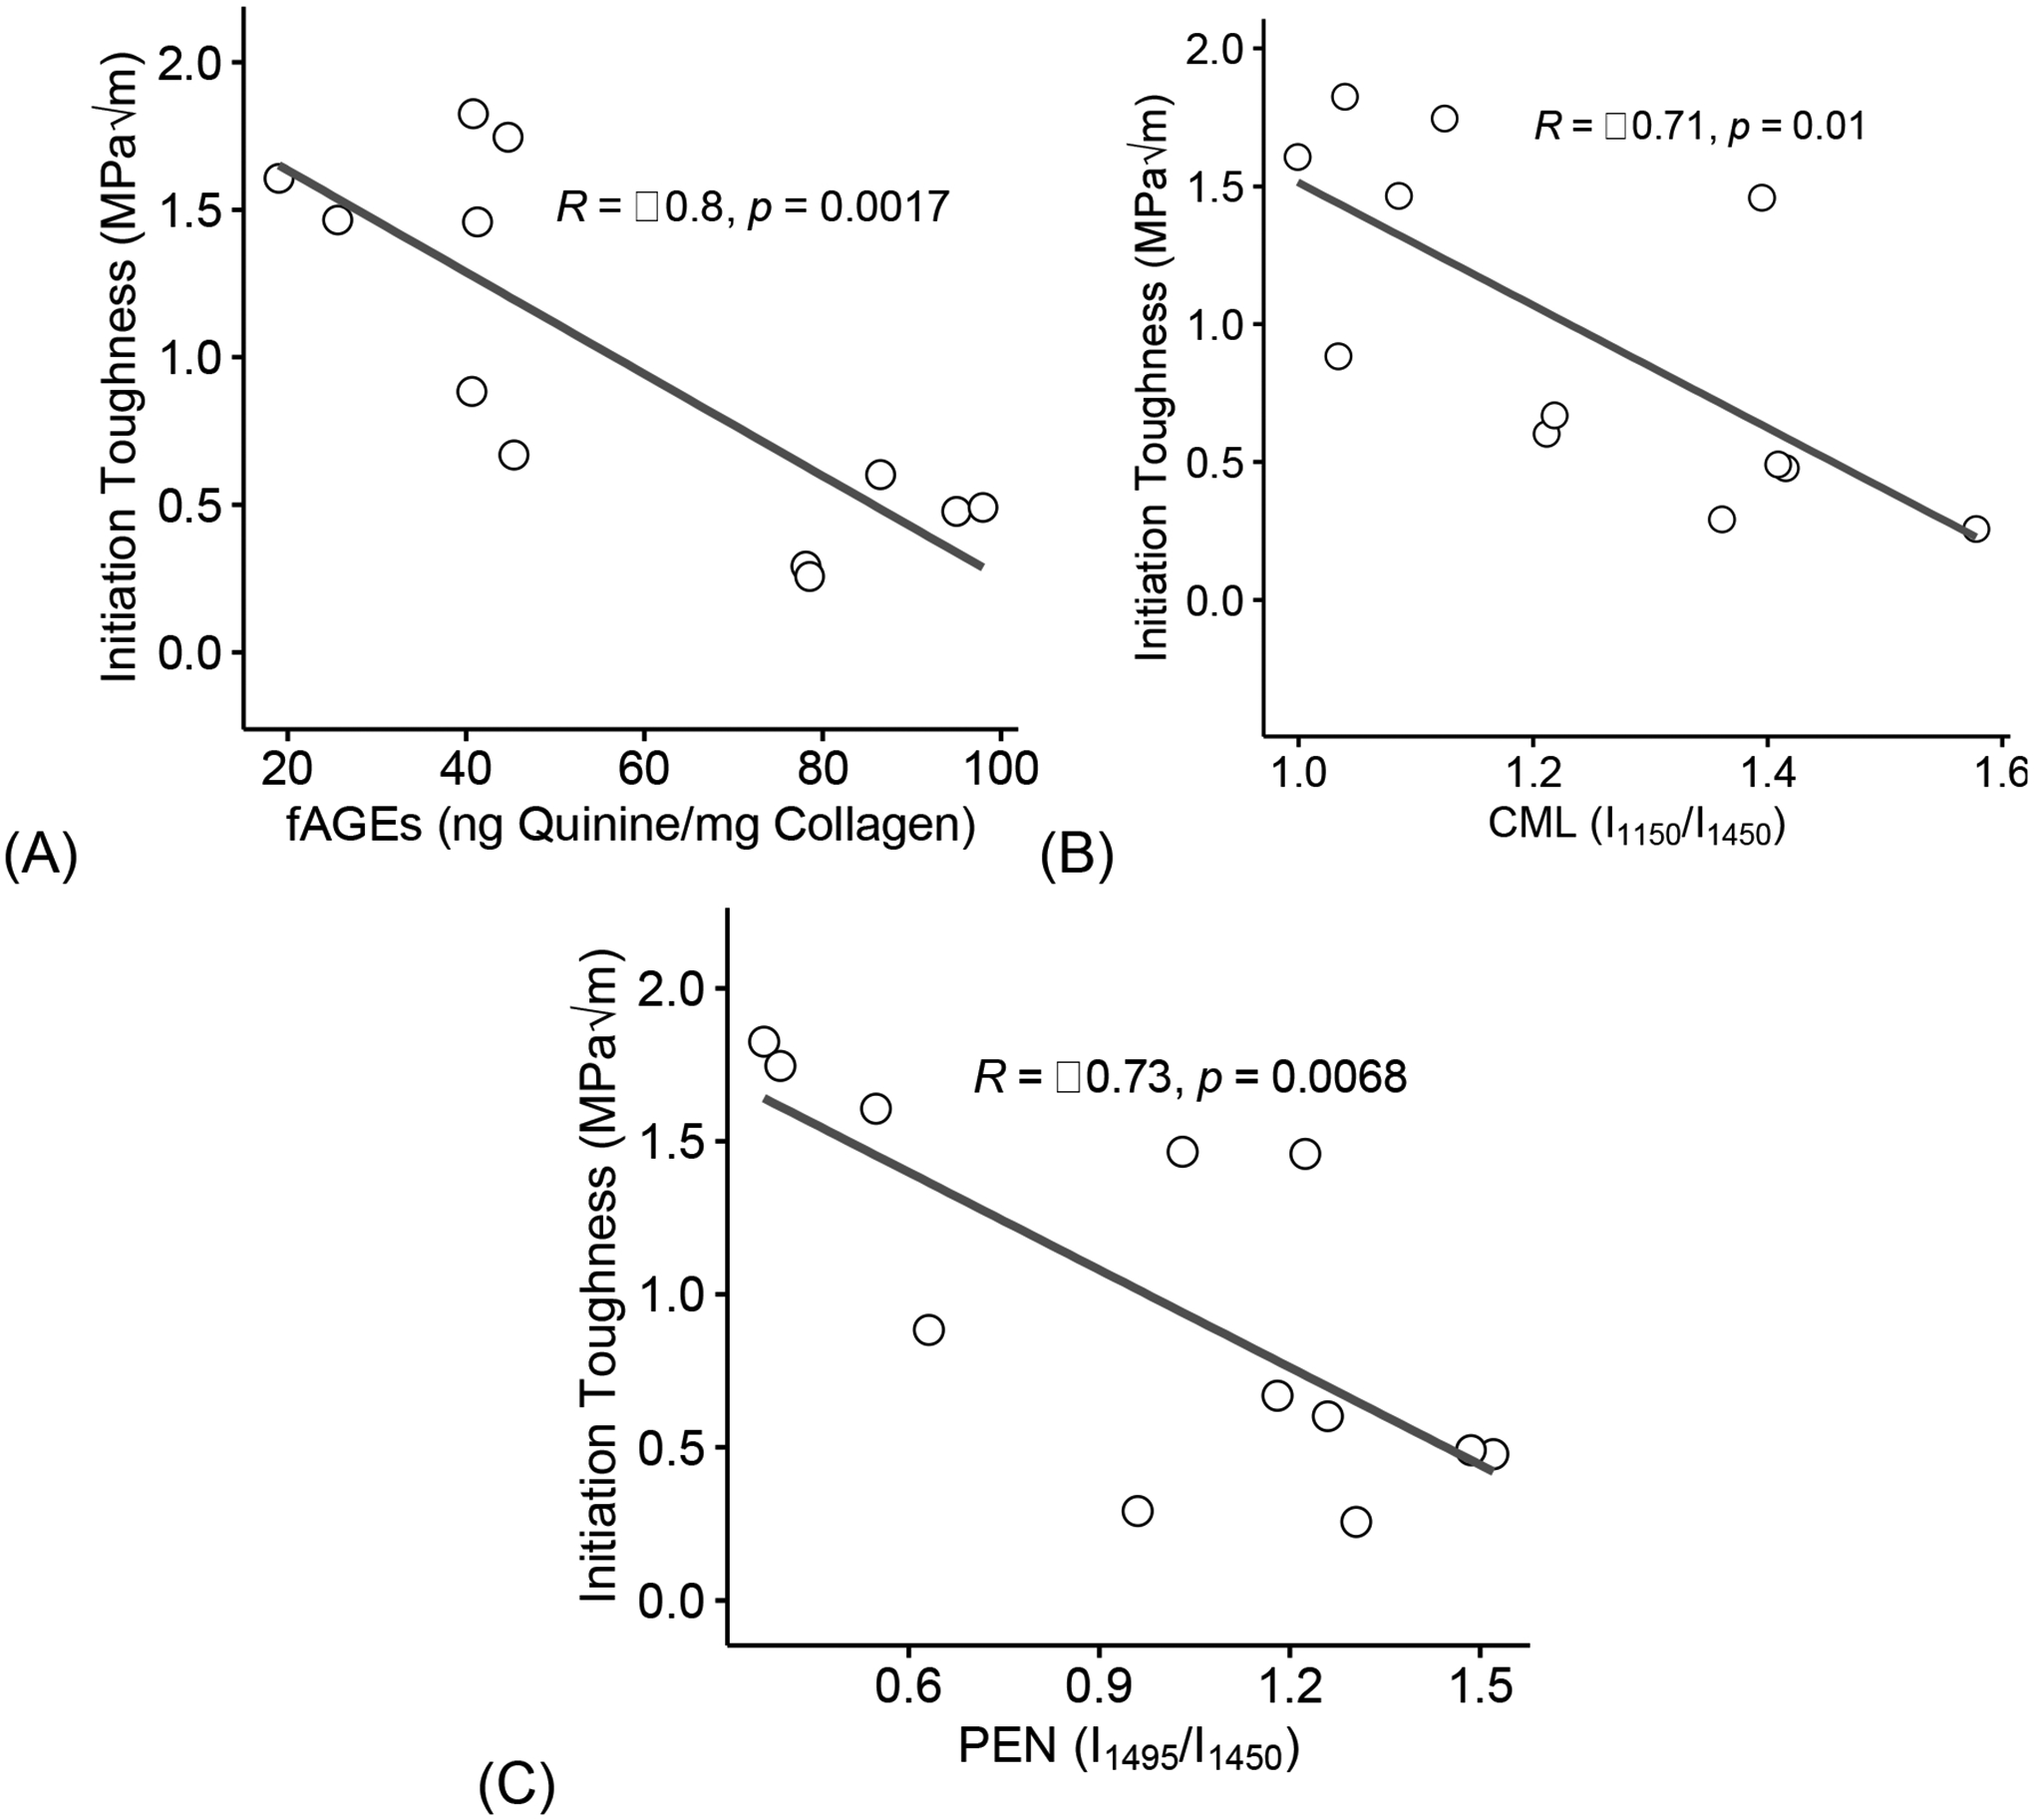
Increase in fAGEs (A), CML (B), and PEN (C) correlated with loss of initiation toughness. fAGEs = fluorescent advanced glycation end-products; CML = carboxymethyl-lysine; PEN= pentosidine. Coefficient of correlation determined by Pearson’s R test (α=0.05). Significant codes: p < 0.05 ‘*’, p < 0.01 ‘**’, p < 0.001 ‘***’.
Finally, loss of maximum toughness negatively correlated with an increase in fAGEs (R = −0.84, p = 0.00057, Figure 9A), CML (R = −0.61, p = 0.034, Figure 9B), and PEN (R = −0.53, p = 0.074, Figure 9C).
Figure 9: Increase of glycation products negatively correlate to loss in toughness.
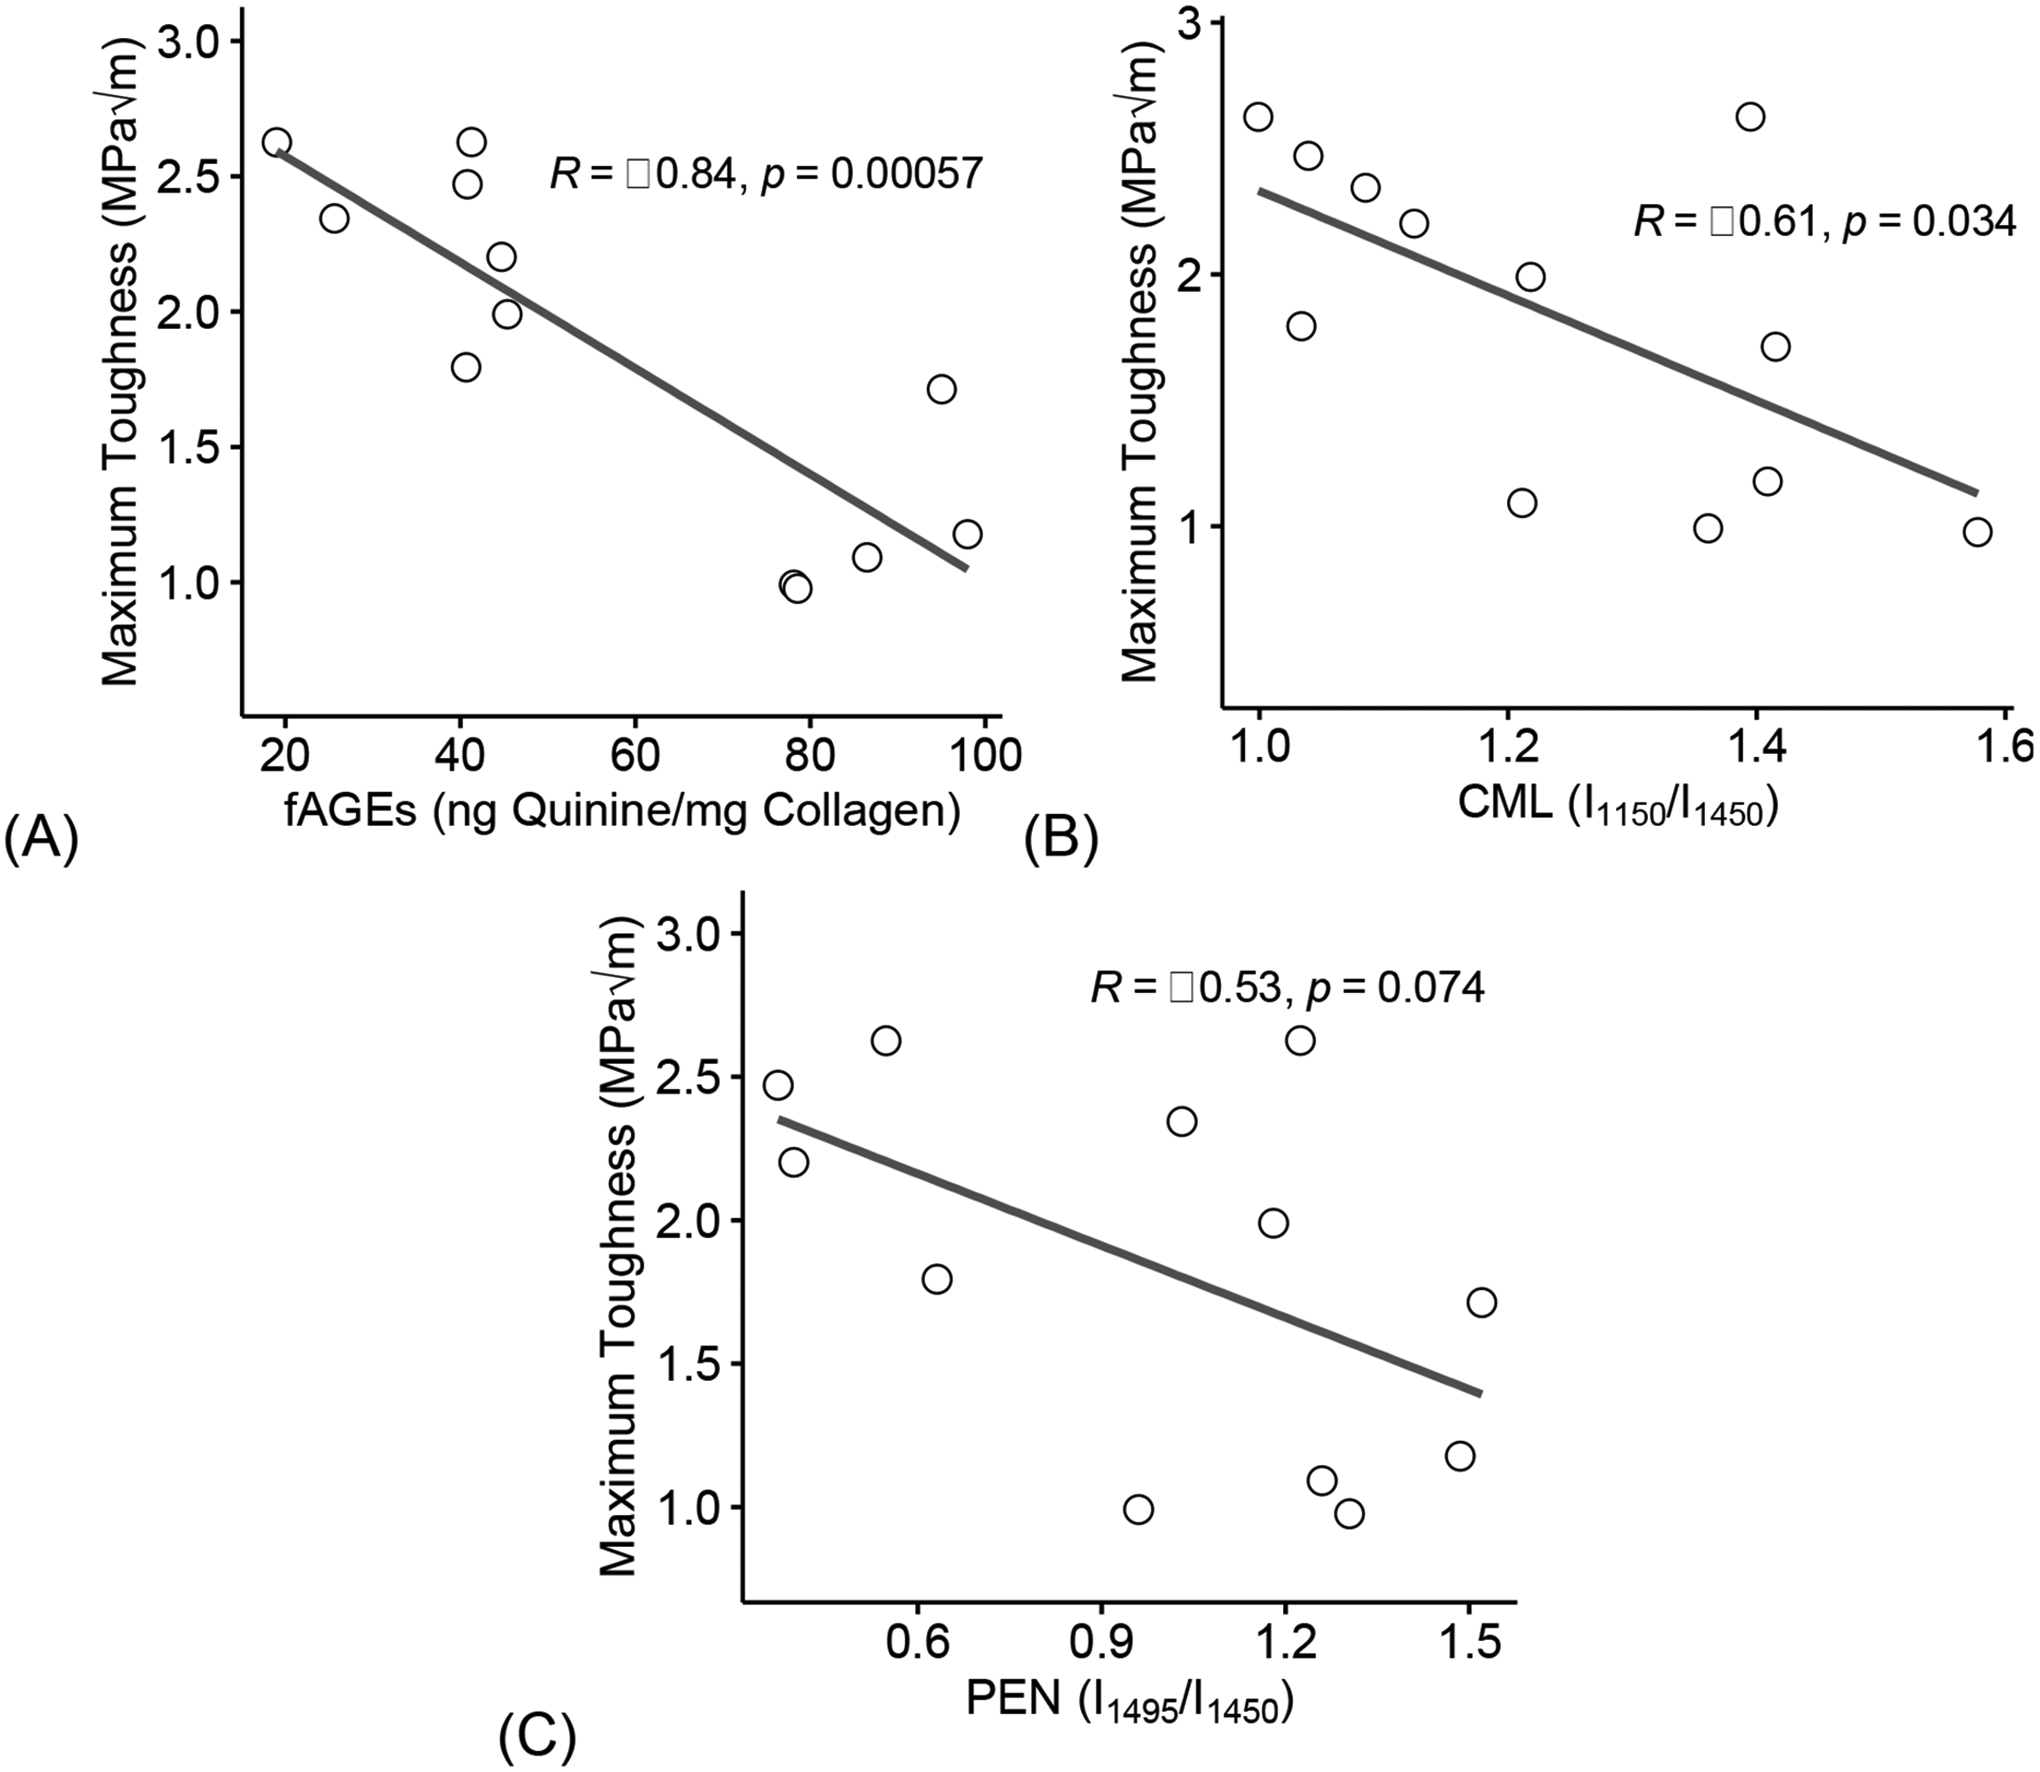
Increase in fAGEs (A), CML (B), and PEN (C) correlated with loss of maximum toughness. fAGEs = fluorescent advanced glycation end-products; CML = carboxymethyl-lysine; PEN= pentosidine. Coefficient of correlation determined by Pearson’s R test (α=0.05). Significant codes: p < 0.05 ‘*’, p < 0.01 ‘**’, p < 0.001 ‘***’.
Multivariate stepwise linear regression was used to determine the most significant predictor of fracture properties by using a model that included all statistically significant variables. Within the diabetic group, CML was the most significant predictor of initiation toughness (p-value = 0.00369) on a model that included all three predictors of AGEs (Multiple R-squared = 0.995, Adjusted R-squared = 0.9876, F-statistic = 133.4). Meanwhile, PEN predicted maximum toughness (p-value = 0.0564) on a model that included all three predictors of AGEs (Multiple R-squared = 0.995, Adjusted R-squared = 0.9749, F-statistic = 49.48). Within the LFD group, no variable significantly predicted initiation or maximum toughness.
3.9. In vitro PTC treatment did not affect surface level bone matrix properties.
After in vitro PTC treatment, surface level bone matrix properties were evaluated with confocal Raman spectroscopy (N = 6/group) and AGEs assay (N = 6/group) (Table 2). Pre- and post- treatment properties were compared to determine the effect of PTC treatment. There were no significant differences in mineral to matrix ratio, carbonate substitution or in CML and PEN content between the control and in vitro PTC treated HFD samples. In contrast, in vitro PTC treatment of HFD samples decreased fAGEs, by 41.2% (p = 2.464e-04, Figure 10) compared to saline-treated HFD samples.
Table 2.
Confocal Raman Spectroscopy after in vitro PTC treatment.
| HFD-CTR | HFD-PTC | p-value | |
|---|---|---|---|
| (n = 6) | (n = 6) | ||
| Carbonate Substitutions (ν1CO3/ν1PO4) | 0.881 ± 0.045 | 0.932 ± 0.064 | 0.2246 |
| Mineral:Matrix Ratio (ν1PO4/Amide I) | 0.971 ± 0.057 | 1.032 ± 0.152 | 0.4732 |
| Mineral:Matrix Ratio (ν2PO4/Amide III) | 0.948 ± 0.105 | 0.966 ± 0.049 | 0.6796 |
| Crystallinity (1/ν1PO4) | 0.095 ± 0.004 | 0.097 ± 0.006 | 0.4836 |
| CML:CH2-wag (unitless) | 1.316 ± 0.227 | 1.240 ± 0.089 | 0.4113 |
| PEN:CH2-wag (unitless) | 1.285 ± 0.206 | 1.309 ± 0.089 | 0.7662 |
| Bound Water (I3220/I2949) | 0.390 ± 0.073 | 0.438 ± 0.161 | 0.3528 |
Data are presented as mean ± STD. CML = carboxymethyl-lysine; PEN = pentosidine; CH2 = methylene; PO4 = phosphate; CO3 = carbonate; ν1, ν2 = band mode; fAGEs = fluorescent advanced glycation end-products. Groups represent in vitro treatment with saline (HFD-CTR) or phenacyl thiazolium chloride (HFD-PTC) to femora from ten-week-old C57BL/6J male mice fed a high-fat diet (HFD) for 22 weeks, assessed by paired t-test (two tailed, α = 0.05).
Figure 10: Removal of glycation end-products.
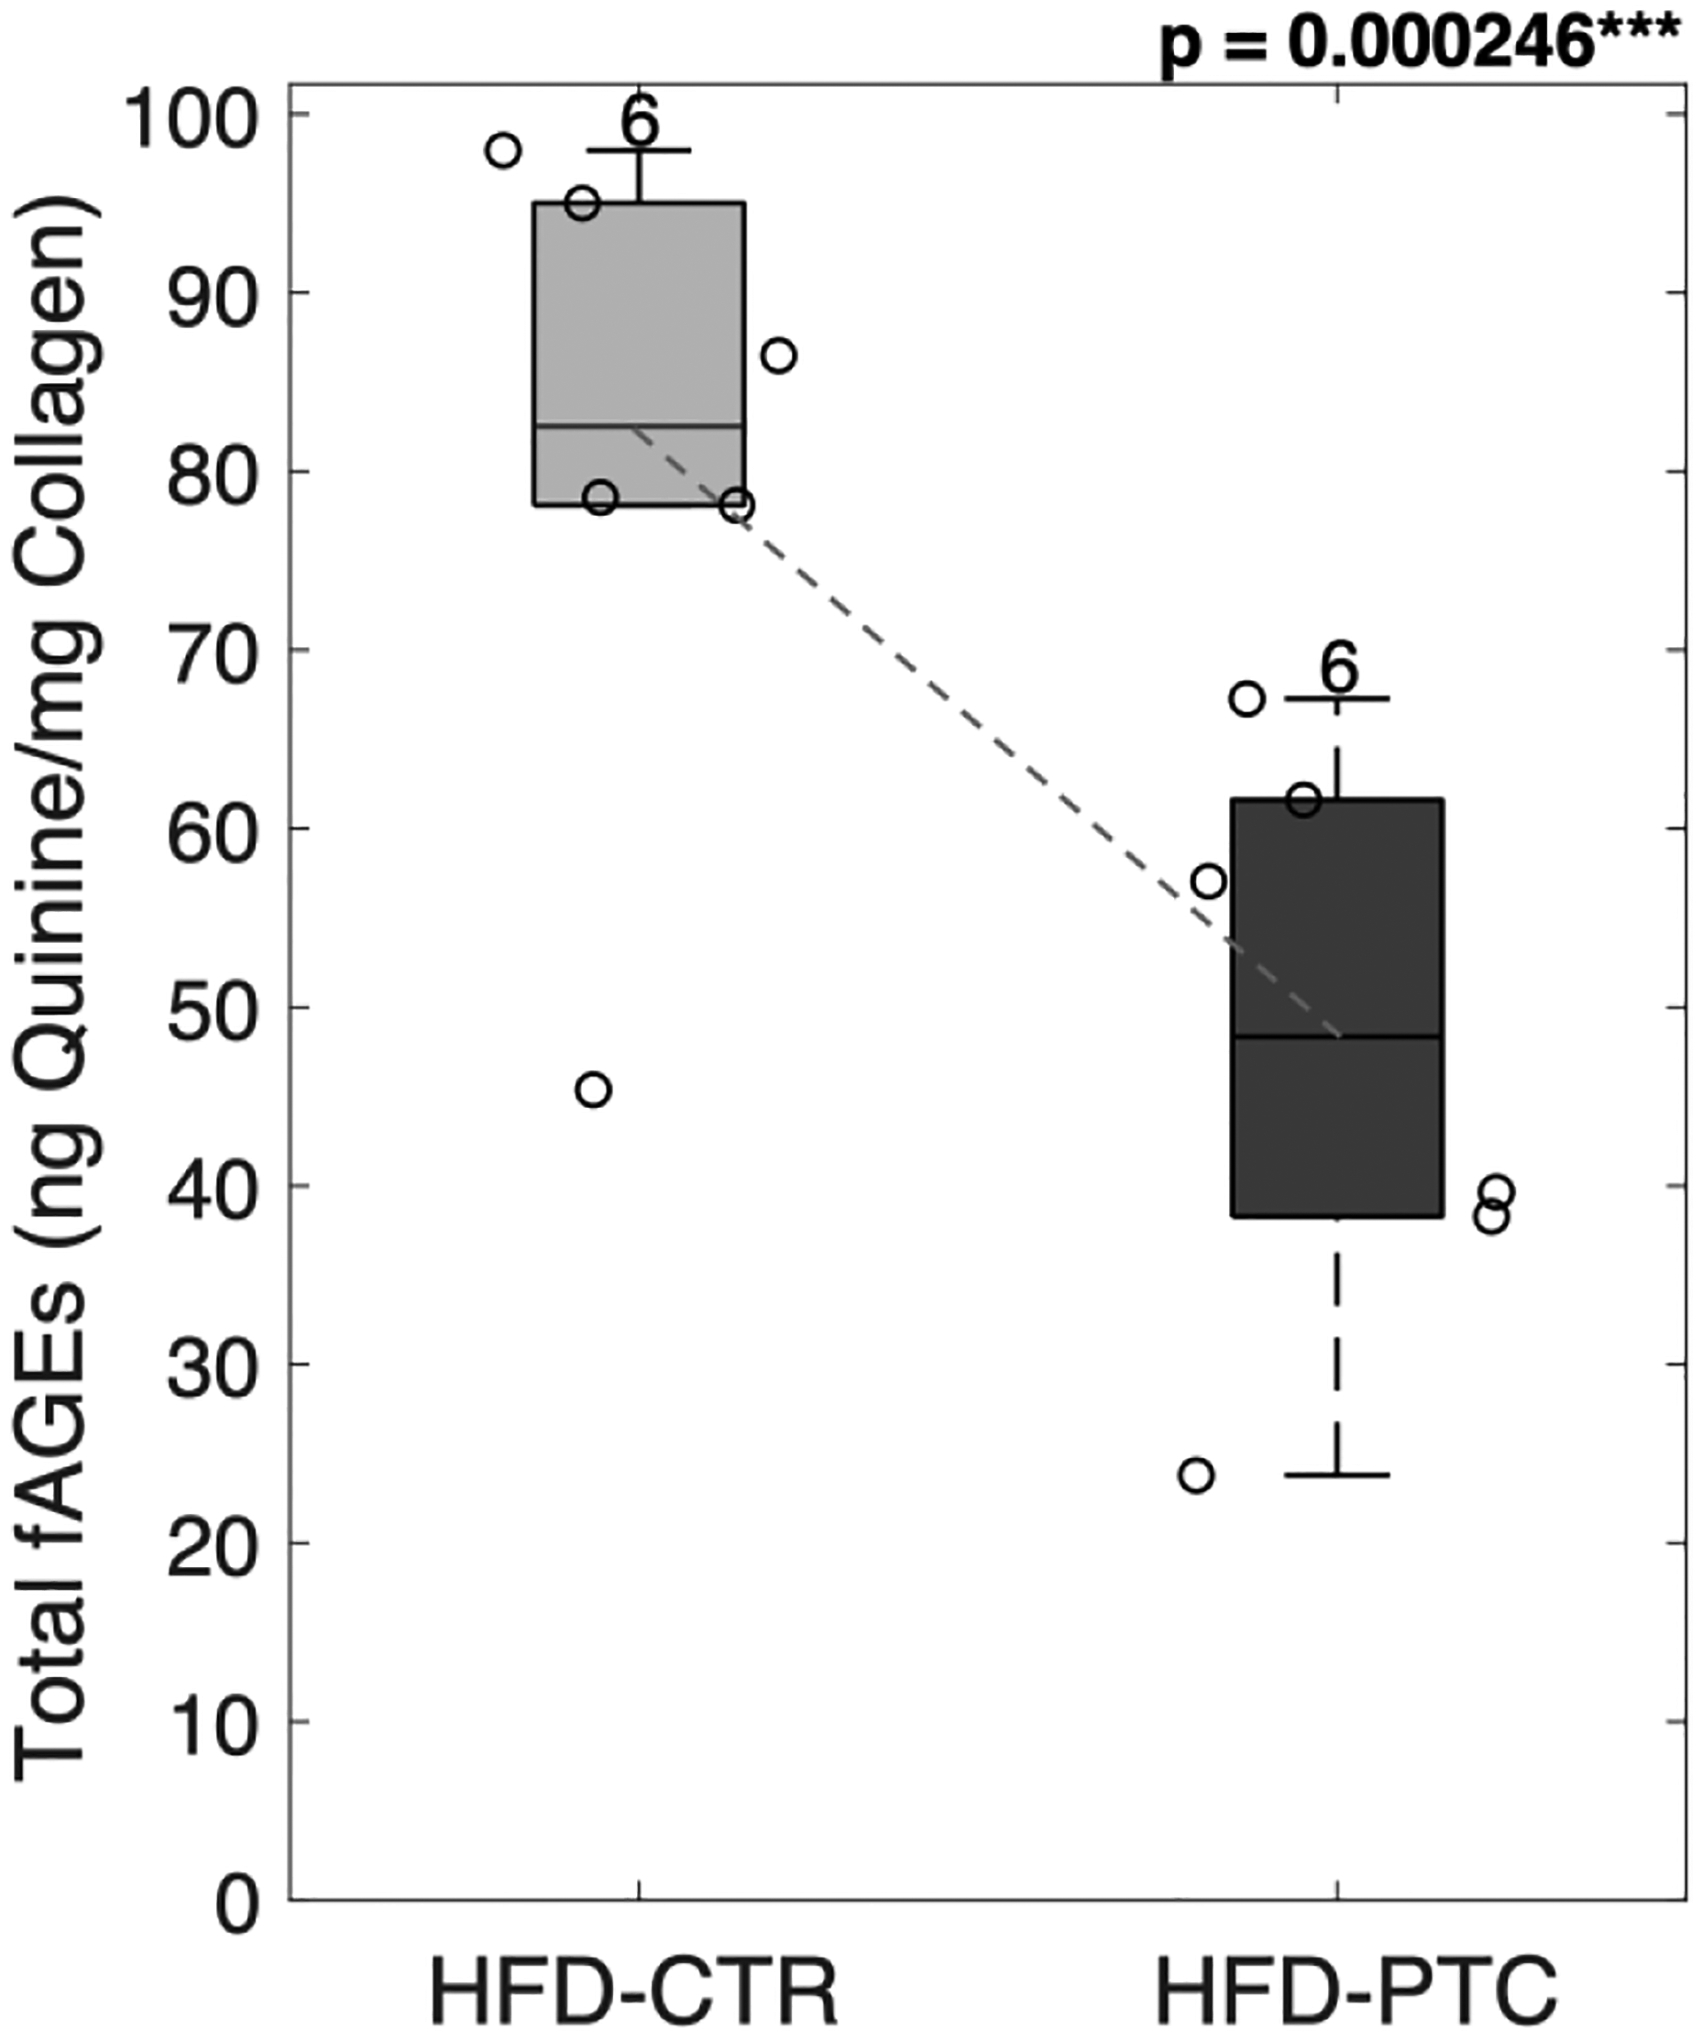
PTC-treated femoral samples showed a significant reduction in total fAGEs. HFD = high-fat diet; CTR = control group treated in saline; PTC = phenacyl thiazolium chloride; fAGEs = fluorescent advanced glycation end-products. Results are shown as boxplots (with median and interquartile range) showing all data points. Statistically significant differences were determined by Paired T-test (two tailed, α = 0.05). Number on top of each boxplot indicates sample size. Significant codes: p < 0.05 ‘*’, p < 0.001 ‘***’.
3.10. Removal of glycation end-products served as an effective in vitro treatment for rescuing bone toughness
PTC-treated samples demonstrated partial restoration of bone toughness. While the mean initiation toughness showed no significant changes (p = 0.3359, Figure 11A), the mean maximum toughness significantly increased by 35% (p = 0.04277, Figure 11B). Loss of maximum toughness negatively correlated with an increase in fAGEs (R = −0.55, p < 0.066) when HFD-CTR and HFD-PTC were combined.
Figure 11: Removal of glycation end-products served as an effective in vitro treatment for rescuing bone toughness.
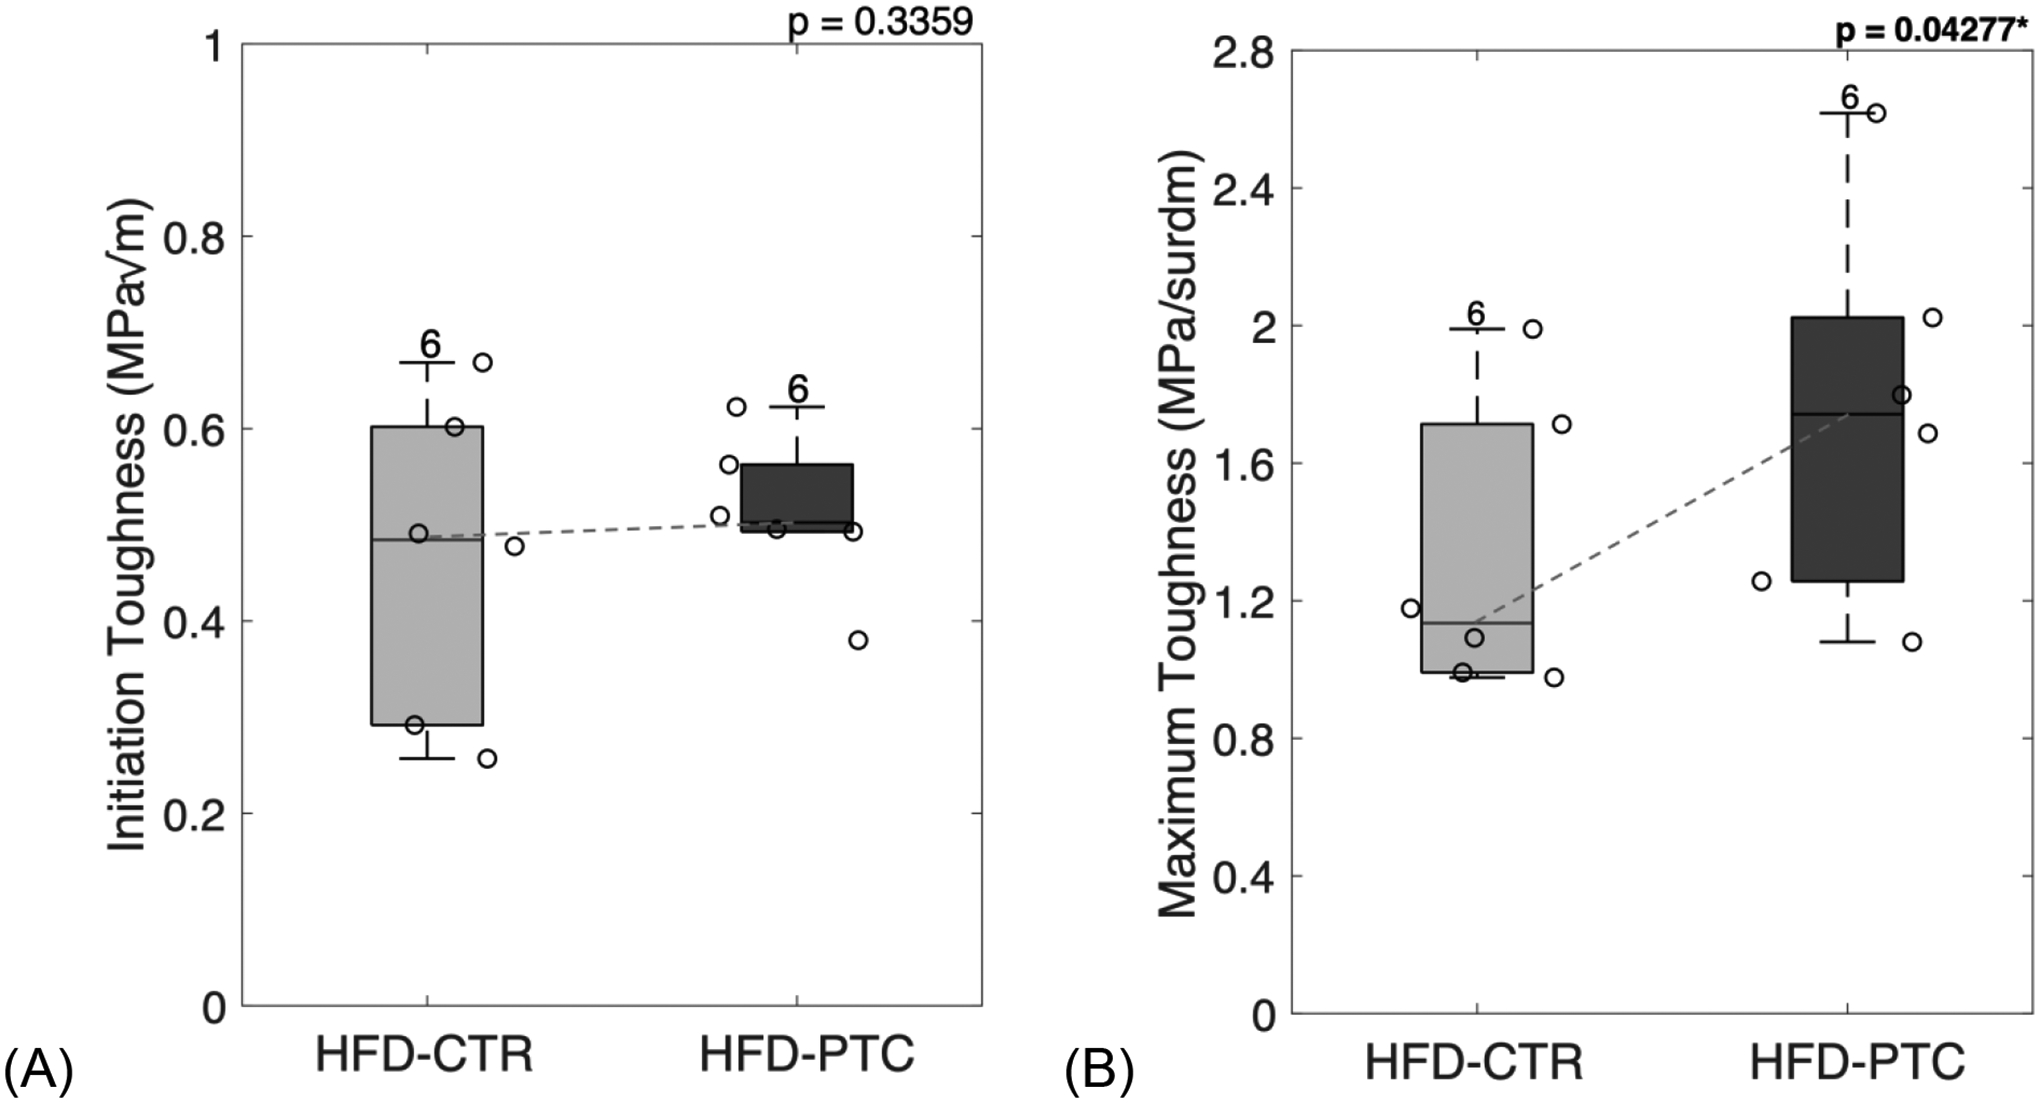
PTC-treated femoral samples showed a non-significant increase in initiation toughness (A) and significant increase in maximum toughness (B). HFD = high-fat diet; CTR = control group treated in saline; PTC = phenacyl thiazolium chloride. Results are shown as boxplots (with median and interquartile range) showing all data points. Statistically significant differences were determined by paired t-test (two tailed, α = 0.05). Number on top of each boxplot indicates sample size. Significant codes: p < 0.05 ‘*’, p < 0.001 ‘***’.
4. Discussion
While the detrimental effects of Type 2 Diabetes on bone quality have been well documented [11–15], this is the first study to demonstrate a partial rescue for HFD-induced skeletal fragility in a T2D mouse model using a combination of in vivo and in vitro approaches.
Here, we used a diet-induced T2D mouse model by giving ten-week-old C57BL/6J mice a high-fat diet during growth until maturity. Consistent with our results, previous studies have reported on the distinct metabolic effects of HFD [59, 60]. For example, Ionova-Martin et al [60]. reported on the metabolic phenotype of 15-week-old C57BL/6 male mice fed a high-fat diet (60 kcal% fat, 20 kcal% carbohydrate, 20 kcal% protein) for 16-weeks. HFD-fed animals showed an obesity phenotype with an increase in body mass, glucose levels, levels on leptin, and insulin-like growth factor (IGF-1) hormone concentration [60]. Interestingly, this study reported a 52.7% increase in body mass for HFD-fed mice compared to low-fat diet fed mice. However, here we report a 23.4% increase in body mass. It is likely that the changes we observed in mice are likely related to their hyperglycemic state. Paradoxically, another study by Li et al. [59] reported no differences in body weight between HFD-fed mice and standard-chow fed mice. Surprisingly, they still observed an obese phenotype as HFD-induced hyperinsulinemia also stimulated lipogenesis with levels of low-density lipoprotein (LDL) cholesterol significantly higher and an increase in liver tissue weight [59]. However, their model used younger mice with 6-week-old C57BL/6 mice fed a high-fat diet (53% kcal fat) for 10 weeks. Differences between these and our studies could be explained by considering that we used 10-week-old mice, kept the animals on diet for a longer period of 22 weeks, and provided the mice with a HFD that was lower in kcal from fat (46% kcal fat, 36% kcal carbs, 18% kcal protein).
Bones from the HFD and LFD group were harvested for characterization. In line with previous studies [59–65], our bone microarchitecture findings showed that diabetes caused an increase in the degree of mineralization, as well as alteration of its microstructure. Furthermore, similar to ours, a previous study [56] also reports trabecular structure to be affected. While we did not observe any changes in trabecular number and trabecular spacing, we saw a significant increase in trabeculae thickness in diabetic bone.
We evaluated the surface level mineral and organic properties using confocal Raman spectroscopy. Similar to Fourier transform infrared (FTIR) spectroscopy, Raman spectroscopy uses frequency shifts corresponding to collagen and mineral characteristics of the bone matrix [66, 67]. However, Raman spectroscopy is a non-invasive technique that provides a higher spatial resolution while allowing the use of fresh and embedded samples [68]. A growing number of studies have validated shift peaks in Raman spectroscopy with FTIR highlighting mineral phosphate, carbonate, and matrix collagen [44–53, 67–69]. We saw no significant changes in degree of mineralization, or the level of mineral maturity. However, we saw a significant increase glycoxidation products, measured as pentosidine and carboxymethyl-lysine, in diabetic mice over LFD-fed mice. Further, diabetic mice showed a significant reduction in collagen bound water. In addition, we observed a significant increase in total fAGEs in HFD-fed mice. Interestingly, the increase in blood glucose levels correlated with an increase in all AGEs including CML, PEN and fAGEs. When investigating bone toughness, we observed significant loss of initiation and maximum toughness in diabetic mice. Increase in CML, PEN and total fAGEs and decrease in collagen bound water all negatively correlated with loss in toughness. Moreover, we used stepwise linear regression to build a regression model that included all the predictor variables that were statistically significantly related to the response variable. Within our model, we included all measures of AGEs collected (fAGEs, PEN, and CML) and tested them against initiation and maximum toughness. Within the diabetic group we observed that CML predicted initiation toughness while PEN predicted maximum toughness. The effect of PEN in the post-yield properties was expected considering that PEN has been correlated to the stiffening of the organic matrix [21]. CML can impact the mineral phase of bone [19, 23, 24] and has been correlated with impaired mineralization [20]. While we did not find differences in the mineral-to-matrix as well as carbonate substitutions levels, we did observe HFD-fed mice had larger mineral crystals as well an increase in intrafibrillar space. Interestingly, a recently published study [70] reports a correlation between higher levels of CML and increased crystallinity, as measured by Raman spectroscopy. In concert, it has recently been proposed that the presence of a carboxy group on CML can attract positively charged calcium ions and cause increased mineralization as was observed via microCT and XRD in in this study. However, more studies are required to elucidate the mechanistic aspects of CML’s impact on bone toughness and mineralization [24].
We observed that glycation crosslinks were susceptible to cleavage by phenacyl thiazolium chloride. Our results showed that in vitro treatment with PTC caused a reduction in glycation crosslinks, measured as total fAGEs, by 41.2% compared to controls. In vitro treatment also partially restored bone toughness as maximum toughness increased by 35% compared to controls. The effect of PTC treatment in maximum fracture toughness, i.e., propagation toughness, furthers confirms that PTC can affect the organic matrix of bone, mainly collagen, and help restore fracture properties.
Interestingly, we observed no significant differences in the level of pentosidine or carboxymethyl-lysine. CML does not contain a α-dicarbonyl carbon-carbon bond formed in cross-linked structures thus it is expected that PTC could not cleave CML [71]. However, daily in vivo injections of PTC have been shown to reduce serum CML levels [36] suggesting the effect of PTC could be more pronounced in vivo possibly due to a reduction in the precursors for the formation of AGEs such as CML. Of note, PTC has been reported to have two mechanisms of action, one by cleavage of glycation/glycoxidation cross-links, and the second one as a methylglyoxal inhibitor [28]. For example, it was proposed that in the Lepr-deficient mice, PTC acted as an inhibitor of methylglyoxal [36]. This organic compound is structurally similar to glyoxal, if hydrogen of an aldehyde group of glyoxal was replaced by a methyl group. While CML does not contain a α-dicarbonyl carbon-carbon bond, it is formed from glyoxal [24] suggesting a potential for in vivo inhibition of CML formation from glyoxal using PTC, and such inhibition could restrain and eventually lower CML serum levels. In addition, dietary interventions such as rutin supplementation have been found to be effective at inhibiting CML formation in vivo and reducing inflammation associated with the high-fat diet [71–74].
Similar to a previous study [35], we did not see any reductions of PEN with in vitro PTC treatment. However, it is important to consider that PEN is low in abundance therefore suggesting that other AGEs featuring a dicarbonyl structure may be more relevant markers of glycation in bone [75, 76]. Nevertheless, PTC was efficient at removal of fAGEs and in partially restoring bone toughness, thus suggesting that other crosslinked AGEs might be more susceptible to cleavage by PTC. It is noteworthy that diabetic bone had a significant increase in glycoxidative products measured here in form of PEN and CML, which are both correlated to loss of toughness. Thus, it is likely that a strategy involving their removal and/or prevention could further restore bone toughness by enhancing energy dissipation at the molecular and higher hierarchical scales in bone [77]. Our results of PTC rescue of T2D induced bone fragility in vitro provide a conceptual framework with supporting data and require further investigation for optimal dose and duration of PTC treatment as well as in vivo confirmation.
We can expect PTC to be markedly more effective in vivo considering that accumulation of AGEs can reduce osteoblast differentiation and osteoclastic resorption [13–15]. In turn, the remodeling process is slowed down which allows more micro-damage to accumulate. Thus, in vivo removal will undoubtably impact the cellular response in bone by restoring the bone turnover ratio [78]. Furthermore, long-term diabetic patient in need of a bone graft can experience severe deficiencies in healing [30, 79–81]. Diabetic rat models, induced with streptozotocin (STZ) have shown that diabetic status impairs bone metabolism leading to poor healing of autogenous bone grafts [80]. Therefore, in vitro treatment with PTC, reported here, could be a viable method for bone grafts before implantation to improve its mechanical properties as well as the cellular response.
It should be taken into consideration that our diet selection (e.g., HFD, LFD) did not include a regular chow group. Moreover, LFD-fed mice, fed with carbohydrate rich (72%) diet, reached the pre-diabetic range (blood glucose > 200 mg/dL) towards the end of the study. This LFD group may therefore contain higher levels of AGEs and other adverse bone quality changes seen with increased blood sugar compared to a control group. Thus, it is likely that differences seen here between LFD and HFD groups could be greater in magnitude when compared between control and HFD groups. It is unclear whether the selected LFD limited bone development because of the reduced percentage of polyunsaturated fatty acids needed for the solubilization of fat-soluble vitamins key for bone growth. Moreover, we did not include running wheels in mice cages to prevent the confounding effects of exercise. Therefore, it is unclear if either HFD- or LFD-fed mice had higher cage activity that might have influenced bone development. Due to the high body mass of HFD-fed mice, it is also important to consider the possible cofounding effects of T2D with obesity. However, studies using Spontaneously Diabetic Torii (SDT) rats, a non-obese T2D murine model, found that body weight could not be accounted for the effects seen in bone formation, strength, and oxidative stress [65]. Furthermore, our mouse model started the diet treatment in their juvenile stage and ended it as mature adults. There have been reported varying effects of feeding young versus adult mice a HFD [59], thus it is important to note when interpreting our results for clinical advancement. In addition, our study only included male mice; thus, the potential gender effects are unclear.
It will be important to determine the effects of PTC to cleave crosslinked AGEs in vivo during continued presence of high blood glucose levels. From the mechanistic perspective, we can expect PTC to block the formation of new AGEs by attacking the reactive intermediates and breaking the carbon-carbon bonds between the two carbonyls present [27, 28]. Moreover, it is still unknown to what extent PTC prevents oxidation through metal chelation. Therefore, it is not currently possible to state which specific AGEs are being removed and which AGEs are more likely to cause skeletal fragility. Identification of AGEs which are modified and/or removed by PTC needs further investigation. Finally, it has been suggested that PTC can reduce RAGE expression, but again, the mechanistic aspects of PTC action on the RAGE pathway is not fully understood [37].
Taken together, our results show that non-enzymatic AGE crosslinks formed in T2D bone affect the material properties of bone and lead to loss of bone toughness. Our findings show that T2D bone toughness can indeed be partially rescued by removal of AGEs using PTC. However, the complexity of the in vivo PTC treatment has to be further evaluated before it can be applied as an effective medical treatment. Nevertheless, we provide a conceptual framework for future in vivo studies. Considering the growing epidemic of Type 2 Diabetes, particularly in young adults, our results offer both increased understanding and a possible approach to combat diabetes-induced skeletal fragility.
Supplementary Material
Highlights.
C57BL/6J mice, given a high-fat diet during development, developed type 2 diabetes.
Diabetic mice bones showed altered microarchitecture and increased mineralization.
Accumulation of glycation products correlated to the loss of bone toughness.
Glycation products were cleaved by phenacyl thiazolium chloride (PTC) in vitro.
Removal of glycation products correlated to a decrease in bone fragility.
Acknowledgments
This work was supported by the National Institute of Health under Award Numbers AR40558 (DV), and AG20618 (DV).
Grant Funding
NIH AR40558 (DV), NIH AG20618 (DV).
Footnotes
Publisher's Disclaimer: This is a PDF file of an unedited manuscript that has been accepted for publication. As a service to our customers we are providing this early version of the manuscript. The manuscript will undergo copyediting, typesetting, and review of the resulting proof before it is published in its final form. Please note that during the production process errors may be discovered which could affect the content, and all legal disclaimers that apply to the journal pertain.
Declarations of interest
None.
A part of this work has been published as a brief abstract during the Orthopaedic Research Society 2020 Annual Meeting Paper No.0873.
References
- [1].Ahmed N et al. Advanced glycation endproducts--role in pathology of diabetic complications. Diabetes Research and Clinical Practice. 2015; 3–21. [DOI] [PubMed] [Google Scholar]
- [2].Karim et al. Effect of type 2 diabetes-related non-enzymatic glycation on bone biomechanical properties. Bone. 2016. Jan; 82:21–7. doi: 10.1016/j.bone.2015.07.028. [DOI] [PMC free article] [PubMed] [Google Scholar]
- [3].Bonds DE, Larson JC, Schwartz AV, Strotmeyer ES, Robbins J, Rodriguez BL, Johnson KC, Margolis KL. Risk of fracture in women with type 2 diabetes: the Women’s Health Initiative Observational Study. J Clin Endocrinol Metab. 2006;91:3404–10. [DOI] [PubMed] [Google Scholar]
- [4].Vestergaard P Discrepancies in bone mineral density and fracture risk in patients with type 1 and type 2 diabetes--a meta-analysis. Osteoporos Int. 2007;18:427–44. [DOI] [PubMed] [Google Scholar]
- [5].Looker AC, Eberhardt MS, Saydah SH. Diabetes and fracture risk in older U. S. adults. Bone. 2015 [DOI] [PMC free article] [PubMed] [Google Scholar]
- [6].Hunt HB, Torres AM, Palomino PM, Marty E, Saiyed R, Cohn M, Jo J, Warner S, Sroga GE, King KB, Lane JM, Vashishth D, Hernandez CJ, Donnelly E. Altered tissue composition, microarchitecture, and mechanical performance in cancellous bone from men with type 2 diabetes mellitus. J Bone Miner Res. 2019. Jul;34(7):1191–1206. [DOI] [PMC free article] [PubMed] [Google Scholar]
- [7].Janghorbani M, Van Dam RM, Willett WC, Hu FB. Systematic review of type 1 and type 2 diabetes mellitus and risk of fracture. Am J Epidemiol. 2007;166:495–505. [DOI] [PubMed] [Google Scholar]
- [8].Yamamoto M, Sugimoto T. Advanced Glycation End Products, Diabetes, and Bone Strength. Curr Osteoporos Rep. 2016; 14:320–326. Doi: 10.1007/s11914-016-0332-1. [DOI] [PMC free article] [PubMed] [Google Scholar]
- [9].Miller L, Little W, Schirmer A, Sheik F, Busa B, & Judex S (2007). Accretion of bone quantity and quality in the developing mouse skeleton. Journal of Bone and Mineral Research, 1037–1045. [DOI] [PubMed] [Google Scholar]
- [10].Cerda C et al. Oxidative Stress and Inflammation in Non-communicable Diseases - Molecular Mechanisms and Perspectives in Therapeutics. Advances in Experimental Medicine and Biology. 2014; 824, 5–17. doi: 10.1007/978-3-319-07320-0 [DOI] [PubMed] [Google Scholar]
- [11].Vashishth D Advanced Glycation End-products and Bone Fractures. IBMS Bonekey. 2009. August; 6(8): 268–278. doi: 10.1138/20090390. [DOI] [PMC free article] [PubMed] [Google Scholar]
- [12].Vashishth D, Gibson GJ, Khoury JI, Schaffler MB, Kimura J, Fyhrie DP. Influence of Nonenzymatic Glycation on Biomechanical Properties of Cortical Bone. Bone. 2001; 28(2):195–201. [DOI] [PubMed] [Google Scholar]
- [13].Sroga GE and Vashishth D. UPLC methodology for identification and quantification of naturally fluorescent crosslinks in proteins: A study of bone collagen. J. Chromatrgr. B Anal. Technol. Biomed. 879(5–6): 379–385, 2011. [DOI] [PMC free article] [PubMed] [Google Scholar]
- [14].Tang SY, Zeenath U, Vashishth D. Effects of non-enzymatic glycation on cancellous bone fragility. Bone. 2007; 40: 1144–1151. doi: 10.1016/j.bone.2006.12.056. [DOI] [PMC free article] [PubMed] [Google Scholar]
- [15].Poundarik AA, Wu PC, Evis Z, Sroga GE, Ural A, Rubin M, Vashishth D. A direct role of collagen glycation in bone fracture. J Mech Behav Biomed Mater. 2015. Dec;52:120–130. [DOI] [PMC free article] [PubMed] [Google Scholar]
- [16].Zimmermann EA, Schaible E, Bale H, Barth HD, Tang SY, Reichert P, … Ritchie RO (2011). Age-related changes in the plasticity and toughness of human cortical bone at multiple length scales. Proceedings of the National Academy of Sciences, 108(35), 14416–14421. doi: 10.1073/pnas.1107966108 [DOI] [PMC free article] [PubMed] [Google Scholar]
- [17].Nyman JS, Uppuganti S, Unal M, Leverant CJ, Adabala S, Granke M, … Does MD (2019). Manipulating the amount and structure of the organic matrix affects the water compartments of human cortical bone. JBMR Plus.doi: 10.1002/jbm4.10135 [DOI] [PMC free article] [PubMed] [Google Scholar]
- [18].Granke M, Does MD, & Nyman JS (2015). The Role of Water Compartments in the Material Properties of Cortical Bone. Calcified Tissue International, 97(3), 292–307. doi: 10.1007/s00223-015-9977-5 [DOI] [PMC free article] [PubMed] [Google Scholar]
- [19].Thomas C, Cleland T, Sroga G, & Vashishth D Accumulation of carboxymethyl-lysine (CML) in human cortical bone. Bone. 2018; 128–133. [DOI] [PMC free article] [PubMed] [Google Scholar]
- [20].Nakano Masaki, et al. Pentosidine and Carboxymethyl-Lysine Associate Differently with Prevalent Osteoporotic Vertebral Fracture and Various Bone Markers. Scientific Reports, vol. 10, no. 1, 2020, doi: 10.1038/s41598-020-78993-w. [DOI] [PMC free article] [PubMed] [Google Scholar]
- [21].Kawamura M, Masaki C, Shibata Y, Kondo Y, Mukaibo T, Miyazaki T, & Hosokawa R (2019). Pentosidine correlates with nanomechanical properties of human jaw bone. Journal of the Mechanical Behavior of Biomedical Materials. doi: 10.1016/j.jmbbm.2019.06.002 [DOI] [PubMed] [Google Scholar]
- [22].Gaens KH, Goossens GH, Niessen PM, van Greevenbroek MM, van der Kallen CJ, Niessen HW, Rensen SS, Buurman WA, Greve JW, Blaak EE, van Zandvoort MA, Bierhaus A, Stehouwer CD, Schalkwijk CG. Nepsilon-(carboxymethyl)lysine-receptor for advanced glycation end product axis is a key modulator of obesity-induced dysregulation of adipokine expression and insulin resistance. Arterioscler Thromb Vasc Biol. 2014; 34:1199–208. [DOI] [PubMed] [Google Scholar]
- [23].Ehrlich H, Hanke T, Frolov A, Langrock T, Hoffmann R, Fischer C, Schwarzenbolz U, Hnele T, Born R, Worch H. (2008) Modification of collagen in vitro with respect to formation of Nε-carboxymethyllysine. Int J Biol Macro. 44(1):51–6; doi: 10.1016/j.ijbiomac/2008.10.001 [DOI] [PubMed] [Google Scholar]
- [24].Sroga G & Vashishth D. (2021) Controlled Formation of Carboxymethyllysine in Bone Matrix through Designed Glycation Reaction. JBMR Plus 2021; doi: 10.1002/jbm4.10548 [DOI] [PMC free article] [PubMed] [Google Scholar]
- [25].Lyons TJ (1993). Glycation and Oxidation of Proteins: A Role in the Pathogenesis of Atherosclerosis? Medical Science Symposia Series, 407–420. doi: 10.1007/978-94-011-1703-6_49 [DOI] [Google Scholar]
- [26].Lyons TJ and Alicia J Jenkins AJ (1997). Glycation, oxidation, and lipoxidation in the development of the complications of diabetes: a carbonyl stress hypothesis. Diabetes Rev (Alex). 1997; 5(4): 365–391. [PMC free article] [PubMed] [Google Scholar]
- [27].Vasan S et al. An agent cleaving glucose-derived protein crosslinks in vitro and in vivo. Nature. 1996. Jul 18;382(6588):275–8. doi: 10.1038/382275a0. [DOI] [PubMed] [Google Scholar]
- [28].Coughlan MT, Forbes JM, Cooper ME. Role of the AGE crosslink breaker, alagebrium, as a renoprotective agent in diabetes. Kidney International. 2007; 72:S54–S60. doi: 10.1038/sj.ki.5002387 [DOI] [PubMed] [Google Scholar]
- [29].Bradke BS, Vashishth D. N-Phenacylthiazolium Bromide Reduces Bone Fragility Induced by Nonenzymatic Glycation. PLoS ONE. 2014; 9(7): e103199. doi: 10.1371/journal.pone.0103199 [DOI] [PMC free article] [PubMed] [Google Scholar]
- [30].Sabado-Bundo H, Sanchez-Garces M, & Gay-Escoda C (2019). Bone regeneration in diabetic patients. A systematic review. Medicina Oral Patología Oral y Cirugia Bucal, 0–0. doi: 10.4317/medoral.22889. [DOI] [PMC free article] [PubMed] [Google Scholar]
- [31].Cooper ME, Thallas V, Forbes J, Scalbert E, Sastra S, Darby I, Soulis T. The cross-link breaker, N-phenacylthiazolium bromide prevents vascular advanced glycation end-product accumulation. Diabetologia (2000) 43: 660–664. [DOI] [PubMed] [Google Scholar]
- [32].Little WC, Zile MR, Kitzman DW, Hundley WG, O’Brien TX, Degroof RC. The Effect of Alagebrium Chloride (ALT711), a Novel Glucose Cross-Link Breaker, in the Treatment of Elderly Patients With Diastolic Heart Failure. J Card Fail 2005; 11: 191–5. [DOI] [PubMed] [Google Scholar]
- [33].Zieman SJ, Melenovsky V, Clattenburg L, et al. Advanced glycation endproduct crosslink breaker (alagebrium) improves endothelial function in patients with isolated systolic hypertension. J Hypertens 2007; 25: 577–83. [DOI] [PubMed] [Google Scholar]
- [34].Hartog JW, Willemsen S, van Veldhuisen DJ, et al. Effects of alagebrium, an advanced glycation endproduct breaker, on exercise tolerance and cardiac function in patients with chronic heart failure. Eur J Heart Fail 2011; 13: 899–908. [DOI] [PubMed] [Google Scholar]
- [35].Chen NX, Srinivasan S, O’Neill K, Nickolas TL, Wallace JM, Allen MR, Metzger CE, Creecy A, Avin KG, Moe SM. Effect of advanced glycation end-products (AGE) lowering drug ALT-711 on biochemical, vascular, and bone parameters in a rat model of CKD-MBD. J Bone Miner Res. 2020. Mar;35(3):608–617. doi: 10.1002/jbmr.3925. [DOI] [PMC free article] [PubMed] [Google Scholar]
- [36].Peppa M, Brem H, Cai W, Zhang J-G, Basgen J, Li Z, … Uribarri J (2006). Prevention and Reversal of Diabetic Nephropathy in db/db Mice Treated with Alagebrium (ALT-711). American Journal of Nephrology, 26(5), 430–436.doi: 10.1159/000095786 [DOI] [PubMed] [Google Scholar]
- [37].Toprak C, Yigitaslan S. Alagebrium and Complications of Diabetes Mellitus. Eurasian J Med 2019; 51(3): 285–92. doi: 10.5152/eurasianjmed.2019.18434. [DOI] [PMC free article] [PubMed] [Google Scholar]
- [38].Bailey S, Magliochetti T, Vashishth D, McNay E. Removal of Advanced Glycation End-products In Vivo Rescues Bone Fragility. J Bone Miner Res. 2019; 34: 65–65. [Google Scholar]
- [39].Andrikopoulos S, Blair AR, Deluca N, Fam BC, Proietto J. Evaluating the glucose tolerance test in mice. Am J Physiol Endocrinol Metab. 2008; 295: E1323–E1332. doi: 10.1152/ajpendo.90617.2008. [DOI] [PubMed] [Google Scholar]
- [40].Fajardo RJ, Karim L, Calley VI, Bouxsein ML. A Review of Rodent Models of Type 2 Diabetic Skeletal Fragility. Journal of Bone and Mineral Research. 2014; 29(5):1025–1040. doi: 10.1002/jbmr.2210. [DOI] [PMC free article] [PubMed] [Google Scholar]
- [41].Bouxsein ML et al. Guidelines for Assessment of Bone Microstructure in Rodents Using Micro–Computed Tomography. JBMR. 2010; 25 (7): 1468–1486. doi: 10.1002/jbmr.141. [DOI] [PubMed] [Google Scholar]
- [42].Ritchie RO et al. Measurement of the toughness of bone: a tutorial with special reference to small animal studies. Bone. 2008; 43(5): 798–812. doi: 10.1016/j.bone.2008.04.027. [DOI] [PMC free article] [PubMed] [Google Scholar]
- [43].Vashishth D. Small animal bone biomechanics. Bone. 2008; 43(5): 794–797. [DOI] [PMC free article] [PubMed] [Google Scholar]
- [44].Penel G, Delfosse C, Descamps M, Leroy G. Composition of bone and apatitic biomaterials as revealed by intravital Raman microspectroscopy. Bone. 2005;36(5):893–901. doi: 10.1016/j.bone.2005.02.012 [DOI] [PubMed] [Google Scholar]
- [45].Mandair GS, Morris MD. Contributions of Raman spectroscopy to the understanding of bone strength. Bonekey Rep. 2015;4:1–8. doi: 10.1038/bonekey.2014.115 [DOI] [PMC free article] [PubMed] [Google Scholar]
- [46].Gamsjaeger S, Robins SP, Tatakis DN, Klaushofer K, & Paschalis EP (2017). Identification of Pyridinoline Trivalent Collagen Cross-Links by Raman Microspectroscopy. Calcified Tissue International, 100(6), 565–574. doi: 10.1007/s00223-016-0232-5 [DOI] [PubMed] [Google Scholar]
- [47].Rubin M, Paschalis E, Poundarik A, Sroga G, Mcmahon D, Gamsjaeger S, Vashishth D (2016). Advanced Glycation Endproducts and Bone Material Properties in Type 1 Diabetic Mice. Plos One, e0154700. [DOI] [PMC free article] [PubMed] [Google Scholar]
- [48].Unal M, Uppuganti S, Timur S, Mahadevan-Jansen A, Akkus O, & Nyman JS (2019). Assessing matrix quality by Raman spectroscopy helps predict fracture toughness of human cortical bone. Scientific Reports, 9(1). doi: 10.1038/s41598-019-43542-7 [DOI] [PMC free article] [PubMed] [Google Scholar]
- [49].Unal M, Uppuganti S, Leverant CJ, Creecy A, Granke M, Voziyan P, & Nyman JS (2018). Assessing glycation-mediated changes in human cortical bone with Raman spectroscopy. Journal of Biophotonics, 11(8), e201700352. doi: 10.1002/jbio.201700352 [DOI] [PMC free article] [PubMed] [Google Scholar]
- [50].Unal M, Jung H, & Akkus O (2016). Novel Raman Spectroscopic Biomarkers Indicate That Postyield Damage Denatures Bone’s Collagen. Journal of Bone and Mineral Research, 31(5), 1015–1025. doi: 10.1002/jbmr.2768 [DOI] [PubMed] [Google Scholar]
- [51].Unal M, & Akkus O (2015). Raman spectral classification of mineral- and collagen-bound water’s associations to elastic and post-yield mechanical properties of cortical bone. Bone, 81, 315–326. doi: 10.1016/j.bone.2015.07.024 [DOI] [PMC free article] [PubMed] [Google Scholar]
- [52].Paschalis EP, Fratzl P, Gamsjaeger S, Hassler N, Brozek W, Eriksen EF, … Klaushofer K (2015). Aging Versus Postmenopausal Osteoporosis: Bone Composition and Maturation Kinetics at Actively-Forming Trabecular Surfaces of Female Subjects Aged 1 to 84 Years. Journal of Bone and Mineral Research, 31(2), 347–357. doi: 10.1002/jbmr.2696 [DOI] [PubMed] [Google Scholar]
- [53].Rokidi S, Andrade VFC, Borba V, Shane E, Cohen A, Zwerina J, … Moreira CA (2020). Bone tissue material composition is compromised in premenopausal women with Type 2 diabetes. Bone, 115634. doi: 10.1016/j.bone.2020.115634 [DOI] [PubMed] [Google Scholar]
- [54].Shitole P, Choubey A, Mondal P, & Ghosh R (2021). LDN Protects Bone Property Deterioration at Different Hierarchical Levels in T2DM Mice Bone. ACS Omega, 6(31), 20369–20378. doi: 10.1021/acsomega.1c02371 [DOI] [PMC free article] [PubMed] [Google Scholar]
- [55].Londoño-Restrepo SM, Jeronimo-Cruz R, Millán-Malo BM, Rivera-Muñoz EM, & Rodriguez-García ME (2019). Effect of the Nano Crystal Size on the X-ray Diffraction Patterns of Biogenic Hydroxyapatite from Human, Bovine, and Porcine Bones. Scientific Reports, 9(1). doi: 10.1038/s41598-019-42269-9 [DOI] [PMC free article] [PubMed] [Google Scholar]
- [56].Monshi A, Foroughi MR, & Monshi MR (2012). Modified Scherrer Equation to Estimate More Accurately Nano-Crystallite Size Using XRD. World Journal of Nano Science and Engineering, 02(03), 154–160. doi: 10.4236/wjnse.2012.23020 [DOI] [Google Scholar]
- [57].Poundarik AA, Boskey A, Gundberg C, & Vashishth D (2018). Biomolecular regulation, composition and nanoarchitecture of bone mineral. Scientific Reports, 8(1). doi: 10.1038/s41598-018-19253-w [DOI] [PMC free article] [PubMed] [Google Scholar]
- [58].Jepsen KJ, Silva MJ, Vashishth D, Guo XE, van der Meulen MCH. Establishing Biomechanical Mechanisms in Mouse Models: Practical Guidelines for Systematically Evaluating Phenotypic Changes in the Diaphyses of Long Bones. J Bone Miner Res. 2015. June ; 30(6): 951–966. doi: 10.1002/jbmr.2539. [DOI] [PMC free article] [PubMed] [Google Scholar]
- [59].LI J, WU H, LIU Y, & YANG L (2020). High fat diet induced obesity model using four strains of mice: Kunming, C57BL/6, BALB/c and ICR. Experimental Animals.doi: 10.1538/expanim.19-0148 [DOI] [PMC free article] [PubMed] [Google Scholar]
- [60].Ionova-Martin SS, Wade JM, Tang S, Shahnazari M, Ager III JW, Lane NE, Yao W, Alliston T, Vaisse C, Ritchie RO. Changes in cortical bone response to high-fat diet from adolescence to adulthood in mice. Osteoporos Int. 2011; 22:2283–2293. doi: 10.1007/s00198-010-1432-x. [DOI] [PMC free article] [PubMed] [Google Scholar]
- [61].Mohsin S, Kaimala S, Sunny JJ, Adeghate E, Brown EM. Type 2 Diabetes Mellitus Increases the Risk to Hip Fracture in Postmenopausal Osteoporosis by Deteriorating the Trabecular Bone Microarchitecture and Bone Mass. Journal of Diabetes Research. 2019; 3876957. doi: 10.1155/2019/3876957. [DOI] [PMC free article] [PubMed] [Google Scholar]
- [62].Creecy A, Uppuganti S, Merkel AR, O’Neal D, Makowski AJ, Granke M, Voziyan P, Nyman JS. Changes in the Fracture Resistance of Bone with the Progression of Type 2 Diabetes in the ZDSD Rat. Calcif Tissue Int. 2016. September; 99(3): 289–301. doi: 10.1007/s00223-016-0149-z. [DOI] [PMC free article] [PubMed] [Google Scholar]
- [63].Prisby RD, Swift JM, Bloomfield SA, Hogan HA, Delp MD. Altered bone mass, geometry and mechanical properties during the development and progression of type 2 diabetes in the Zucker diabetic fatty rat. Journal of Endocrinology. 2008; 199: 379–388. doi: 10.1677/JOE-08-0046. [DOI] [PubMed] [Google Scholar]
- [64].Kawashima Y, Fritton JC, Yakar S, Epstein S, Schaffler MB, Jepsen KJ, LeRoith D. Type 2 Diabetic Mice Demonstrate Slender Long Bones with Increased Fragility Secondary to Increased Osteoclastogenesis. Bone. 2009. April; 44(4): 648–655. doi: 10.1016/j.bone.2008.12.012. [DOI] [PMC free article] [PubMed] [Google Scholar]
- [65].Fujii H, Hamada Y, & Fukagawa M (2008). Bone formation in spontaneously diabetic Torii-newly established model of non-obese type 2 diabetes rats. Bone, 42(2), 372–379. doi: 10.1016/j.bone.2007.10.007 [DOI] [PubMed] [Google Scholar]
- [66].Schmidt FN, Zimmermann EA, Campbell GM, Sroga GE, Püschel K, Amling M, … Busse B (2017). Assessment of collagen quality associated with non-enzymatic cross-links in human bone using Fourier-transform infrared imaging. Bone, 97, 243–251. doi: 10.1016/j.bone.2017.01.015 [DOI] [PMC free article] [PubMed] [Google Scholar]
- [67].Morris MD, & Mandair GS (2010). Raman Assessment of Bone Quality. Clinical Orthopaedics and Related Research®, 469(8), 2160–2169. doi: 10.1007/s11999-010-1692-y [DOI] [PMC free article] [PubMed] [Google Scholar]
- [68].Glenn JV, Beattie JR, Barrett L, Frizzell N, Thorpe SR, Boulton ME, … Stitt AW (2007). Confocal Raman microscopy can quantify advanced glycation end product (AGE) modifications in Bruch’s membrane leading to accurate, nondestructive prediction of ocular aging. The FASEB Journal, 21(13), 3542–3552.doi: 10.1096/fj.06-7896com [DOI] [PubMed] [Google Scholar]
- [69].Carvalho MS, Silva JC, Hoff CM, Cabral JMS, Linhardt RJ, Silva CL, & Vashishth D (2020). Loss and rescue of osteocalcin and osteopontin modulate osteogenic and angiogenic features of mesenchymal stem/stromal cells. Journal of Cellular Physiology. doi: 10.1002/jcp.29653 [DOI] [PubMed] [Google Scholar]
- [70].Tice MJL, Bailey S, Sroga GE, Gallagher EJ, Vashishth D (2021) Non-obese MKR model of type 2 diabetes reveals skeletal alterations in mineralization and material properties. JBMR Plus. doi: 10.1002/JBM4.10583. [DOI] [PMC free article] [PubMed] [Google Scholar]
- [71].Brings S, Fleming T, Freichel M, Muckenthaler M, Herzig S, & Nawroth P (2017). Dicarbonyls and Advanced Glycation End-Products in the Development of Diabetic Complications and Targets for Intervention. International Journal of Molecular Sciences, 18(5), 984. doi: 10.3390/ijms18050984 [DOI] [PMC free article] [PubMed] [Google Scholar]
- [72].Liang W, Zhang D, Kang J, Meng X, Yang J, Yang L, … Gou X (2018). Protective effects of rutin on liver injury in type 2 diabetic db/db mice. Biomedicine & Pharmacotherapy, 107, 721–728. doi: 10.1016/j.biopha.2018.08.046 [DOI] [PubMed] [Google Scholar]
- [73].Cervantes-Laurean D, Schramm DD, Jacobson EL, Halaweish I, Bruckner GG, & Boissonneault GA (2006). Inhibition of advanced glycation end product formation on collagen by rutin and its metabolites. The Journal of Nutritional Biochemistry, 17(8), 531–540. doi: 10.1016/j.jnutbio.2005.10.002 [DOI] [PubMed] [Google Scholar]
- [74].Guo X, Tang R, Yang S, Lu Y, Luo J, & Liu Z (2018). Rutin and Its Combination With Inulin Attenuate Gut Dysbiosis, the Inflammatory Status and Endoplasmic Reticulum Stress in Paneth Cells of Obese Mice Induced by High-Fat Diet. Frontiers in Microbiology, 9. doi: 10.3389/fmicb.2018.02651 [DOI] [PMC free article] [PubMed] [Google Scholar]
- [75].Mitome J, Yamamoto H, Saito M, Yokoyama K, Marumo K, & Hosoya T (2011). Nonenzymatic cross-linking pentosidine increase in bone collagen and are associated with disorders of bone mineralization in dialysis patients. Calcified Tissue International, 521–529. [DOI] [PubMed] [Google Scholar]
- [76].Saito M, & Marumo K (2010). Collagen cross-links as a determinant of bone quality: a possible explanation for bone fragility in aging, osteoporosis, and diabetes mellitus. Osteoporosis International, 195–214. [DOI] [PubMed] [Google Scholar]
- [77].Ural A, & Vashishth D (2014). Hierarchical perspective of bone toughness – from molecules to fracture. International Materials Reviews, 59(5), 245–263. doi: 10.1179/1743280414y.0000000031 [DOI] [Google Scholar]
- [78].Ural A, Janeiro C, Karim L, Diab T, & Vashishth D (2014). Association between non-enzymatic glycation, resorption, and microdamage in human tibial cortices. Osteoporosis International, 26(3), 865–873. doi: 10.1007/s00198-014-2938-4 [DOI] [PMC free article] [PubMed] [Google Scholar]
- [79].Mehta SK, Breitbart EA, Berberian WS, Liporace FA, & Lin SS (2010). Bone and Wound Healing in the Diabetic Patient. Foot and Ankle Clinics, 15(3), 411–437. doi: 10.1016/j.fcl.2010.03.005 [DOI] [PubMed] [Google Scholar]
- [80].Timóteo C, Aranega A, Shinohara E, & Coléte J (2017). Bone Repair Process in Defects of Diabetic Rats Filled with Autogenous Bone Graft and Covered with Homogenous Bone Matrix Membrane or Polytetrafluoroethylene Membrane. The International Journal of Oral & Maxillofacial Implants, 32(3), e143–e152. doi: 10.11607/jomi.5115 [DOI] [PubMed] [Google Scholar]
- [81].Alpan AL, Toker H, & Özer H (2020). Ozone improves autogenous graft healing in experimental diabetes mellitus: A morphometric and immunohistochemical study. Selcuk Dent J, 2020; 7: 44–53. [Google Scholar]
Associated Data
This section collects any data citations, data availability statements, or supplementary materials included in this article.


