

Abstract
Drug-drug-interactions (DDIs) occur when a drug alters the metabolic rate, efficacy, and toxicity of concurrently used drugs. While almost 1 in 4 adults now use at least 3 concurrent prescription drugs in the United States, the Non-alcoholic fatty liver disease (NAFLD) prevalence has also risen over 25%. The effect of NALFD on DDIs is largely unknown. NAFLD is characterized by lipid vesicle accumulation in the liver, which can progress to severe steatohepatitis (NASH), fibrosis, cirrhosis, and hepatic carcinoma. The CYP450 enzyme family dysregulation in NAFLD, which might already alter the efficacy and toxicity of drugs, has been partially characterized. Nevertheless, the drug-induced dysregulation of CYP450 enzymes has not been studied in the fatty liver. These changes in enzymatic inducibility during NAFLD, when taking concurrent drugs, could cause unexpected fatalities through inadvertent DDIs. We have, thus, developed an in vitro model to investigate the CYP450 transcriptional regulation in NAFLD. Specifically, we cultured primary human hepatocytes in a medium containing free fatty acids, high glucose, and insulin for seven days. These cultures displayed intracellular macro-steatosis after 5 days and cytokine secretion resembling NAFLD patients. We further verified the model’s dysregulation in the transcription of key CYP450 enzymes. We then exposed the NAFLD model to the drug inducers rifampicin, Omeprazole, and Phenytoin as activators of transcription factors pregnane X receptor (PXR), aryl hydrocarbon receptor (AHR) and constitutive androstane receptor (CAR), respectively. In the NAFLD model, Omeprazole maintained an expected induction of CYP1A1, however Phenytoin and Rifampicin showed elevated induction of CYP2B6 and CYP2C9 compared to healthy cultures. We, thus, conclude that the fatty liver could cause aggravated drug-drug interactions in NAFLD or NASH patients related to CYP2B6 and CYP2C9 enzymes.
Keywords: Non-alcoholic fatty liver disease, Lipid accumulation, Primary human hepatocyte, CYP450, Drug metabolism, Drug-drug interaction
1. Introduction
Non-alcoholic fatty liver disease (NAFLD) is a clinical syndrome featuring liver macro-vesicular fat accumulation, or steatosis, driven by an imbalance in the hepatic intake, synthesis, degradation and secretion of lipids [1]. Its progressive form, Non-alcoholic steatohepatitis (NASH), Is characterized by fibrosis, increasing oxidative stress, pro-inflammatory cytokines, and activation of stellate cells due to chronic fat accumulation [2]. The later stages of NASH can further progress to cirrhosis, hepatocellular carcinoma, and ultimately death [3]. The NAFLD prevalence has doubled in the last 20 years to 20–30% in the West and 5–18% in Asia [4,5]. NAFLD is, now, the most common chronic liver disease in the West parallel to the rise in obesity and Type II diabetes. Recent reviews highlight that obese individuals and NAFLD patients are at heightened risk of acute toxicity and worsening symptoms induced by everyday drugs such as acetaminophen, losartan, and commonly used anesthetics [6]. These indicate substantial alterations in drug metabolism, regulated by key metabolic enzymes, which have been reported in animal models and human patients [7]. These alterations also imply many of these patients are possibly at risk of complex drug-drug interactions (DDIs), which are a result of the metabolism of two or more drugs simultaneously. Such DDIs can be detrimental via increased drug toxicity and impaired drug efficacy.
To date, few studies have found a significant dysregulation in transcription and activity of multiple CYP450 enzymes from NAFLD liver microsomes and in vitro models [8–10]. CYP450s are the major enzymes involved in Phase I drug metabolism; the CYP450 isoforms CYP3A4, CYP1A1, CYP2B6, CYP2C9, and CYP2E1 contribute to the metabolism of the vast majority of drugs [11]. CYP3A4 is the most abundant CYP enzyme in the human liver metabolizing more than half of commonly prescribed drugs [12], and the activity of CYP3A4 has been shown to be impaired in NAFLD [9] CYP1A, CYP2B6, CYP2C9 and CYP2E1 also account for approximately 9%, 4%, 17%, and 2%, respectively [11]. NAFLD studies have shown a decrease in transcription and activity of CYP1A1 [13], and conflicting results in the regulation of CYP2B6 [9,14] and CYP2C9 [9,15], and a consistent increase in the transcription of CYP2E1 [16]. The latter’s generation of ROS and superoxide anion radicals might play a key role in the progression to NASH, making its upregulation a reliable marker of the disease [17]. Even though the initial dysregulation of the CYP450s as a result of NAFLD has been studied, no studies have yet investigated the drug inducibility of these enzymes in the NAFLD liver.
The expression of CYP450 enzymes is regulated by several transcription factors, which can be activated by drugs, and consequently alter the metabolism of concurrent drugs, causing deleterious DDIs. For instance, the inadvertent activation of the pregnane X receptor (PXR) by Rifampicin can alter the metabolism of troglitazone increasing its conversion into a potentially toxic quinone through CYP3A4, which has caused fatal hepatotoxicity in rare cases [18]. Drug-inducible transcription factors include constitutive androstane receptor (CAR), which induces CYP2B6 and CYP3A4 [19,20], the aryl hydrocarbon receptor (AhR), which induces the CYP1A family [21], and PXR, the main inducer of the CYP3A and CYP2C family [18]. Drug inducers rifampicin, Omeprazole, and Phenytoin are widely used to assess CYP inducibility as Rifampicin activates PXR, Omeprazole activates AhR, and Phenytoin activates CAR exclusively [18,20,21]. While drugs, their profiles, and their interactions with one another are often well studied on healthy subjects, information is scarce on response to drugs in NAFLD patients and the potential vulnerability to DDIs in the fatty liver.
Hepatoma-derived cell lines are commonly used to investigate NAFLD in vitro and include HepG2, Huh7, and HepaRG cells. However, these exhibit an abnormal genotype, lack population diversity, and demonstrate poor liver-specific metabolic competence causing these cell lines to be an insufficient choice in modeling CYP450 drug regulation [2, 22,23]. In contrast, primary human hepatocytes (PHHs) exhibit high functionality relative to the human organ in vivo and are considered reliable for predictive toxicological and pharmacological results [24]. One cause for concern using PHHs is the donor variability which can lead to poor reproducibility and discrepancies [24]. Nevertheless, this can be viewed as beneficial to relate to individual variations in genetic polymorphisms in the human population and recapitulate idiosyncratic responses. Overall, PHHs are the ideal choice for studying and modeling NAFLD and its key stages due to their ability to most accurately mimic the hepatic state [8,24,25].
Our objective, here, is to establish a model conducive to understanding the drug metabolic responses and interactions of the CYP450s in the fatty liver. To this end, we used PHHs to develop an in vitro model of NAFLD, and characterized its phenotype through multiple assays to validate cell health, lipid accumulation and inflammation. We first cultured the PHHs for 7 days under healthy (control) and steatosis inducing conditions, and established optimal hepatocyte phenotype and quantifiable macro-steatosis lipid accumulation. We then characterized the inflammation in this model via a multiplexed cytokine analysis. Then, for the last 48 h of steatosis treatment, we subjected the NAFLD model to drug induction by three prototypical drugs to elucidate the differences in drug metabolic response and risk to potential DDIs between healthy and fatty liver tissues. These experiments indicated – even in a monoculture model using just PHHs and with only a fatty diet as the stimulus – the CYP450 drug metabolism and induction of CYP450 enzymes are significantly altered in the steatotic liver tissues. The latter indicates an elevated risk of DDIs in NAFLD.
2. Materials and methods
2.1. Primary human hepatocyte culture
Cryopreserved PHHs were purchased from the Cell Resource Core at the Massachusetts General Hospital. We used three different donors with varying age, gender and BMI, to account for person-to-person variations (Supporting Table 1). We thawed cryopreserved PHHs and recovered them in a 40% Percoll® (Millipore Sigma, USA) solution in DMEM - Dulbecco’s Modified Eagle Medium (Thermo Fisher Scientific, USA), which was then centrifuged at 100 g for 10 min. We resuspended the formed pellet in seeding media (5 mL), made with William’s Medium E (Millipore Sigma) supplemented with 10% fetal bovine serum (FBS, Sigma, St Louis, MO), 0.5 U/mL insulin, 7 ng/mL glucagon, 20 ng/mL epidermal growth factor, 7.5 ug/mL hydrocortisone, 200 U/mL penicillin, 200 ug/mL streptomycin. The cells were then seeded onto a pre-collagen coated 12-well plate (Corning, New York, NY) at a cell density of 600,000 cells/well and incubated at 37 ◦C and 10% CO2. After 24 h we aspirated the media and applied a 200 µL of 1.25 mg/mL rat tail collagen solution diluted 10x in DMEM and allowed this solution to polymerize at 37 ◦C for one hour before adding the appropriate “Healthy” or “Steatotic” media. We then incubated cultures and replenished media daily for seven days. The “Healthy” media comprised William’s Medium E – including 10 mM D-Glucose – supplemented with 4% Bovine Serum Albumin (Sigma), 500 µU/mL insulin, 7 ng/mL glucagon, 20 ng/mL epidermal growth factor (EGF), 7.5 ug/mL hydrocortisone, 200 U/mL penicillin, 200 ug/mL streptomycin. We formulated the “Steatotic” media based on the “Healthy” media by adding 800 µM oleic acid (OA), 400 µM palmitic acid (PA), and increasing concentration of insulin to 1000µU/mL and D-Glucose to 20 mM.
2.2. Intracellular lipid staining
The main histological characteristic of NAFLD is the intracellular lipid accumulation in hepatocytes. To quantify this phenotype, we used AdipoRed™ (Lonza Group, USA), a fluorescent hydrophobic dye with affinity to lipids. We stained and quantified the Steatotic cultures on days 1, 3, 5, and 7. Briefly, we first washed the cultured cells with PBS and then fixed them with 4% paraformaldehyde in PBS for 15 min at room temperature. Then, we washed the cultures with PBS again and stained with AdipoRed™ according to the manufacturer’s instructions. 10 ng/mL of Hoechst33342 (Thermo Fisher Scientific) was added in the staining solution to observe nuclear size and localization with respect to the lipid vesicles. Next, we washed the cultures with PBS and obtained fluorescent images using an EVOS fluorescence microscope (Thermo Fisher Scientific, USA). The images were transferred to ImageJ (National Institutes of Health, USA) to quantify lipid accumulation based on the total fluorescence intensity, and particle count and size. The temporal size distribution was generated using RStudio (RStudio Team, Boston, MA).
2.3. Urea and albumin secretion
We collected media samples every odd day of the culture and measured the cellular secretion of urea and albumin. We performed a colorimetric BUN assay using the Stanbio™ BUN Diagnostic Set (Stanbio Laboratories, Cardiff, Wales) following the manufacturer’s protocol, to measure urea. For albumin secretion, we used a human ALB solid-phase sandwich ELISA with the Invitrogen Albumin Human ELISA kit (Thermo Fisher Scientific) following the manufacturer’s protocol.
2.4. Cytokine profiling
We collected supernatant samples on days 1 and 7 from all cultures to measure cytokine release. To this end, we used the Cytokine Human Magnetic 30-Plex Panel (Thermo Fisher Scientific) for Luminex™ platform (Thermo Fisher Scientific) and quantified cytokines, chemokines and growth factors in the culture supernatant following the manufacturer’s protocol. We diluted samples with the provided assay diluent and then added the samples to each well along with standards and controls. We analyzed the samples using a Luminex™ MAGPIX instrument to determine concentration of samples with the manufacturer provided software.
2.5. Drug treatment and transcriptional induction of drug metabolism
We exposed all cultures to drug inducers on day 5 to compare the induction of CYP450 enzymes and their regulation via the nuclear receptors of interest. Specifically, we used either 25 µM Rifampicin, 50 µM Omeprazole, 50 µM Phenytoin dissolved in DMSO as inducers in the media. Accordingly, we also introduced 0.5% DMSO in control (vehicle) group media. Rifampicin, Omeprazole and Phenytoin are prototypical inducers of PXR, AHR and CAR respectively. In general, we chose well established concentrations for all inducers in the range where they provide a near maximal or significant induction. The Rifampicin dose (25 µM) is based on our recent work analyzing the induction and regulation of CYP3A4 and PXR in different hepatic systems including human hepatocytes, iPSC derived hepatocyte and others [22]. The Omeprazole dose (50 µM) is in the range where primary human hepatocytes were previously shown to have a high induction of CYP1A1 [26]. The Phenytoin dose (50 µM), on the other hand, has been used in studies of induction of CYP2B6 in human hepatocytes and several cell lines with substantial increase in expression [20]. We normalized the response of all samples to that of the vehicle group with 0.5% DMSO. DMSO is known to be a weak transcriptional inducer of multiple CYP450 enzymes at this concentration. The drug treatment was replenished on day 6, and the cells were lysed for gene expression quantification on day 7.
2.6. RT-qPCR analysis
We lysed the cells using 400 µL of TRIzol reagent (Invitrogen). We then isolated the total RNA from each lysed sample through a phase separation by mixing the sample in TRIzol reagent with 70 µL of 1-Bromo-3-Chloropropane (Sigma Aldrich) and centrifuging at 15,000 g for 10 min. Upon centrifugation we mixed the aqueous solution with one volume of 70% EtOH. We further purified the sample using a PureLink RNA Mini Kit (Life Technologies) according to the manufacturer instructions and eluted the samples in nuclease-free water.
We used a NanoDrop 2000 (Thermo Fisher Scientific) to assess the quality and concentration of the RNA content of each sample. Approximately 750 ng of RNA were converted into cDNA using the iScript cDNA synthesis kit (BioRad, CA) following the manufacturer instructions. Afterwards, we diluted the cDNA samples 5X with nuclease-free water. We, then, performed the qRT-PCR reactions using PowerUp SYBR green master mix (Life Technologies) in 10 µL reactions on 384well plates on the Viia7 Real-Time PCR system (Applied Biosystems, CA) following the manufacturer’s instructions and using primers specific to each target gene of interest (Supporting Table S2). All primers were designed to have exon junction products with a melting temperature of 60ºC and minimal 3′ match. We quantified the relative expression through the comparative CT method, normalizing all the samples to GAPDH as housekeeping gene.
2.7. Data and statistical analysis
The data and statistical analysis presented comply with the recommendations on experimental designs and analysis in pharmacology. All data represent three human hepatocyte donors with at least 3 independent cultures as biological replicates, each with duplicates as technical replicates unless otherwise noted in the figure caption. Data are presented as mean ± standard error of the mean (SEM). After confirming normal distribution of the data through a Kolmogorov-Smirnov test, all data was analyzed through a Welch’s t-test to determine statistical significance, where the P-value thresholds were defined as ns: P > 0.05, *: P < 0.05, **: P < 0.01. Statistical analysis was performed using GraphPad Prism 8 version 8.4.1 (GraphPad Software, San Diego, CA, USA).
3. Results
3.1. Primary human hepatocyte culture
We first selected three PHH donor cell lots based on their ability to attach efficiently to collagen-coated plates and display consistent polarized morphology in collagen-sandwich culture for 7 days (Fig. 1A). Our initial media optimization studies indicated EGF, hydrocortisone and glucagon are necessary supplements for stable urea secretion (Supporting Fig. S1). Overall, the cultures maintained high and stable urea secretion (Fig. 1B) where the Healthy cultures of Donor 1 displayed decreased urea production from day 5 onward. The albumin synthesis was well maintained overall and for all donors (Fig. 1C).
Fig. 1.

Morphology and maintenance of hepatic phenotype in the in vitro NAFLD model and healthy controls overtime. (A) Representative phase contrast bright field images of healthy and steatotic (fatty) hepatocytes over 7 days of culture in corresponding media. Scalebar: 400 µm. (B) Daily Urea and Albumin secretion of each PHH donor over the healthy and steatotic culture period. Results are presented as daily mean ± SEM (n = 4 biological replicates for each PHH Donor).
3.2. Visualization and quantification of steatosis
We observed, via phase-contrast imaging, a significant increase of lipid droplets in the cell cytoplasm over 7 days in the Steatotic culture while the Healthy cultures remained lean with minimal lipid accumulation (Fig. 1A). We corroborated this intracellular lipid accumulation in the Steatotic groups via fluorescent microscopy using AdipoRed™ staining. We observed a monotonic temporal increase in the size and quantity of lipid droplets in hepatocytes (Fig. 2A). We quantified the total intensity of AdipoRed™ staining, which showed a significant increase in lipid accumulation from day 1–5 for all donors (Fig. 2B), and a non-significant increase in day 7 of steatotic culture. Furthermore, a size distribution analysis confirmed that after day 5 the lipid-droplets transition into macro-steatotic vesicles, as they become larger than the nuclei (Fig. 2C).
Fig. 2.
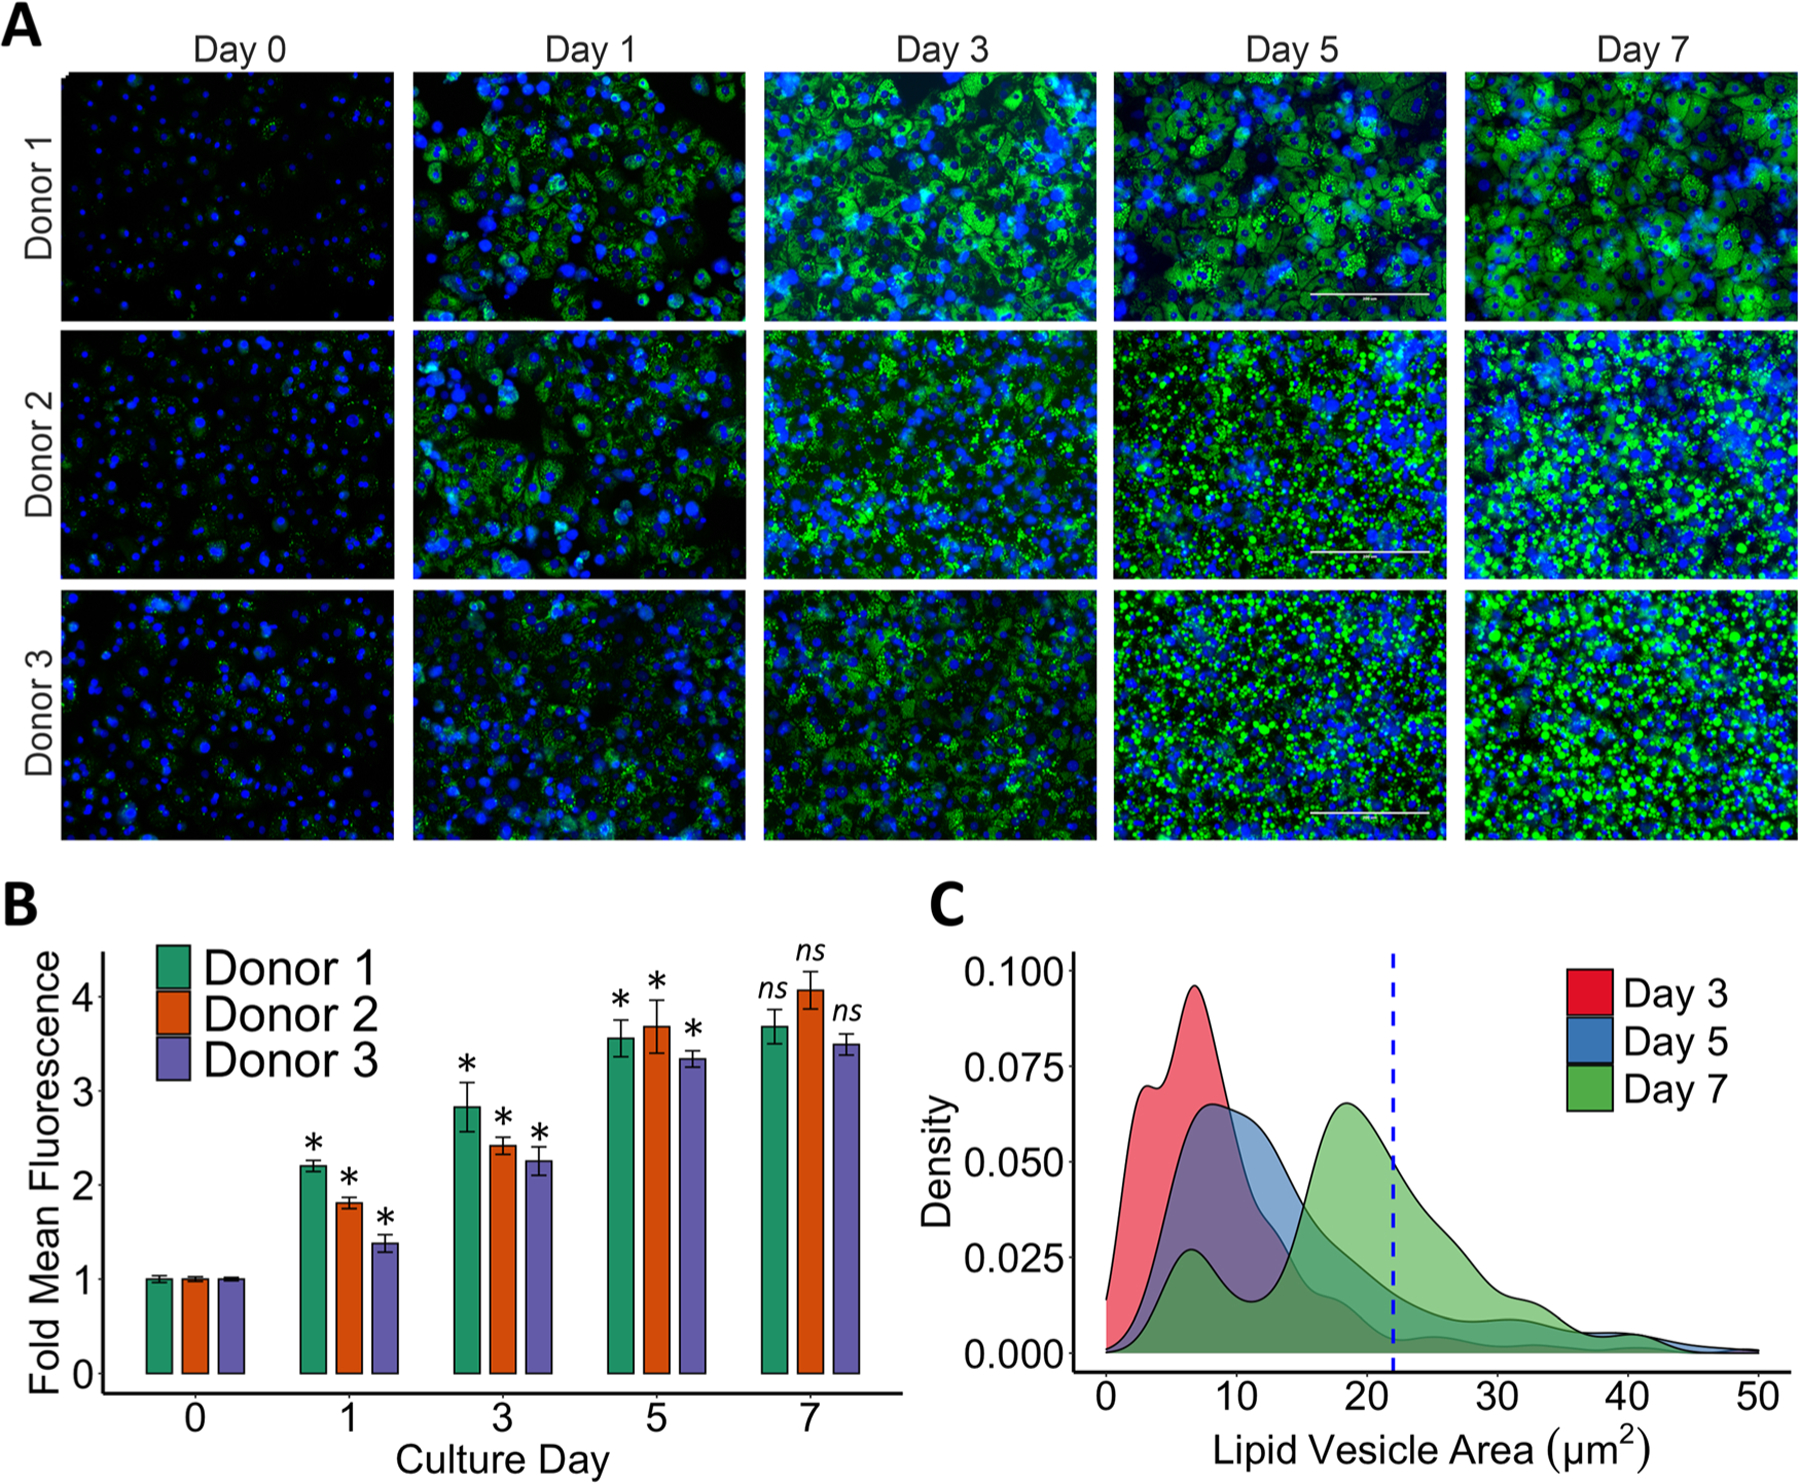
Staining and quantification of intracellular lipid accumulation overtime. (A) Fluorescent images of AdipoRed® staining (green) and nuclear Hoechst 33342 dye (blue) after 1, 3, 5 and 7 days of lipid accumulation. Scalebar: 200 µm. (B) Total mean fluorescence intensity (MFI) quantification of green channel normalized to day 0 for each donor. Results are presented as daily mean ± SEM for nine independent cultures (n = 3 biological replicates for each donor). (C) Lipid vesicle size distribution after 3, 5 or 7 days of steatotic culturing for all donors. Dotted blue line represents the mean size of the hepatocyte nuclei measured from blue channel. Welch’s t-tests were used to determine statistical significance of mean fluorescence compared to the previous day’s culture for each donor. Abbreviation: ns P > 0.05, *P < 0.05, ** P < 0.01. (For interpretation of the references to colour in this figure legend, the reader is referred to the web version of this article.)
3.3. Cytokine secretion
To further assess the establishment of the NAFLD model, we compared the cytokine secretion of Healthy and Steatotic cultures. Specifically, we analyzed the culture media from day 1 and day 7 of all cultures using the Invitrogen 30-Plex Cytokine panel for Luminex platform. Of the over 30 included targets, the cytokines MCP-1, VEGFa, IP10, IL-8, IL-1ra and IL-6 showed a definitive signal. However, signal for IL-6 surpassed the standard range in the Luminex assay. We thus also measured the secretion of IL-6 via ELISA which did not show significant changes between Healthy and Steatotic cultures (Supporting Fig. S2 A). IL-6 secretion was also not altered from day 1 to day 7 in Healthy cultures (Supporting Fig. S2B). The pro-inflammatory MCP-1 and IP-10 were highly elevated in the Steatotic culture compared to the Healthy control and the initial state (Fig. 3B–C, Supporting Fig. S3B-C). VEGFa showed a significantly higher secretion in the Steatotic culture compared to the Healthy control on day 7, but not the initial state (Fig. 3A, Supporting Fig S3A). We measured a significant increase in secretion of the anti-inflammatory cytokine IL-1ra in the Healthy cultures from day 1 to day 7 (Supporting Fig. S3D). A similar increase did not occur for the steatotic cells, and their IL-1ra secretion was significantly lower than Healthy ones on day 7 of culture (Fig. 3D). Overall, the Steatotic cultures showed a pro-inflammatory profile, a common characteristic of NAFLD progression.
Fig. 3.

Secretion of inflammatory cytokines in the in vitro NAFLD model compared to healthy controls after 7 days of culture. (A) VEGF. (B) MCP-1. (C) IP-10. (D) IL-1ra. Cytokines were measured via a Luminex™ magnetic bead panel. Regulation of the same cytokines in healthy controls from Day 1 to Day 7 are presented in Supporting Fig. S3. Data are presented as mean ± SEM (n = 9, 3 donors with 3 biological replicates or more for each comparison). A Welch’s t-test was used to determine statistical significance. Statistical details can be found in Supporting Table S3. Abbreviation: ns P > 0.05, *P < 0.05, ** P < 0.01.
3.4. CYP450 expression and drug induction
Once we established the key morphological and secretory characteristics of an early NAFLD-like profile in Steatotic cultures, we first assessed the transcriptional profile of CYP450 enzymes (CYP1A1, 2B6, 2C9, 2E1 and 3A4) on day 7 in Steatotic cultures compared to the Healthy controls. Thereafter, we used drug inducers to elucidate the DDI propensity of steatotic hepatocytes using the same analysis. Specifically, we compared the transcription of the CYP450 enzymes in Steatotic cultures to Healthy controls when induced with the enzyme specific inducers. We analyzed and report these induction studies such that the fold-induction in each group is normalized to the enzymatic expression in the non-induced Healthy vehicle control group (Healthy controls with 0.5% DMSO).
The Steatotic cultures showed a severe downregulation of CYP1A1 (to 0.2-fold) when hepatocytes accumulated macro-vesicular lipid droplets (Fig. 4A). Still, the mechanism of induction of CYP1A1 through Omeprazole appeared intact. Both the Healthy and Steatotic cultures showed high inducibility of 28.4 and 18.3-fold by Omeprazole, respectively (Fig. 5A). Furthermore, the expression of the transcriptional factor AHR did not significantly change between Steatotic and Healthy cultures (Fig. S4).
Fig. 4.

Transcriptional dysregulation of CYP450 enzymes in the NAFLD model compared to Healthy controls. Fold values were calculated via ddCT comparative method of RT-PCR data. Results are presented as mean ± SEM (n = 9, 3 donors with 3 biological replicates each, or more for each comparison). A Welch’s t-test was performed to determine statistical significance. Statistical analysis details can be found in Supporting Table S4. Abbreviation: ns P > 0.05, *P < 0.05, ** P < 0.01
Fig. 5.

Drug induction of CYP450 enzymes’ transcription in the in vitro NAFLD model (green) compared to Healthy controls (Blue). Transcriptional regulation of (A) CYP1A1 with 50 µM Omeprazole, (B) CYP2B6 with 50 µM Phenytoin, (C) CYP2C9 with 25 µM Rifampicin and (D) CYP3A4 with 25 µM Rifampicin. Results are presented as box and whiskers (n = 9, 3 donors with 3 biological replicates each, or more for each comparison). A Welch’s t-test was performed to determine statistical significance. Statistical details can be found in Supporting Table S5. Abbreviation: Ome., Omeprazole. Rif., Rifampicin. Phe., Phenytoin. ns P > 0.05, *P < 0.05, ** P < 0.01. (For interpretation of the references to colour in this figure legend, the reader is referred to the web version of this article.)
We found a significant increase in CYP2E1 expression of 5.2-fold in our Steatosis model compared to the Healthy cultures (Fig. 4). Similarly, CYP2B6 showed a significant 5.1-fold increase between the two groups (Fig. 4). Moreover, the transcription of CYP2B6 was inducible with Phenytoin for both groups where the Healthy culture was induced to 3.1-fold and the Steatotic culture to 23.7-fold (Fig. 5B). This suggests a higher risk for CYP2B6 related DDIs, and likely an elevated activity of the transcription factor CAR. We thus measured the expression of CAR which was elevated in the Steatotic group compared to Healthy controls but not at a statistically significant level (Fig S4).
We measured no significant changes in the CYP2C9 basal expression between the Steatotic and Healthy cultures. (Fig. 4). This enzyme was slightly inducible by Rifampicin for both Steatotic and Healthy groups, to 2.7 and 4.9-fold respectively (Fig. 5C). We also found a nonsignificant decrease to 0.52-fold for the basal expression of CYP3A4 in the Steatotic groups compared to the Healthy cultures (Fig. 4). Both the Healthy and Steatotic groups showed significant induction of CYP3A4 to 13.9 and 22.0-fold respectively with Rifampicin (Fig. 5D). These suggest the Rifampicin mediated CYP3A4 induction is unchanged in steatotic hepatocytes.
4. Discussion
The effect of NAFLD on the liver drug metabolism, especially when taking multiple drugs is still relatively unknown. Accordingly, we created an NAFLD model to assess the expression and drug-induced regulation of the major drug metabolizing enzymes and investigate the DDI vulnerability of the fatty liver. To our knowledge, this is the first report of nuclear factor activation and drug induction of CYP450 enzyme expression in an in vitro primary human hepatocyte NAFLD model.
The early stage of the NAFLD is characterized by the gradual accumulation of intracellular lipid vesicles in hepatocytes. These vesicles result from both increased de novo lipogenesis due to elevated glucose and insulin levels, and free fatty acid circulation [27]. The accumulation is expected to be benign and not alter the phenotype and function of hepatocytes [28]. We recapitulated this phenotype by administering a Steatotic media - including free fatty acids oleic acid and palmitic acid, and elevated glucose and insulin concentrations similar to the levels in NAFLD patients [24] -, to sandwich cultured PHHs over 7 days. We first established this in vitro model by qualitative observation via phase-contrast imaging. The hepatocytes in the Steatotic group showed increasing lipid accumulation while the Healthy group remained free of lipids over 7 days. Importantly, despite the lipid accumulation, we observed intact morphology and polarization of hepatocytes throughout 7 days.
Detoxification is a vital liver function, where ammonia produced during the deamination of amino acids is converted into non-toxic urea in the liver [29]. Similarly, albumin - the most abundant blood protein - is synthesized exclusively in the liver. Accordingly, steady secretion of albumin and urea are considered important markers of hepatic function. In our model, albumin and urea secretion were comparable in Healthy and Steatotic groups. Together with the morphological assessment, these imply the early lipid accumulation is indeed benign for the basic hepatic functionality in our model as expected [30].
We, then, used fluorescent staining to elucidate the progressive temporal increase of intracellular lipid accumulation qualitatively and quantitatively. This confirmed the temporal increase in lipid accumulation for the Steatotic cultures, and indicated a growth of the lipid vesicles. Specifically, we observed a significant fraction of lipid droplets clearly surpassed the size of cell nuclei from day 5 to 7 - a clinical indication of transition from a micro-vesicular to macro-vesicular steatosis where those droplets substantially displace the nuclei [31]. The quantitative analysis revealed a saturation in lipid accumulation, in steatotic hepatocytes, beyond day 5. Clinically, this could be the tipping point where the benign lipid accumulation reaches its limit without injuring hepatocytes. Any further external insult such as inflammation and oxidative stress can potentially alter this phenotype towards a detrimental injurious state.
The transition from the benign stages of NAFL to NASH is expected to be accompanied by changes in pro and anti-inflammatory cytokine secretion. Based on the secretory analysis (albumin and urea) we showed the hepatic functionality in our model was not impaired by simple steatosis. We, thus, posit that our in vitro NAFLD model is still in the benign state even on day 7 where a transition to macrosteatosis was observed. Still, we wanted to address the question how secreted cytokines are regulated for highly steatotic hepatocytes in isolation, i.e. without the non-parenchymal cells. We measured significant increases in pro-inflammatory cytokines MCP-1, IP-10, and VEGFa.
Of these, MCP-1 promotes the migration of inflammatory cells by chemotaxis and integrin activation [32], and research shows MCP-1 deficiency alleviates insulin resistance and hepatic steatosis [33]. On the other hand, IP-10 plays a role in the pathogenesis of steatohepatitis via induction of inflammation, oxidative stress, and lipogenesis [34]. A recent study reports lipid-accumulated hepatocytes release extracellular vesicles (EVs) containing IP-10 which has a key role in the recruitment of macrophages in NAFLD [35]. This renders IP-10 as a potential therapeutic target for the treatment of NASH, progressive liver injury and insulin resistance [36]. VEGFa, also known to mediate inflammation, has been reported to be elevated in NASH patients [37] Interestingly, we measured a significant decrease in the secretion of the anti-inflammatory cytokine IL-1ra in the steatotic cultures. IL-1ra is normally highly expressed in healthy livers [38]. Its downregulation in highly steatotic hepatocytes suggests a compromised anti-inflammatory response as a sign of the disease, and again, a potential initial progression to NASH. Several studies propose that modulation of IL-1ra could be a potential therapeutic target in mediating and controlling the progression of inflammation in NAFLD patients [39]. Overall, the regulation of cytokines secretion - in our NAFLD model - shows an early yet clear transition to an inflammatory state. This is despite the lack of non-parenchymal cells or external inflammatory stimuli. Such transition towards inflammation coincided with signaling profile of patients. This suggests a potential use of this model to study therapeutics targeting the inflammation pathways we identified in this single cell model.
The expression and activity of CYP450s have been shown to be dysregulated in human NAFLD livers [40] and in some in vitro models [8,9]. This dysregulation results in altered metabolism of xenobiotics, ultimately leading to changes in bioavailability, a decrease of pharmacotherapeutic effect and/or generation of toxic metabolites, and oxidative stress. These adverse effects could further be exacerbated when patients use several drugs simultaneously. Specifically, the activation of nuclear receptors by these drugs could potentially lead to severe DDIs in NAFLD patients compared to healthy subjects. As such, understanding the modulation of CYP450s and their induction in the fatty liver during concurrent use of drugs is critical to the development of safe and efficacious new drugs and their dosing in patients with NAFLD.
We thus studied the regulation of the transcriptional profile of five CYP450 enzymes (CYP1A1, CYP2B6, CYP2C9, CYP2E1, and CYP3A4) in steatotic cultures compared to the healthy ones. Furthermore, we also measured the corresponding changes in basal expression of three transcriptional factors (PXR, AHR, and CAR) which are known to activate the transcription of these enzymes. Overall, the basal expression of the five enzymes in our Steatotic cultures agree well with previous studies. Specifically, we observed a downregulation of the basal expression of CYP1A1, and an upregulation of CYP2E1 and CYP2B6 genes in line with previous findings [9,41]. Of the three transcriptional factors, we only observed an increase in the steatotic basal expression of CAR, which was not statistically significant. CAR is known to regulate the transcription of both CYP2B6 and CYP3A4. Overall, these changes indicate potential issues for patients who use drugs metabolized through these enzymes. This dysregulation could be further exacerbated with an additional drug inducer.
We perturbed our model via three prototypical drug inducers, Rifampicin, Omeprazole, and Phenytoin, to further elucidate the dysregulation of CYP450 enzymes in NAFLD. These inducers are commonly used to investigate drug-mediated regulation of specific CYP450 enzymes [42]. Each drug activates a specific transcription factor in hepatocytes, which causes it to be translocated into the nucleus, where it binds to CYP450 promoters to induce transcription. Rifampicin is a well-known activator of the PXR transcription factor, which induces the upregulation of CYP3A4 [43]. Omeprazole activates the AHR transcription factor, which upregulates CYP1A1 [21]. And finally, Phenytoin is a CAR-specific activator, and upregulates both CYP2B6 and CYP3A4 [20]. We note that Phenobarbital is a more common and stronger activator of CAR, but it presents promiscuity towards PXR activation. We, thus used Phenytoin as it activates CAR exclusively, and not PXR [20].
The decrease of CYP1A mRNA, protein level, and activity have been consistently reported for various diseases including NAFLD, NASH, and cirrhosis in patients [7,9]. Moreover, in vitro and in vivo models have elucidated CYP1A’s role in the metabolism of oleic acid and production of ROS [44]. This relationship hints that the impairment of this enzyme might be related to the increase in the inflammatory response in advanced NAFLD. Furthermore, animal studies indicate CYP1A1 to have protective effects against lipid-droplet accumulation induced by a Western diet [45]. Despite its severe downregulation in highly steatotic hepatocytes, the mechanism of induction of CYP1A1 through Omeprazole appeared to be intact. This suggests the disruption of the expression of CYP1A1 during NAFLD is not related to the AHR drug response, which coincides with stability of AHR transcripts. As the activation of AHR can still induce the expression of CYP1A1 during steatosis, we hypothesize that a strong AHR inducer, like Omeprazole, might alleviate lipid accumulation, cytokine release or ROS production in a similar NAFLD model.
CYP2B6 accounts for 2–10% of hepatic CYP enzymes and is responsible for ~8% of the metabolism of commercial drugs including efavirenz, the frontline therapeutic for HIV [46]. Recent studies show CYP2B6 is significantly elevated in NAFLD patients [9]. We also observed a highly elevated CYP2B6 expression in steatotic hepatocytes. Perhaps more importantly, the expression of CYP2B6 was also much more inducible with Phenytoin in steatotic hepatocytes than in healthy ones. Since the expression of CYP2B6 is regulated through the CAR transcription factor, we hypothesized that steatotic hepatocytes might have an elevated expression of CAR. An elevated CAR expression can elucidate the elevation in both the basal expression and Phenytoin inducibility of CYP2B6 in steatotic hepatocytes. Nevertheless, while the expression of CAR was elevated in the Steatotic group, this elevation was not statistically significant. This indicates that the elevated basal and induced expression of CYP2B6 by Phenytoin in Steatotic groups is not due to increased CAR expression but rather an increased activation of CAR. Overall, our results suggest that CYP2B6 induction by common drugs can lead to severe DDIs when used with a second or third drug metabolized by this enzyme.
CYP2C9 is a major drug metabolic enzyme with the second highest expression level in the liver CYP450 content [47]. CYP2C9 expression has been found to be unaltered in NAFLD patients with benign steatosis [9,40,48]. We, also measured no significant differences in the basal expression of CYP2C9 between Steatotic and Healthy cultures. Nevertheless, we observed a slightly higher inducibility of CYP2C9 by Rifampicin in Steatotic hepatocytes indicating a potentially higher likelihood of DDIs through this enzyme in NAFLD patients. Further studies analyzing protein level and enzymatic activity are necessary to assess any altered risk of DDIs in fatty liver, related to CYP2C9.
CYP2E1 plays an outsized role in the metabolism of ethanol, fatty acids, and common drugs such as acetaminophen. It is implicated in the pathogenesis of toxic liver damage, and alcoholic and non-alcoholic fatty liver disease, due to its role in metabolizing excess linoleic and arachidonic acid to generate ω-hydroxylated fatty acids [16]. We found a significant increase in CYP2E1 expression in our Steatosis model. This upregulation has been reported in multiple studies suggesting CYP2E1 upregulation as a potential marker for fatty liver disease [49]. This has also been linked to elevated oxidative stress and ROS production [17], which suggests CYP2E1 also contributes to the transition into steatohepatitis. However, the steatotic upregulation of CYP2E1 might be an adaptation to lipid overload providing an alternative pathway to peroxisomal and mitochondrial B-oxidation, suggesting that blocking this enzyme could potentiate steatosis on top of reducing oxidative stress.
In our Steatotic model, we observed a non-significant decrease of CYP3A4 expression. This coincides with previous animal and patient sample studies with non-significant decreases in the CYP3A4 expression in steatosis despite significant decreases in its activity [7,9]. Nevertheless, few reports indicate a temporal regulation of CYP3A4 in fatty rat models with early downregulation, intermediate term upregulation, and eventual downregulation again for extended periods (>12 weeks). This indicates a further need to fully dissect the regulation of highly involved enzymes in NAFLD. Beyond basal expression, we observed the inducibility of CYP3A4 via Rifampicin was well retained for all groups. Rifampicin regulates CYP3A4 expression via the PXR nuclear transcription factor. We observed PXR to be well conserved in Healthy and Steatotic cultures which corroborates the retention of the inducibility of CYP3A4 in the Steatotic group.
It is important to note that all the data we reported in this study - on both the Phase I drug metabolic enzymes (i.e., the CYP450s) and the transcriptional factors - are at the mRNA expression level. While the central dogma of biology dictates that “DNA makes RNA, and RNA makes protein”, there is often considerable uncertainty around the correlation between the levels of RNA and the levels of the corresponding proteins [50,51]. Further, the activity of these proteins might not always exactly correspond to the levels of the proteins due to several biological and physical factors. Thus, a significant shortcoming of the current study is the lack of analysis of the protein levels and their activity. Still, a recent study – investigating the correlation of mRNA and protein levels for differentially expressed mRNAs rather than genome wide correlations – indicates that “genes whose transcription is modified by experimental manipulation (i.e., induction by drugs, lipid accumulation or a combination of the two in our study) are more likely to show concordant protein expression across these same experimental conditions, compared to genes whose transcription is not strongly influenced by the experimental manipulation” (paraphrased from Koussounadis et al. [50]). A recent review further elaborates that “on bulk level and for steady-state conditions protein levels are largely determined by transcript concentrations” (paraphrased from Liu et al. [52]) Accordingly, we posit that changes we observed at the mRNA level – for the enzymes we studied - have considerable likelihoods of concordance at the protein level. Nevertheless, a similar analysis does not exist for concordance between protein levels and activity, and further each mRNA - protein pair can have a different concordance level not covered by the cited studies. Accordingly – despite multiple recent reports lending increasing credibility to mRNA level studies for predicting protein level changes [50,52] – we aim to follow up the studies we presented here both at the protein expression and activity level to further investigate the potential risk of drug-drug interactions in the fatty liver.
5. Conclusions
While the prevalence of NAFLD rises over 25% worldwide, the concomitant prescription of drugs increases abreast [53]. Almost 1 in 4 adults now use at least 3 prescription drugs simultaneously in the United States [54]. These reflect the dire necessity to understand the propensity of the fatty liver to changes in drug metabolism and the subsequent DDIs. The preceding analysis starts to shed some light onto this question where we first observed important changes in, especially CYP1A1, 2B6 and 2E1 enzymes. This indicates the normal dosage of drugs that are catalyzed by these enzymes should potentially be altered for NAFLD patients depending on the regulation of the enzyme. Of these, CYP2B6 was also much more highly inducible in the Steatotic group indicating a high probability of DDIs in NAFLD patients through this enzyme. While not as elevated, CYP2C9 inducibility via Rifampicin was also higher in Steatotic groups compared to healthy controls. Together, these results indicate a) altered drug toxicity and efficacy for NAFLD patients even when they are taking one drug and b) likely a higher propensity of NAFLD patients to DDIs compared to healthy subjects.
We note that our model did not include any non-parenchymal liver cells such as the Kupffer and Stellate cells which are highly involved in the NAFLD progression, especially into the more inflamed state of NASH and further into cirrhosis. We also did not include any external inflammatory stimuli. Still, our observations show even in benign stages of NAFLD, with only excessive lipid accumulation, significant alterations in the gene expression of drug metabolic enzymes and their inducibility occur. We note, however, that another shortcoming of the current study is that we have not studied the corresponding protein levels and activity of the same enzymes which might not always exactly reflect the changes in gene expression. Still, we posit that the results here warrant further studies where the multicellular and inflammatory aspects of these alterations are also investigated to create a more complete picture of the risk that NAFLD patients face in terms of drug metabolism and drug-drug interactions. These expanded studies and the confirmation of the changes in drug metabolism through additional assays of enzymatic activity and protein levels will be the subject of our future investigation.
Supplementary Material
Acknowledgments
This research was supported by grants from the National Institutes of Health (NIH 5R01EB023812, NIH 5R01HL145031, NIH 1R21GM136002, NIH R21AI142415, and NIH R01DK114506) and a Massachusetts General Hospital (MGH) Executive Committee on Research (ECOR) Interim Support Fund. We also acknowledge the support and use of facilities at the Proteomics & Genomics Core Shared Facility, Morphology and Imaging Shared Facility, Regenerative Medicine Shared Facility provided at the Shriners Hospital for Children - Boston.
Abbreviations:
- NAFL
Non-Alcoholic Fatty Liver
- NAFLD
Non-Alcoholic Fatty Liver Disease
- NASH
Non-Alcoholic Steatohepatitis
- PHH
Primary Human Hepatocyte
- DMSO
Dimethylsulfoxide
- RT-PCR
Real time Polymerase Chain Reaction
- CYP450
Cytochrome P450
- AHR
Aryl Hydrocarbon Receptor
- CAR
Constitutive Androstane Receptor
- PXR
Pregnane X Receptor
- Ome
Omeprazole
- Rif
Rifampicin
- Phe
Phenytoin
- VEGFa
Vascular Endothelial Growth Factor A
- MCP-1
Monocyte Chemoattractant Protein-1
- IP10
Interferon Gamma-Induced Protein 10
- Il-1ra
Interleukin 1 Receptor Agonist
Footnotes
CRediT authorship contribution statement
Camilo Rey-Bedon: Conceptualization, Methodology, Investigation, Formal analysis, Visualization, Writing – original draft, Writing – review & editing Peony Banik: Investigation, Methodology, Writing – original draft. Aslihan Gokaltun: Investigation, Writing – review & editing. O. Hofheinz: Investigation. Martin L. Yarmush: Supervision, Project administration, Resources, Funding acquisition, Resources, Writing – review & editing. M. Korkut Uygun: Resources, Supervision Writing – review & editing. O. Berk Usta: Conceptualization, Methodology, Formal analysis, Visualization, Writing – original draft, Writing – review & editing, Resources, Supervision, Project administration, Funding acquisition.
Conflict of interest statement
Dr. Uygun has a financial interest in Organ Solutions, a company focused on developing organ preservation technology. Other authors declare no financial interest related to this study. Interests of all authors are managed by the MGH and Partners Health Care in accordance with their conflict of interest policies.
Appendix A. Supporting information
Supplementary data associated with this article can be found in the online version at doi:10.1016/j.biopha.2021.112377.
References
- 1.Kucera O, Cervinkova Z, Experimental models of non-alcoholic fatty liver disease in rats, World J. Gastroenterol 20 (26) (2014) 8364–8376. [DOI] [PMC free article] [PubMed] [Google Scholar]
- 2.Boeckmans J, Natale A, Buyl K, Rogiers V, De Kock J, Vanhaecke T, Rodrigues RM, Human-based systems: mechanistic NASH modelling just around the corner? Pharm. Res 134 (2018) 257–267. [DOI] [PubMed] [Google Scholar]
- 3.Bhatia LS, Curzen NP, Byrne CD, Non-alcoholic fatty liver disease and vascular risk, Curr. Opin. Cardiol 27 (4) (2012) 420–428. [DOI] [PubMed] [Google Scholar]
- 4.Benedict M, Zhang X, Non-alcoholic fatty liver disease: an expanded review, World J. Hepatol 9 (16) (2017) 715–732. [DOI] [PMC free article] [PubMed] [Google Scholar]
- 5.Younossi ZM, Stepanova M, Rafiq N, Henry L, Loomba R, Makhlouf H, Goodman Z, Non-alcoholic steatofibrosis independently predicts mortality in non-alcoholic fatty liver disease, Hepatol. Commun 1 (5) (2017) 421–428. [DOI] [PMC free article] [PubMed] [Google Scholar]
- 6.Massart J, Begriche K, Moreau C, Fromenty B, Role of non-alcoholic fatty liver disease as risk factor for drug-induced hepatotoxicity, J. Clin. Transl. Res 3 (1) (2017) 212–232. [DOI] [PMC free article] [PubMed] [Google Scholar]
- 7.Merrell MD, Cherrington NJ, Drug metabolism alterations in non-alcoholic fatty liver disease, Drug Metab. Rev 43 (3) (2011) 317–334. [DOI] [PMC free article] [PubMed] [Google Scholar]
- 8.Kostrzewski T, Cornforth T, Snow SA, Ouro-Gnao L, Rowe C, Large EM, Hughes DJ, Three-dimensional perfused human in vitro model of non-alcoholic fatty liver disease, World J. Gastroenterol 23 (2) (2017) 204–215. [DOI] [PMC free article] [PubMed] [Google Scholar]
- 9.Fisher CD, Lickteig AJ, Augustine LM, Ranger-Moore J, Jackson JP, Ferguson SS, Cherrington NJ, Hepatic cytochrome P450 enzyme alterations in humans with progressive stages of non-alcoholic fatty liver disease, Drug Metab. Dispos 37 (10) (2009) 2087–2094. [DOI] [PMC free article] [PubMed] [Google Scholar]
- 10.Cobbina E, Akhlaghi F, Non-alcoholic fatty liver disease (NAFLD) - pathogenesis, classification, and effect on drug metabolizing enzymes and transporters, Drug Metab. Rev 49 (2) (2017) 197–211. [DOI] [PMC free article] [PubMed] [Google Scholar]
- 11.Zanger UM, Turpeinen M, Klein K, Schwab M, Functional pharmacogenetics/ genomics of human cytochromes P450 involved in drug biotransformation, Anal. Bioanal. Chem 392 (6) (2008) 1093–1108. [DOI] [PubMed] [Google Scholar]
- 12.Anzenbacher EAP, Cytochromes P450 and metabolism of xenobiotics, Cell. Mol. Life Sci 58 (2001) 737–747. [DOI] [PMC free article] [PubMed] [Google Scholar]
- 13.Donato MT, Lahoz A, Jimenez N, Perez G, Serralta A, Mir J, Castell JV, Gomez-Lechon MJ, Potential impact of steatosis on cytochrome P450 enzymes of human hepatocytes isolated from fatty liver grafts, Drug Metab. Dispos 34 (9) (2006) 1556–1562. [DOI] [PubMed] [Google Scholar]
- 14.Gao J, Zhou J, He XP, Zhang YF, Gao N, Tian X, Fang Y, Wen Q, Jia LJ, Jin H, Qiao HL, Changes in cytochrome P450s-mediated drug clearance in patients with hepatocellular carcinoma in vitro and in vivo: a bottom-up approach, Oncotarget 7 (19) (2016) 28612–28623. [DOI] [PMC free article] [PubMed] [Google Scholar]
- 15.Li H, Clarke JD, Dzierlenga AL, Bear J, Goedken MJ, Cherrington NJ, In vivo cytochrome P450 activity alterations in diabetic non-alcoholic steatohepatitis mice, J. Biochem. Mol. Toxicol 31 (2) (2017), e21840. [DOI] [PMC free article] [PubMed] [Google Scholar]
- 16.Abdelmegeed MA, Banerjee A, Yoo SH, Jang S, Gonzalez FJ, Song BJ, Critical role of cytochrome P450 2E1 (CYP2E1) in the development of high fat-induced non-alcoholic steatohepatitis, J. Hepatol 57 (4) (2012) 860–866. [DOI] [PMC free article] [PubMed] [Google Scholar]
- 17.Aubert J, Begriche K, Knockaert L, Robin MA, Fromenty B, Increased expression of cytochrome P450 2E1 in non-alcoholic fatty liver disease: mechanisms and pathophysiological role, Clin. Res. Hepatol. Gastroenterol 35 (10) (2011) 630–637. [DOI] [PubMed] [Google Scholar]
- 18.Willson TM, Kliewer SA, PXR, CAR and drug metabolism, Nat. Rev. Drug Discov 1 (4) (2002) 259–266. [DOI] [PubMed] [Google Scholar]
- 19.Westerink WM, Schoonen WG, Cytochrome P450 enzyme levels in HepG2 cells and cryopreserved primary human hepatocytes and their induction in HepG2 cells, Toxicol. Vitr 21 (8) (2007) 1581–1591. [DOI] [PubMed] [Google Scholar]
- 20.Wang H, Faucette S, Moore R, Sueyoshi T, Negishi M, LeCluyse E, Human constitutive androstane receptor mediates induction of CYP2B6 gene expression by Phenytoin, J. Biol. Chem 279 (28) (2004) 29295–29301. [DOI] [PubMed] [Google Scholar]
- 21.Quattrochi LC, Tukey RH, Nuclear uptake of the Ah (dioxin) receptor in response to Omeprazole: transcriptional activation of the human CYP1A1 gene, Mol. Pharm 43 (4) (1993) 504–508. [PubMed] [Google Scholar]
- 22.Bulutoglu B, Rey-Bedon C, Mert S, Tian L, Jang YY, Yarmush ML, Usta OB, A comparison of hepato-cellular in vitro platforms to study CYP3A4 induction, PLoS One 15 (2) (2020), e0229106. [DOI] [PMC free article] [PubMed] [Google Scholar]
- 23.Bulutoglu B, Mert S, Rey-Bedon C, Deng SL, Yarmush ML, Usta OB, Rapid maturation of the hepatic cell line Huh7 via CDK inhibition for PXR dependent CYP450 metabolism and induction, Sci. Rep 9 (1) (2019) 15848. [DOI] [PMC free article] [PubMed] [Google Scholar]
- 24.Müller FA, Sturla SJ, Human in vitro models of non-alcoholic fatty liver disease, Curr. Opin. Toxicol 16 (2019) 9–16. [Google Scholar]
- 25.Feaver RE, Cole BK, Lawson MJ, Hoang SA, Marukian S, Blackman BR, Figler RA, Sanyal AJ, Wamhoff BR, Dash A, Development of an in vitro human liver system for interrogating non-alcoholic steatohepatitis, JCI Insight 1 (20) (2016), e90954. [DOI] [PMC free article] [PubMed] [Google Scholar]
- 26.Shih H, Pickwell GV, Guenette DK, Bilir B, Quattrochi LC, Species differences in hepatocyte induction of CYP1A1 and CYP1A2 by Omeprazole, Hum. Exp. Toxicol 18 (2) (1999) 95–105. [DOI] [PubMed] [Google Scholar]
- 27.Donnelly KL, Smith CI, Schwarzenberg SJ, Jessurun J, Boldt MD, Parks EJ, Sources of fatty acids stored in liver and secreted via lipoproteins in patients with non-alcoholic fatty liver disease, J. Clin. Investig 115 (5) (2005) 1343–1351. [DOI] [PMC free article] [PubMed] [Google Scholar]
- 28.Labrecque DR, Abbas Z, Anania F, Ferenci P, Khan AG, Goh KL, Hamid SS, Isakov V, Lizarzabal M, Penaranda MM, Ramos J, Sarin S, Stimac D, Thomson A, Umar M, Krabshuis J, LeMair A, Nonalcoholic fatty liver disease and nonalcoholic steatohepatitis, J. Clin. Gastroenterol 48 (6) (2014) 467–473. [DOI] [PubMed] [Google Scholar]
- 29.De Chiara F, Heeboll S, Marrone G, Montoliu C, Hamilton-Dutoit S, Ferrandez A, Andreola F, Rombouts K, Gronbaek H, Felipo V, Gracia-Sancho J, Mookerjee RP, Vilstrup H, Jalan R, Thomsen KL, Urea cycle dysregulation in non-alcoholic fatty liver disease, J. Hepatol 69 (4) (2018) 905–915. [DOI] [PubMed] [Google Scholar]
- 30.Dunn JCY, Koebe ML, Tompkins HG, Hepatocyte RG, function and extracellular matrix geometry: long-term culture in a sandwich configuration, FASEB 3 (2) (1989) 174–177. [DOI] [PubMed] [Google Scholar]
- 31.Croome KP, Lee DD, Croome S, Chadha R, Livingston D, Abader P, Keaveny AP, Taner CB, The impact of postreperfusion syndrome during liver transplantation using livers with significant macrosteatosis, Am. J. Transpl 19 (9) (2019) 2550–2559. [DOI] [PubMed] [Google Scholar]
- 32.Boring L, Gosling J, Cleary M, Charo IF, Decreased lesion formation in CCR2-/-mice reveals a role for chemokines in the initiation of atherosclerosis, Nature 394 (6696) (1998) 894–897. [DOI] [PubMed] [Google Scholar]
- 33.Nio Y, Yamauchi T, Iwabu M, Okada-Iwabu M, Funata M, Yamaguchi M, Ueki K, Kadowaki T, Monocyte chemoattractant protein-1 (MCP-1) deficiency enhances alternatively activated M2 macrophages and ameliorates insulin resistance and fatty liver in lipoatrophic diabetic A-ZIP transgenic mice, Diabetologia 55 (12) (2012) 3350–3358. [DOI] [PubMed] [Google Scholar]
- 34.Zhang X, Shen J, Man K, Chu ES, Yau TO, Sung JC, Go MY, Deng J, Lu L, Wong VW, Sung JJ, Farrell G, Yu J, CXCL10 plays a key role as an inflammatory mediator and a non-invasive biomarker of non-alcoholic steatohepatitis, J. Hepatol 61 (6) (2014) 1365–1375. [DOI] [PubMed] [Google Scholar]
- 35.Ibrahim SH, Hirsova P, Tomita K, Bronk SF, Werneburg NW, Harrison SA, Goodfellow VS, Malhi H, Gores GJ, Mixed lineage kinase 3 mediates release of C-X-C motif ligand 10-bearing chemotactic extracellular vesicles from lipotoxic hepatocytes, Hepatology 63 (3) (2016) 731–744. [DOI] [PMC free article] [PubMed] [Google Scholar]
- 36.Xu H, Zhou Y, Liu Y, Ping J, Shou Q, Chen F, Ruo R, Metformin improves hepatic IRS2/PI3K/Akt signaling in insulin-resistant rats of NASH and cirrhosis, J. Endocrinol 229 (2) (2016) 133–144. [DOI] [PubMed] [Google Scholar]
- 37.Tarantino G, Conca P, Pasanisi F, Ariello M, Mastrolia M, Arena A, Tarantino M, Scopacasa F, Vecchione R, Could inflammatory markers help diagnose non-alcoholic steatohepatitis? Eur. J. Gastroenterol. Hepatol 21 (5) (2009) 504–511. [DOI] [PubMed] [Google Scholar]
- 38.Tilg H, Moschen AR, Szabo G, Interleukin-1 and inflammasomes in alcoholic liver disease/acute alcoholic hepatitis and non-alcoholic fatty liver disease/non-alcoholic steatohepatitis, Hepatology 64 (3) (2016) 955–965. [DOI] [PubMed] [Google Scholar]
- 39.Tilg H, Moschen AR, IL-1 cytokine family members and NAFLD: neglected in metabolic liver inflammation, J. Hepatol 55 (5) (2011) 960–962. [DOI] [PubMed] [Google Scholar]
- 40.Dietrich JA, Yoshikuni Y, Fisher KJ, Woolard FX, Ockey D, McPhee DJ, Renninger NS, Chang MC, Baker D, Keasling JD, A novel semi-biosynthetic route for artemisinin production using engineered substrate-promiscuous P450(BM3), ACS Chem. Biol 4 (4) (2009) 261–267. [DOI] [PubMed] [Google Scholar]
- 41.Jamwal R, de la Monte SM, Ogasawara K, Adusumalli S, Barlock BB, Akhlaghi F, Nonalcoholic Fatty Liver Disease and Diabetes Are Associated with Decreased CYP3A4 Protein Expression and Activity in Human Liver, Mol. Pharm 15 (7) (2018) 2621–2632. [DOI] [PMC free article] [PubMed] [Google Scholar]
- 42.Lynch T, Price A, The effect of cytochrome P450 metabolism on drug response, interactions, and adverse effects, Am. Fam. Physician 76 (3) (2007) 391–396. [PubMed] [Google Scholar]
- 43.Luo G, Cunningham M, Kim S, Burn T, Lin J, Sinz M, Hamilton G, Rizzo C, Jolley S, Gilbert D, Downey A, Mudra D, Graham R, Carroll K, Xie J, Madan A, Parkinson A, Christ D, Selling B, LeCluyse E, Gan LS, CYP3A4 induction by drugs: correlation between a pregnane X receptor reporter gene assay and CYP3A4 expression in human hepatocytes, Drug Metab. Dispos 30 (7) (2002) 795–804. [DOI] [PubMed] [Google Scholar]
- 44.Huang B, Bao J, Cao YR, Gao HF, Jin Y, Cytochrome P450 1A1 (CYP1A1) catalyzes lipid peroxidation of oleic acid-induced HepG2 cells, Biochemistry 83 (5) (2018) 595–602. [DOI] [PubMed] [Google Scholar]
- 45.Uno S, Nebert DW, Makishima M, Cytochrome P450 1A1 (CYP1A1) protects against non-alcoholic fatty liver disease caused by Western diet containing benzo [a]pyrene in mice, Food Chem. Toxicol 113 (2018) 73–82. [DOI] [PMC free article] [PubMed] [Google Scholar]
- 46.Hedrich WD, Hassan HE, Wang H, Insights into CYP2B6-mediated drug-drug interactions, Acta Pharm. Sin. B 6 (5) (2016) 413–425. [DOI] [PMC free article] [PubMed] [Google Scholar]
- 47.Rettie AE, Jones JP, Clinical and toxicological relevance of CYP2C9: drug-drug interactions and pharmacogenetics, Annu Rev. Pharm. Toxicol 45 (2005) 477–494. [DOI] [PubMed] [Google Scholar]
- 48.Alghaith G, Expressionn and activity of CYP2C8 and 2C9 in diabetes mellitus and nonalcoholic fatty liver disease Open Access Master’S. Theses Paper, 1400, 2018. [Google Scholar]
- 49.Aljomah G, Baker SS, Liu W, Kozielski R, Oluwole J, Lupu B, Baker RD, Zhu L, Induction of CYP2E1 in non-alcoholic fatty liver diseases, Exp. Mol. Pathol 99 (3) (2015) 677–681. [DOI] [PMC free article] [PubMed] [Google Scholar]
- 50.Koussounadis A, Langdon SP, Um IH, Harrison DJ, Smith VA, Relationship between differentially expressed mRNA and mRNA-protein correlations in a xenograft model system, Sci. Rep 5 (2015) 10775. [DOI] [PMC free article] [PubMed] [Google Scholar]
- 51.Gry M, Rimini R, Stromberg S, Asplund A, Ponten F, Uhlen M, Nilsson P, Correlations between RNA and protein expression profiles in 23 human cell lines, BMC Genom 10 (2009) 365. [DOI] [PMC free article] [PubMed] [Google Scholar]
- 52.Liu Y, Beyer A, Aebersold R, On the dependency of cellular protein levels on mRNA abundance, Cell 165 (3) (2016) 535–550. [DOI] [PubMed] [Google Scholar]
- 53.Kantor ED, Rehm CD, Haas JS, Chan AT, Giovannucci EL, Trends in prescription drug use among adults in the United States from 1999 to 2012, JAMA 314 (17) (2015) 1818–1831. [DOI] [PMC free article] [PubMed] [Google Scholar]
- 54.National Center for Health Statistics. Prescription drug use in the past 30 days, by sex, race and Hispanic origin, and age: United States, selected years 1988–1994 through 2013–2016, 2018, 2018. 〈https://www.cdc.gov/nchs/data/hus/2018/038.pdf〉. [Google Scholar]
Associated Data
This section collects any data citations, data availability statements, or supplementary materials included in this article.