

Abstract
Immune responses have a crucial role to play against SARS-CoV-2 virus as the adaptive and innate immune systems of the human body help restoring the body to a healthy stage by annihilating this deadly viral infection. Cytokines also play a significant role in modulating a balance between innate and adaptive immune responses but excess of it can have a detrimental affect on critically ill patients. Therefore, this paper is a novel attempt to formulate a within-host mathematical model showing the impact of cytokines storm on healthy cells. The dynamics of the system is analysed which involves basic reproduction number, steady state solutions and global dynamics for disease-free point and endemic equilibrium using geometric approach. Further, an optimal control problem is discussed considering immunomodulatory therapy (targeting cytokines signaling) as control using linear feedback control method to increase the level of healthy cells, which provides vitality for our system. Through numerical simulations, analytic solutions are validated followed by the curve-fit for the cytokines using real data and an optimization algorithm for optimal fit. Finally, sensitivity analysis for the basic reproduction number and the rate of change of healthy cells using Latin Hypercube Sampling method (LHS) is performed. Our finding suggests that immunomodulatory therapy (tocilizumab) can act as a key component to control cytokines storm for critically ill patients to restore the body to a healthy state.
Introduction
Since being declared as a global pandemic, the severe-acute-respiratory syndrome corona virus-2 has led to the death of millions. Even after numerous studies and researches, the pathophysiology of this deadly virus is far from being completely understood. Specially for people with other existing ailments, the SARS-CoV-2 virus sometimes makes recovery harder or even worse. Immune response has a major role to play in it and several biological and bio-physics literature are available for better understanding of the immune process in context to this disease. For instance, the evolution of nanotechnology and application of nanoparticle (NP) has also a significant contribution in influencing the immune cell behaviour. It is essential to have clarity on the interplay and accumulation of NPs by the ECMs (extracellular matrix). ECMs acts as a pool for signaling molecules including inflammatory mediators and has an important role in influencing inflammatory cytokines in inflamed tissues [1] and a mechanistic understanding can be seen in [2]. The cellular infection and virus replication activates the inflammatory response which leads to the release of pro inflammatory cytokines [3] and gives an amplified inflammatory response. These cytokines subsequently send signals and activate natural killers (NK) which are innate immune cells and the adaptive immune T-lymphocytes cells. T-cells further activate B- lymphocytes. These B-cells produce antibodies, namely IfM and IgG. Even though the protective functions of cytokines are ideal responses but there may be an extremely excessive response due to SARS-CoV-2 [4]. This uncontrolled response due to the infection is known as cytokines release syndrome or cytokines storm. Here, along with their task to kill the infected cells [5], the cytokines start attacking the healthy cells as well [6]. The reception of a particular signal from the cytokines can modify the usual behavior of immune responses. In Covid-19, exaggerated pro-inflammatory cytokines initiate different inflammatory signaling pathways via their receptors on immune cells which leads to complicated medical symptoms [7]. This can create overwhelmed ICU (intensive care unit) resources due to the critically-ill patients in need of constant care. Even vaccination may face a problem due to existing comorbidities or pharmacological treatments. The vaccine efficiency may also be effected due to cytokines storm syndrome. There might occur an overlap between the factors that causes further damage to the prognosis of the infection namely cytokines storm and those which may effect vaccine effectiveness [8]. Different treatment approaches and therapies targeting cytokines are currently being used to treat cytokines storm. An overview in [9] is provided for specific treatments for cytokines blockades. Certain cytokines inhibitors such as tocilizumab, baricitinib and anakinra which are sometimes used for the treatment provide with promising results. The use of cytokines inhibitor such as tocilizumab is relatively safe and effective [10]. The control effort limits the fall of healthy cells and tissues due to cytokines storm which may enable the system/body to fight the virus further. The mathematical knowledge used to describe, predict and control biological systems relies on the approaches of non-linear dynamics [11]. Similar to physics, for understanding the complex and nonlinear systems, within host cell mechanisms may too require some current interactive and interdisciplinary research through which mathematical models motivated by data can provide understandings of the cytokines immune response-virus mechanism. A few significant contributions of the researchers are as follows: In [12] a VARI (Vector Autoregressive Integrated) model of covid-19 cases in Indonesia and Singapore is build and development of covid-19 cases is analysed. In [13], STEM (Spatiotemporal Epidemiological Modeler) is used to analyse Covid-19 SEIR model.
A kinetic model for Covid-19 describing the dynamics of the variation SIR cases in [14] based on a lag logistic equation. SIR and SEIR epidemiological models are generalised to situations with anomalous kinetics [15] with the aim to describe a single epidemiological peak. For within host mechanics a full density functional quantum mechanical (DFT) simulations is described of Mpro( SARS-CoV-2 main protease) in complex in [16] to obtain absolute ligand binding energies with various ligands. And in [17] within host dynamics of a SARS-CoV-2 system is discussed but it has not considered the impact of cytokines storm among critically ill patient. A few more literature on the work done for within host-SARS-CoV-2 related systems can be seen in [18–20]. Still within-host modeling and analysis for SARS-CoV-2 virus have not been explored enough compared to the need to understand the inner working of our bodies. Therefore, we will aim to analyse and understand a within-host model of the SARS-CoV-2 virus.
Goal and structure of the study
With the aforesaid information, it is clear that cytokines storm can impact the system leading to systemic hyper-inflammation. Thus, in this paper, our aim is to study a system showing the impact of cytokines storm. A healthy cell-immune responses model is proposed to simulate the effects of the cytokines storm. We will propose an SARS-CoV-2 model consisting of healthy cells, cytokines, NK-cells, T-cells, B-cells and antibodies, with the impact of cytokines storm in Sect. 2. The basic reproduction number, existence of equilibrium points, feasible region and the global stability of disease-free and endemic equilibrium points are calculated in Sect. 3 with their detailed proof in the Appendix. In Sect. 4, we will formulate an optimal control problem using immunomodulatory agent and discuss it using LQR method. In Sect. 5, we will perform numerical simulation for validation of our analytic results, curve fit for real data of cytokines, curve-fit using an algorithm based on initial guess approach for the system and local sensitivity analysis for reproduction number and endemic equilibrium point. We shall also study global sensitivity analysis using PRCC (Global sensitivity analysis method) to determine the sensitive parameters which are important for transmission of infection and healthy cells. Thus, we shall proceed with our study in the following sections to address the following research questions as how the cytokine storm impacts the disease.
What is the impact of cytokines storm on disease dynamics for a SARS-CoV-2 patient?
Is the activation of the ideal immune responses of the cytokines required for suppression of transmission of infection (basic reproduction number)?
Cytokines inhibitors are considered relatively safe and effective to support and build a stronger system (healthy cells). What is the impact of using immunomodulatory therapy on the system during cytokines storm ?
The novelty of the paper lies in the concept of developing a within-host model in the presence of cytokines storm and its effect on healthy cells. The paper encapsulates dynamical analysis of the system, model fitting to real cytokines data and extending the model to an optimal control problem considering immunomodulatory therapy as control.
Model formulation
We have formulated a model referring [17] but in the formulation of our model, we have explicitly focused on critically ill patient. H(t) is the concentration of healthy cells which are uninfected, C(t) is the concentration of cytokines, I(t) denote the concentration of T cells which are infected, N(t) are the concentration of natural killer cells, T(t) are the concentration of T-lymphocytes cells, B(t) are the concentration of B-lymphocytes cells, A(t) are the concentration of antibodies and V(t) are the concentration of the virus at time t. The formulation of the equations are done as follows:
- Healthy cell H(t) gets infected due to virus at the rate . Along with it, due to cytokines storm, we assume that the natural killers and T-cells also negatively effect H-cells at rate and respectively [4, 6] which was not considered by [17], is the natural death rate. Hence, the evolution equation is:
1 - The infected cell increases due to interaction of health cells with the virus. As an immune response N and T proceed to kill these infected cells at the rate and and is the natural death rate of I, giving rise to the equation:
2 - New virus particles are produced by I at a rate . Also, the antibodies and cytokines work to reduce the viral load at a rate and which gives the evolution equation:
3 - Cytokines are activated due to cellular infection and viral replication at the rate along with immuno-suppression at the rate and natural death rate making the equation of the following form:
4 - These cytokines subsequently activate natural killers at the rate r and these natural killers help in reducing the infected cells. These natural killers also naturally decay at the rate . Hence, the equation is as below:
5 - Cytokines activate the adaptive immune cells T-lymphocytes at the rate with natural decay at a rate making the equation look like:
6 - T-cells further activate B-lymphocytes at the rate with as the natural death rate of B-lymphocytes. Therefore, the evolution equation becomes:
7 - Finally, these B-cells produce antibodies at the rate k. Critically/severely ill patients of COVID-19 develop SARS-Cov-2 specific antibodies [21, 22]. Thus, at the time of cytokines storm for a critically ill patient, antibodies exist without delay and these antibodies are neutralized by the virus at the rate .
8
The parameters are explained in the Table 1 and a schematic diagram of the model has been shown in Fig. 1 for better understanding.
Table 1.
Parameter description
| Parameter | Dimension | Description |
|---|---|---|
| Cells ml day | Rate of production for healthy cells | |
| day | Per capita death rate of healthy cells | |
| ml RNA copies day | Rate at which the healthy are infected | |
| ml cells day | Rate at which the healthy cells are reduced due to N | |
| ml cells day | Rate at which the healthy cells are reduced due to T | |
| day | Rate at which virus is produced due to infected cells | |
| day | Rate at which cytokines are produced | |
| day | Per capita death rate of infected cells | |
| RNA copies | Strength of immunosupresion | |
| ml cells day | Rate at which the infected cells are reduced due to T | |
| day | Per capita death rate of the virus | |
| ml cells day | Rate at which the infected cells are reduced due to N | |
| ml cells day | Rate at which the virus are reduced due to C | |
| ml cells day | Rate at which the virus are reduced due to A | |
| r | day | Rate of activation of natural killer cells |
| k | day | Production rate of antibodies |
| day | Per capita death rate of Natural killer cells | |
| day | Per capita death rate of cytokines | |
| day | Per capita death rate of T-cells | |
| day | Per capita death rate of B-cells | |
| day | Per capita death rate of antibodies | |
| cells day | Rate of activation of T cells | |
| cells day | Rate of activation of B cells | |
| ml cells day | Rate at which the antibodies are reduced due to V |
Fig. 1.
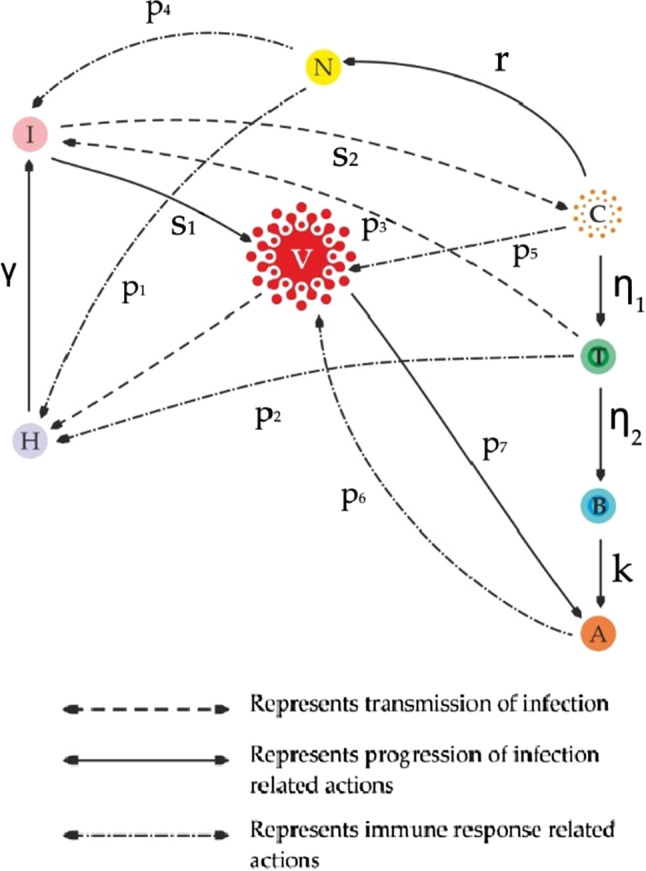
Schematic diagram depicting the interaction among all the compartments
Dynamical analysis
Basic reproduction number and existence of equilibrium points
The basic reproduction number is given by
| 9 |
with the proof provided in Appendix A.
The system has following four equilibrium points:
-
Disease free equilibrium point :
where
Equilibrium point without immune response : where and which exists for .
-
Equilibrium point without adaptive immune response:
and assuming , we have provided , , , and for we get a cubic equation :
where , , and .Now and for : . if where i.e. provided . Then by Descartes’ rule of sign there exist one positive root of .
-
Equilibrium point with adaptive immune response:
and assuming , we have ,
. Now , if where i.e. provided . And if and if .
Theorem 1
The feasible region is and is positively invariant.
The detailed proof for Theorem 1 is provided in Appendix A.
Global stability for disease-free equilibrium and endemic equilibrium point
Theorem 2
-
(i)
If i.e if then the DFE will be globally asymptotically stable(GAS)in .
-
(ii)
is globally asymptotically stable for .
We shall use geometric approach method [23] to establish global stability for endemic equilibrium and the proof is mentioned in the Appendix A.
The next section would emphasis especially on control of cytokines through immunomodulatory therapy in specific tocilizumab treatment which would protect healthy cells. The positive impact of tocilizumab treatment which supports our study is also shown in [7], where COVID-19 patients in the ICU across hospitals in the United States showed that the risk of mortality was lower in patients who received tocilizumab treatment (by inhibiting cytokines signaling) immediately after ICU admission than in those who did not receive early tocilizumab intervention. As healthy cells are the part and parcel of our body it will give vitality for the system.
Optimisation model
Immunomodulatory therapy as control by linear feedback
To design a feedback law that may stabilize the equilibrium point or to increase the healthy cell count to a certain desired level, we shall use optimal control theory [24] and we have the dynamic system form with control as follows:
| 10 |
We can use an immunomodulatory agent [25] as a control strategy such as tocilizumab with the aim to suppress the cytokines storm i.e to control the response of the storm. We assume that the immunomodulatory agents can directly target cytokines. With the goal of cytokines storm control strategy, we aim to increase the level of healthy cell population and maintain at level ( i.e increased desired level of H to be less than the level at DFE ) by . is the designed healthy cell population. The equations satisfied by the desired positive steady state with control are given below as:
| 11 |
From the above equations, we obtain the control variable ,
| 12 |
When controls the desired steady state of the system i.e (), it may be unstable. Therefore, u (the feedback control) can be made such that the desired state will be asymptotically stable. Defining new variables as follows:
| 13 |
where . We shall now substitute Eq. (13) into Eqs. (10) and admitting (11) we have:
| 14 |
Hence we are able to obtain the error system as below:
| 15 |
matrices A and B are given as
To find the feedback control u we shall use the Theorem 1 of [26] for the following:
Theorem 3
[24, 26]. For any matrix P and
function l(y) is positive definite at the neighbourhood of the origin (0, 0, 0, 0, 0, 0, 0, 0).
The detailed proof for above Theorem 3 is provided in Appendix A.
Numerical simulations
In this section, we shall now analyse the system based on certain parametric values mentioned in Table 2 and run simulations using MATLAB. A few parametric values have been taken from [17, 27–31] and the fitted values are obtained from cytokines load real data of RT-PCR positive patient COVID-19 patients [32]. The observations in [32] were indicative of a strong relation between the cytokines level and severity of symptoms/organ damage. We used the real cytokines levels data from [32] which were observed in patients(admitted to the Mount Sinai Health System, New York) in relation to SARS-CoV-2 PCR status(positive). The remaining parameters are further adjusted so as the model describes an uncomplicated SARS-CoV-2 infection system
Table 2.
Parameter values
| Parameter | Value | Source | Parameter | Value | Source |
|---|---|---|---|---|---|
| 8000 | [31] | 0.14 | [17] | ||
| 0.9 | Assumed | 0.0000000001 | Assumed | ||
| 0.0000000001 | Assumed | 0.002 | Assumed | ||
| 0.0005 | Fitted | 0.003 | [17] | ||
| 0.5 | Fitted | 0.001 | [27] | ||
| 0.002 | [17] | 0.000574 | [17] | ||
| (0–1) | [17] | (0–1) | [17] | ||
| r | 0.52 | [17] | k | 0.2 | [28] |
| 0.07 | [30] | 0.7 | Fitted | ||
| 1 | [17] | 0.2 | [29] | ||
| 0.07 | [17] | 0.9 | Assumed | ||
| 0.01 | [17] | 0.0000003 | [17] |
Equilibrium points
Disease free equilibrium point: For and rest parameters as in Table 2 we get as seen in Fig. 2. The global stability condition for i.e if : is met as per the analytical solution).
Equilibrium point without immune response: For and rest parameters as in Table 2 we get . For the existence as seen before in Sect. 3.1, i.e is validated numerically.
Equilibrium point without adaptive immune response: For and rest parameters as in Table 2 we get . if i.e which is in line with the existence of equilibrium.
Equilibrium point with adaptive immune response: For and rest parameters as in Table 2 we get if i.e is validated numerically for the existence of equilibrium.
Fig. 2.

Dynamics of equilibrium points
Model validation: curve-fit of cytokines level C(t) to real data
Cytokines load data was obtained from [32]. For our analysis we shall be using a data set of patients (1422 independent samples of patients admitted to the Mount Sinai Health System in New York) with respiratory symptoms for their IL-6 (cytokines) level whose RT-PCR came positive. The data was collected with the help of online software [33] and fitted using Matlab. The fitting is shown in Fig. 3 (The value for both the plots are in real scenario). It can be seen that the cytokines level for our model solution is close to the actual numbers from real data, Thus, proving validity of our model.
Fig. 3.
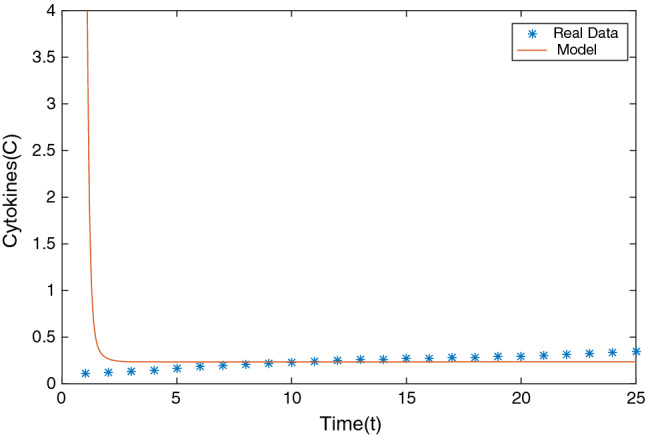
Fitting model solution for cytokines to RT-PCR positive patient with respiratory symptoms real data
Curve-fit for system using optimization algorithm
We have used python script to fit our model based on a system of non-linear differential equations for curve-fitting. Following our aim to curve fit our model based on the parameters(endemic equilibrium) we have referred or assumed, we have used standard algorithm curve_fit. We shall do the fitting by numerical approximation [34]. As parameter estimation is a special optimization problem, it would use an algorithm to minimise the squared error as objective and it’s performance is based on the initial guess approach. For an initial value problem, an algorithm can be used to approximate the solution for a given set of initial conditions and parameter values. This set of values are taken as initial guess by the algorithm. The algorithm used is the Levenberg–Marquardt algorithm which chooses the parameters and initial values to minimise error or noise [35]. However in Fig. 4a we do not get an adequate desired fit. Therefore, we use an optimizer(based of Nelder-Mean algorithm [36]) and random search algorithm which generates random initial guesses and chooses the best approximation. We see that this algorithm is quite efficient for finding an optimal fit. In Fig. 4b we can see that this approach helped generate a good fit for our model. The regression line(for least square estimation [37]) shows the predicted response based of the random search and algorithm. Thus, the estimated parameters by the algorithm are like our input parameters.
Fig. 4.

Curve fit using a Levenberg–Marquardt algorithm and b Nelder-Mean algorithm
Sensitivity analysis for
In this section, we shall discuss the sensitivity analysis of with respect to parameters. We shall follow the method as mentioned in [38] to find the sensitivity index. We shall start with the sensitivity analysis for with respect to its parameters k:
Using above, the normalised forward sensitivity indices with respect to the parameters we get:
We see that are all positive and are negative. This implies that for say example , we decrease/increase by certain then will decrease/increase by same percentage. And for we decrease/increase by certain then will increase/decrease by same percentage and here is a highly sensitive parameter. And we can see for our system that if decreases then infection increases, and if increases then the healthy cells get infected more. If we increase the parameters by then increases/decreases by . In Fig. 5 For disease free point we can see that increase in and by will increase by . And increase in and by will decrease by . ( and will behave in similar manners and thus have not been added to the figure.) Similarly for endemic equilibrium point in Fig. 6 we see the same trend for the change in behavior of . Thus, we can take note of the important parameters one needs to keep in check in order to control the transmission of infection. These will be of help to maintain either for disease free system (restrict from increasing beyond 1) or endemic equilibrium system (suppress to bring down below 1).
Fig. 5.

Behaviour of due to change in parameters for disease-free equilibrium point: the graphs report comparison between original and increase/decrease in parametric value
Fig. 6.

Behaviour of due to change in parameters for endemic equilibrium point: the graphs report comparison between original and increase/decrease in parametric value
Uncertainty analysis of
PRCC (partial rank correlation coefficient) [39] is one technique which help’s us quantify the uncertainty for any model. For our basic reproduction number, we shall use PRCC to identify and quantify how the parameters (input)’s uncertainty may impact the transmission of infection. We have considered the output as for sample size . We consider the six parameters from (9) and have chosen normal distribution for the parameters. We find the PRCC values using Matlab using , , , , , .
For some selected combinations of sensitive parameters we have also found surface diagrams such as with and in Fig. 7.
Fig. 7.

Phase plane of with the parameters
We get the PRCC values for our input parameters which can be seen in Fig. 8. We obtain following indexes for the parameters: and . The graphs shows that is positively correlated to and with maximum impact of which means that as the rate at which virus is produced due to infected cells are increased, the transmission of infection will increase as well. The effect of the parameter will bring about an opposite change in the transmission of infection as it is negatively correlated. As the death rate of virus increases, the infection transmission will decrease. Further, and satisfies the same negative correlation. Since the value parameter is close to 1, it indicates a strong correlation to change in . Thus, this hints at the need in suppressing the virus to decrease further transmission of infection through . Therefore, this emphasises the activation of the immune response of the body to fight the virus.
Fig. 8.

PRCC: sensitivity indexes of
Uncertainty analysis of rate of change of H
In the similar manner, we shall use PRCC to identify and quantify how the parameters uncertainty may impact the rate of change of healthy cells in a SARS-COV-2 infected patient. For sample size we consider the five parameters and have chosen normal distribution for them. We find the PRCC values using Matlab using , , , , .
We get the PRCC values for our input parameters which can be seen in Fig. 9. We obtain following indexes for the parameters: and . The PRCC indices satisfies the same set of correlation as per the assumptions of formulation of rate of change of H i.e is positively correlated and the rest parameters are all negatively correlated. The value and parameters are close to , it indicates a strong correlation to the rate of change in H. We see that and are the parameters related to rate at which the healthy cells are reduced due to N and T respectively. This shows that this particular immune response which is due to the cytokines storm has an strong impact on the healthy cells. Thus, the exaggerated response of cytokines has an strongly negative impact on the healthy cells.
Fig. 9.

PRCC: sensitivity indexes of rate of change of H
System with control
Now we shall numerically go for stabilising the system at desired steady state (10) with to avoid elimination of healthy cells and tissues due to cytokines storm. We aim to increase the healthy cell to get a system where the body is still able to fight the foreign entities at time of hyper-inflammatory immune response in critically ill patients. We calculated and from (11). From (12) we get . Matrix obtained for the system is as follows:
Assuming
Using LQR commands in Matlab, from the Riccati equation we obtain
We shall investigate the local definiteness of l(y) (18) using graphic representation. Figure 10 shows the local definiteness of the function l(y). We have shown the local definiteness interaction between select variables as the rest variables have similar graphic representation as well.
Fig. 10.

3D sections of l(y) at the origin
Finally, we get the form for optimal strategy as follows:
| 16 |
For the system with control we get as in Fig. 11a. We can see that due to the control the population of healthy cells increases(Fig. 11b) as compared to the H population in Fig. 2d. Thus, the use of cytokines storm control strategy can help to steer clear of exhaustion of healthy cells and tissues with the aim to resume the host’s homeostasis. Thus, this can be an approach for severe COVID-19 patients to counteract cytokines storm.
Fig. 11.

.
Conclusion
Though the vaccine drive has started in many countries, the transmission of SARS-CoV-2 infection is still continuing. Cytokines storm plays an important role as a cause for ARDS and MOF, thus leading to disease aggravation. Cytokines storms have been detected in Covid-19 critically ill patients, as seen in some clinical studies. Due to an unbalanced immune response, a strong cytokine storm may be extremely damaging to the patients, who may require intensive-care support. Thus, to save the lives of patients, one needs efficient strategies to suppress the cytokines storm.
The formulation of our complex model is with the aim to understand the immunopathological mechanisms of cytokines storm due to SARS-CoV-2 virus. Model was fitted to cytokines real data of SARS-CoV-2 PCR status (positive) patients with respiratory symptoms. To address our research questions, we studied the dynamic analysis of our system.
The observations from our analysis and numerical simulations brought the following suggestive measures which could be taken:
Since, the cytokines storm based immune response incorporation in the system has brought upon undesired effect as it reduces the healthy cells and tissues the body leading to ARDS or MOF which makes the patient’s recovery becomes tougher and tougher, our analysis give support to the study of development and use of treatments and vaccines for large populations in view of cytokines storm. By focusing on the impact of the uncontrolled immune response, decisions can be taken to tackle the critically ill patients specially in overwhelmed ICU’s more effectively.
The uncertainty analysis of suggests the need for the activation of immune response to suppress the virus which would further result in decrease in transmission of infection rate .
The global sensitivity analysis projects that and parameters with their PRCC indices as and respectively are strongly negatively correlated to the rate of change in H. These parameters which are related to rate at which the healthy cells are reduced due to N and T respectively showed that due to the cytokines storm this particular immune response has a strong impact on the healthy cells and may reduce the healthy cells.
The population of healthy cells increases to 953.4 as compared to the 534.1 in with the incorporation of cytokines storm control strategy. Immunomodulatory agent(such as tocilizumab) was considered as control strategy to control the response of the storm. To design a feedback law that may increase the healthy cell count to a certain desired level, we used optimal control theory. Therefore, working towards strategies that aim at the importance of functional features of cytokines storm-specific response for both vaccinated and non-vaccinated population may be the need of the hour. Further, to tackle the problematic exaggerated immune response due to cytokines storm, we may need to focus on the treatments leading to enhancement of the healthy cells by cytokines inhibition which may further require the understanding of the single interaction parameter with the healthy cells H. Cytokines storm control strategy was discussed with the aim to avoid healthy cells from depleting. This can help to ward off from exhaustion of healthy cells and tissues for severe COVID-19 patients due to cytokines storm. Healthy cells and tissues will be able to provide a system of great vitality for the immune system to work on to suppress the infection.
Appendix A
Basic reproduction number:
Using the next-generation matrix method, we define the matrix V for terms related with viral production and the matrix F for the infection terms in the model are:
The spectral radius is thus obtained as,
and hence, where . Thus, .
Proof of Theorem 1
We first see that the system is in a feasible region i.e the population neither goes negative nor goes unbounded through the method as done in [40]. The positively invariant region is the non-negative orthant . In this region, if a trajectory starts from a point, it will remain in the same region. We shall show that each vector field point to on each hyper plane bounding the region. We obtain: Now . As for I, it will be bounded above by which is equal to as maximum number infected T cells can only be the maximum number of healthy cells i.e: . And , , , , and . Hence, we get the feasible region .
Proof of Theorem 2(i)
To study the global asymptotic stability of the disease free equilibrium for the model, we shall see the compartmental form of the system. For the compartmental form, we shall split the variables into infectious and non-infectious terms. The two compartments will be disease compartment and non-disease compartments i.e:
The vector consist of entries which represent the rate of new infection and the vector have entries representing transition terms in the disease compartments which is x. For our model they are:
With our system satisfies. Motivated by [41], we shall define the Lyapunov function as: . We take where is a positive value for I, and in view of we can verify . Now, differentiating the Lyapunov function: Therefore for , . Then for , and this gives us and i.e . And as C are activated due to presence of infection so even they will cease to exist. Thus and will be a Lyapunov function. And for our system we get a singleton (H, 0, 0, 0, 0, 0, 0, 0).
Even for we have . So we get and which in turn gives and thus other immune responses are not activated either i.e we get a set . Thus for and we are left with the system (H, 0, 0, 0, 0, 0, 0, 0).
For , which is absurd as the term is non-negative . Thus GAS doesn’t exist for .
This above system can have an unique equilibrium point which is nothing else but DFE. Thus at i.e iff , the only large invariant set where is DFE.
Proof of Theorem 2(ii)
Taking the host population system i.e of (1)–(8) and assuming and , for our linearized system we find the jacobian matrix:
and we find the second additive compound matrix:
Now taking
Now : where , , , with . , , . is chosen as vector norm |.| in . With respect to this norm, Lozinzkii measure can be estimated as where and . Thus, we get:
Now from Eq. (2): . Specifically,
| 17 |
Using Eq. (17) for we further get where and where if . Thus from and we get, . It follows from that for a sufficiently large t. And we obtain: if t is large enough. Thus we get which in turn completes our proof. The host population system of our model is globally asymptotically stable around the endemic equilibrium points . Now considering the subsystem (4)– (8):
, , , , : C(t), N(t), T(t), B(t), A(t) are bounded for . For the endemic equilibrium to be globally asymptotically stable this is sufficient to prove.
Proof of Theorem 3
For all y in the considered case we have
| 18 |
and the partial derivatives as:
| 19 |
| 20 |
| 21 |
| 22 |
| 23 |
| 24 |
| 25 |
| 26 |
We can see that:
and at the origin for the Hessian of l(y) we have:
We can infer that it’s positive definite and tells us that the origin of function l(y) is a strict local minimum point. This function at the neighbourhood of the origin is positive definite. Thus, we may say that the error dynamical system (15) under linear feedback control u is locally asymptotically stable and system (10) approaches to () under the control .
Declarations
Conflict of interest
All authors declare no conflicts of interest in this paper.
References
- 1.Sorokin L. The impact of the extracellular matrix on inflammation. Nat. Rev. Immunol. 2010;10(10):712–723. doi: 10.1038/nri2852. [DOI] [PubMed] [Google Scholar]
- 2.Engin AB, Nikitovic D, Neagu M, Henrich-Noack P, Docea AO, Shtilman MI, Golokhvast K, Tsatsakis AM. Mechanistic understanding of nanoparticles’ interactions with extracellular matrix: the cell and immune system. Part. Fibre Toxicol. 2017;14(1):22. doi: 10.1186/s12989-017-0199-z. [DOI] [PMC free article] [PubMed] [Google Scholar]
- 3.Sasmal SK, Dong Y, Takeuchi Y. Mathematical modeling on t-cell mediated adaptive immunity in primary dengue infections. J. Theor. Biol. 2017;429:229–240. doi: 10.1016/j.jtbi.2017.06.035. [DOI] [PubMed] [Google Scholar]
- 4.Ye Q, Wang B, Mao J. The pathogenesis and treatment of the cytokine storm in covid-19. J. Infect. 2020;80(6):607–613. doi: 10.1016/j.jinf.2020.03.037. [DOI] [PMC free article] [PubMed] [Google Scholar]
- 5.Sun X, Wang T, Cai D, Hu Z, Chen J, Liao H, Zhi L, Wei H, Zhang Z, Qiu Y, Wang J, Wang A. Cytokine storm intervention in the early stages of covid-19 pneumonia. Cytokine Growth Factor Rev. 2020;53:38–42. doi: 10.1016/j.cytogfr.2020.04.002. [DOI] [PMC free article] [PubMed] [Google Scholar]
- 6.https://www.bbc.com/future/article/20200505-cytokine-storms-when-the-body-attacks-itself. Retrieved December 27, 2020
- 7.Yang L, Xie X, Tu Z, Fu J, Xu D, Zhou Y. The signal pathways and treatment of cytokine storm in covid-19. Signal Transduction Target. Ther. 2021;6(1):255. doi: 10.1038/s41392-021-00679-0. [DOI] [PMC free article] [PubMed] [Google Scholar]
- 8.Ciabattini A, Garagnani P, Santoro F, Rappuoli R, Franceschi C, Medaglini D. Shelter from the cytokine storm: pitfalls and prospects in the development of sars-cov-2 vaccines for an elderly population. Semin. Immunopathol. 2020;42(11):619–634. doi: 10.1007/s00281-020-00821-0. [DOI] [PMC free article] [PubMed] [Google Scholar]
- 9.Kim JS, Lee JY, Yang JW, Lee KH, Effenberger M, Szpirt W, Kronbichler A, Shin JI. Immunopathogenesis and treatment of cytokine storm in covid-19. Theranostics. 2021;11(1):316–329. doi: 10.7150/thno.49713. [DOI] [PMC free article] [PubMed] [Google Scholar]
- 10.Tang Y, Liu J, Zhang D, Xu Z, Ji J, Wen C. Cytokine storm in covid-19: the current evidence and treatment strategies. Front. Immunol. 2020;11:1708. doi: 10.3389/fimmu.2020.01708. [DOI] [PMC free article] [PubMed] [Google Scholar]
- 11.Kapitaniak T, Jafari S. Nonlinear effects in life sciences. Eur. Phys. J. Spec. Top. 2018;227(7–9):693–696. doi: 10.1140/epjst/e2018-800104-6. [DOI] [Google Scholar]
- 12.Fitriani R, Revildy WD, Marhamah E, Toharudin T, Ruchjana BN. The autoregressive integrated vector model approach for covid-19 data in Indonesia and Singapore. J. Phys. Conf. Ser. 2021;1722:012057. doi: 10.1088/1742-6596/1722/1/012057. [DOI] [Google Scholar]
- 13.Baldassi F, D’Amico F, Malizia A, Gaudio P. Evaluation of the spatiotemporal epidemiological modeler (stem) during the recent covid-19 pandemic. Eur. Phys. J. Plus. 2021;136(10):1072. doi: 10.1140/epjp/s13360-021-02004-8. [DOI] [PMC free article] [PubMed] [Google Scholar]
- 14.Shnip AI. Epidemic dynamics kinetic model and its testing on the covid-19 epidemic spread datas. J. Eng. Phys. Thermophys. 2021;94:6–17. doi: 10.1007/s10891-021-02268-y. [DOI] [Google Scholar]
- 15.Tirnakli U, Tsallis C. Epidemiological model with anomalous kinetics: Early stages of the covid-19 pandemic. Front. Phys. 2020;8:217. doi: 10.3389/fphy.2020.613168. [DOI] [Google Scholar]
- 16.Wang Y, Murlidaran S, Pearlman DA. Quantum simulations of sars-cov-2 main protease mpro enable high-quality scoring of diverse ligands. J. Comput. Aided Mol. Des. 2021;35(9):963–971. doi: 10.1007/s10822-021-00412-7. [DOI] [PMC free article] [PubMed] [Google Scholar]
- 17.Ghosh I. Within host dynamics of sars-cov-2 in humans: modeling immune responses and antiviral treatments (archived article) SN Comp. Sci. 2021;2(6):482. doi: 10.1007/s42979-021-00919-8. [DOI] [PMC free article] [PubMed] [Google Scholar]
- 18.Wang S, Pan Y, Wang Q, Miao H, Brown AN, Rong L. Modeling the viral dynamics of sars-cov-2 infection. Math. Biosci. 2020;328:108438. doi: 10.1016/j.mbs.2020.108438. [DOI] [PMC free article] [PubMed] [Google Scholar]
- 19.Hernandez-Vargas EA, Velasco-Hernandez JX. In-host mathematical modelling of covid-19 in humans. Annu. Rev. Control. 2020;50:448–456. doi: 10.1016/j.arcontrol.2020.09.006. [DOI] [PMC free article] [PubMed] [Google Scholar]
- 20.J. Burgos, System dynamics modeling of within-host viral kinetics of coronavirus (sars cov-2) (2020)
- 21.Longchamp A, Longchamp J, Croxatto A, Greub G, Sanchez B, Delaloye J. Serum antibody response in critically ill patients with covid-19. Intensive Care Med. 2020;46:1921–1923. doi: 10.1007/s00134-020-06171-7. [DOI] [PMC free article] [PubMed] [Google Scholar]
- 22.Zhao J, Yuan Q, Wang H, Liu W, Liao X, Su Y, Wang X, Yuan J, Li T, Li J, Qian S, Hong C, Wang F, Liu Y, Wang Z, He Q, Li Z, He B, Zhang T, Fu Y, Ge S, Liu L, Zhand J, Xia N, Zhang Z. Antibody responses to sars-cov-2 in patients with novel coronavirus disease 2019. Clin. Infect. Dis. 2020;71(16):2027–2034. doi: 10.1093/cid/ciaa344. [DOI] [PMC free article] [PubMed] [Google Scholar]
- 23.Barik M, Chauhan S, Bhatia SK, Misra OP. Understanding role of ctl cells and antibodies on a delayed hiv mathematical model: a dynamical analysis. Math. Eng. Sci. Aerospace (MESA) 2021;12(1):109–123. [Google Scholar]
- 24.Rafikov M, De Holanda Limeira E. Mathematical modelling of the biological pest control of the sugarcane borer. Int. J. Comput. Math. 2012;89(3):390–401. doi: 10.1080/00207160.2011.587873. [DOI] [Google Scholar]
- 25.Zhao M. Cytokine storm and immunomodulatory therapy in covid-19: role of chloroquine and anti-il-6 monoclonal antibodies. Int. J. Antimicrob. Agents. 2020;55(6):105982. doi: 10.1016/j.ijantimicag.2020.105982. [DOI] [PMC free article] [PubMed] [Google Scholar]
- 26.Rafikov M, Balthazar JM, von Bremen HF. Mathematical modeling and control of population systems: application in biological pest control. Appl. Math. Comput. 2008;200:557–573. [Google Scholar]
- 27.Clapham HE, Tricou V, Van Vinh Chau N, Simmons CP, Ferguson NM. Within-host viral dynamics of dengue serotype 1 infection. J. R. Soc. Interface. 2014;11(96):20140094. doi: 10.1098/rsif.2014.0094. [DOI] [PMC free article] [PubMed] [Google Scholar]
- 28.Gujarati TP, Ambika G. Virus antibody dynamics in primary and secondary dengue infections. J. Math. Biol. 2014;69(6–7):1773–1800. doi: 10.1007/s00285-013-0749-4. [DOI] [PubMed] [Google Scholar]
- 29.Oprea M, Perelson AS. Exploring the mechanisms of primary antibody responses to t cell-dependent antigens. J. Theor. Biol. 1996;181(3):215–236. doi: 10.1006/jtbi.1996.0127. [DOI] [PubMed] [Google Scholar]
- 30.Yokoyama WM, Kim S, French AR. The dynamic life of natural killer cells. Annu. Rev. Immunol. 2004;22:405–429. doi: 10.1146/annurev.immunol.22.012703.104711. [DOI] [PubMed] [Google Scholar]
- 31.Duffin R, Tullis R. Mathematical models of the complete course of hiv infection and aids. J. Theor. Med. 2002;4:215–221. doi: 10.1080/1027366021000051772. [DOI] [Google Scholar]
- 32.D.M. Del Valle, S. Kim-Schulze, H.H. Huang, N.D. Beckmann, S. Nirenberg, B. Wang, Y. Lavin, T.H. Swartz, D. Madduri, A. Stock, T.U. Marron, H. Xie, M. Patel, K. Tuballes, O. Van Oekelen, A. Rahman, P. Kovatch, J.A. Aberg, E. Schadt, S. Jagannath, S. Gnjatic, An inflammatory cytokine signature predicts covid-19 severity and survival. Nat. Med. 9(1), 1636–1643 (2020) [DOI] [PMC free article] [PubMed]
- 33.Wpd. online software for data extraction. https://apps.automeris.io/wpd/. Retrieved : 2021-06-02
- 34.Ramsay JO, Hooker G, Campbell D, Cao J. Parameter estimation for differential equations: a generalized smoothing approach. J. Roy. Stat. Soc. B (Stat. Methodol.) 2007;69(5):741–796. doi: 10.1111/j.1467-9868.2007.00610.x. [DOI] [Google Scholar]
- 35.F. Hamilton, Parameter estimation in differential equations: A numerical study of shooting methods. SIAM Undergraduate Research Online (2011)
- 36.Barati R. Parameter estimation of nonlinear Muskingum models using Nelder-Mead simplex algorithm. J. Hydrol. Eng. 2011;16:946–954. doi: 10.1061/(ASCE)HE.1943-5584.0000379. [DOI] [Google Scholar]
- 37.More AN, Kohli PS, Kulkarni KH. Simple linear regression with least square estimation: an overview. Int. J. Comput. Sci. Inf. Technol. 2016;7(6):2394–2396. [Google Scholar]
- 38.Chitnis N, Hyman JM, Cushing JM. Determining important parameters in the spread of malaria through the sensitivity analysis of a mathematical model. Bull. Math. Biol. 2008;70(5):1272–1296. doi: 10.1007/s11538-008-9299-0. [DOI] [PubMed] [Google Scholar]
- 39.Marino S, Hogue IB, Ray CJ, Kirschner DE. A methodology for performing global uncertainty and sensitivity analysis in systems biology. J. Theor. Biol. 2008;254(1):178–196. doi: 10.1016/j.jtbi.2008.04.011. [DOI] [PMC free article] [PubMed] [Google Scholar]
- 40.Perelson AS, Kirschner DE, Boer RD. Dynamics of hiv infection of cd4 t cells. Math. Biosci. 1993;114(1):81–125. doi: 10.1016/0025-5564(93)90043-A. [DOI] [PubMed] [Google Scholar]
- 41.Shuai Z, Driessche PVD. Global stability of infectious disease models using lyapunov functions. SIAM J. Appl. Math. 2013;73(4):1513–1532. doi: 10.1137/120876642. [DOI] [Google Scholar]