

Key Points
Question
Within a health care system–derived biobank comprising individuals of diverse ancestry, what is the prevalence of copy number variants (CNVs) that are known risk factors for neurodevelopmental disorders (NDD), and what clinical features are associated with these CNVs?
Findings
In this series of phenotypic association analyses including data from 24 877 individuals, the overall prevalence of NDD CNVs in the biobank was found to be 2.5%. NDD CNV carriers were enriched for congenital disorders and major depressive disorder, and the presence of NDD CNVs was found to be associated with several medical outcomes, including hypertension, obesity, and obesity-related phenotypes, specifically obstructive sleep apnea and increased body mass index.
Meaning
CNVs known to affect neurodevelopmental outcomes may also be associated with select medical outcomes, including obesity, warranting further genetic, neurobiological, and clinical investigation with important translational and therapeutic implications.
This genetic association study aims to identify individuals harboring neurodevelopmental disorder copy number variants in a multiancestry biobank and query their enrichment for select neuropsychiatric disorders as well as association with multiple medical disorders.
Abstract
Importance
Past studies identified rare copy number variants (CNVs) as risk factors for neurodevelopmental disorders (NDDs), including autism spectrum disorder and schizophrenia. However, the clinical characterization of NDD CNVs is understudied in population cohorts unselected for neuropsychiatric disorders and in cohorts of diverse ancestry.
Objective
To identify individuals harboring NDD CNVs in a multiancestry biobank and to query their enrichment for select neuropsychiatric disorders as well as association with multiple medical disorders.
Design, Settings, and Participants
In a series of phenotypic enrichment and association analyses, NDD CNVs were clinically characterized among 24 877 participants in the BioMe biobank, an electronic health record–linked biobank derived from the Mount Sinai Health System, New York, New York. Participants were recruited into the biobank since September 2007 across diverse ancestry and medical and neuropsychiatric specialties. For the current analyses, electronic health record data were analyzed from May 2004 through May 2019.
Main Outcomes and Measures
NDD CNVs were identified using a consensus of 2 CNV calling algorithms, based on whole-exome sequencing and genotype array data, followed by novel in-silico clinical assessments.
Results
Of 24 877 participants, 14 586 (58.7%) were female; self-reported ancestry categories included 5965 (24.0%) who were of African ancestry, 7892 (31.7%) who were of European ancestry, and 8536 (34.3%) who were of Hispanic ancestry; and the mean (SD) age was 50.5 (17.3) years. Among 24 877 individuals, the prevalence of 64 NDD CNVs was 2.5% (n = 627), with prevalence varying by locus, corroborating the presence of some relatively highly prevalent NDD CNVs (eg, 15q11.2 deletion/duplication). An aggregate set of NDD CNVs were enriched for congenital disorders (odds ratio, 2.0; 95% CI, 1.1-3.5; P = .01) and major depressive disorder (odds ratio, 1.5; 95% CI, 1.1-2.0; P = .01). In a meta-analysis of medical diagnoses (n = 195 hierarchically clustered diagnostic codes), NDD CNVs were significantly associated with several medical outcomes, including essential hypertension (z score = 3.6; P = 2.8 × 10⁻⁴), kidney failure (z score = 3.3; P = 1.1 × 10⁻³), and obstructive sleep apnea (z score = 3.4; P = 8.1 × 10⁻⁴) and, in another analysis, morbid obesity (z score = 3.8; P = 1.3 × 10⁻⁴). Further, NDD CNVs were associated with increased body mass index in a multiancestry analysis (β = 0.19; 95% CI, 0.10-0.31; P = .003). For 36 common serum tests, there was no association with NDD CNVs.
Conclusions and Relevance
Clinical features of individuals harboring NDD CNVs were elucidated in a large-scale, multiancestry biobank, identifying enrichments for congenital disorders and major depressive disorder as well as associations with several medical outcomes, including hypertension, kidney failure, and obesity and obesity-related phenotypes, specifically obstructive sleep apnea and increased body mass index. The association between NDD CNVs and obesity outcomes indicate further potential pleiotropy of NDD CNVs beyond neurodevelopmental outcomes previously reported. Future clinical genetic investigations may lead to insights of at-risk individuals and therapeutic strategies targeting specific genetic variants. The importance of diverse inclusion within biobanks and considering the effect of rare genetic variants in a multiancestry context is evident.
Introduction
Clinical genomic investigations to date have identified rare copy number variants (CNVs; ie, genomic microdeletions or microduplications greater than 1 kilobase) pathogenic for neurodevelopmental disorders (NDDs), including schizophrenia, autism spectrum disorder, and intellectual disability.1,2,3 Initial studies of CNVs in NDD used chromosomal microarray analyses, while recent discovery and validation studies leveraged genome-wide association analyses, with CNVs called from genotyping arrays.2,3,4,5,6 Among NDD-pathogenic CNVs, 8 CNVs are reported to occur at significantly increased frequencies in individuals with schizophrenia compared with controls, including the 22q11.2 deletion underlying velocardiofacial syndrome, which is among the most well-studied and clinically characterized.2,7,8 Nearly all NDD-pathogenic CNVs have a greater effect on disease risk compared with common genetic variants. For example, the reported odds ratios (ORs) of schizophrenia-associated CNVs range from 3 to 60, whereas the OR conferred by most single-nucleotide variants (formerly single-nucleotide polymorphisms) identified as significant in schizophrenia genome-wide association analyses is less than 1.2.2,9 Further, NDD-pathogenic CNVs have been established as both inherited and de novo risk factors.10
Despite considerable investigation of NDD-pathogenic CNVs, significant gaps in clinical characterization remain. First, pleiotropy, or nonspecificity of NDD-pathogenic CNVs, remains unexplained—that is, the same CNV may confer risk for multiple NDDs.11 Second, variable penetrance and expressivity remain poorly understood among NDD-CNV carriers, and developmental or neuropsychiatric symptomatology ranges from unaffected to severely affected.12 Some studies suggest background polygenic risk influences penetrance; others suggest a 2-hit model, whereby a large NDD CNV exacerbates neurodevelopmental phenotypes in association with other large deletions or duplications.13,14,15,16 Most clinical reports of NDD-pathogenic CNVs to date have focused on neuropsychiatric traits, in samples selected for NDDs, absent overall medical comorbidities.5,6 Lastly, most population cohorts and registries or large-scale biobank studies to date of CNVs have been limited to European ancestry, limiting overall clinical generalizability.17,18,19,20
The pathogenic factor within many NDD-pathogenic CNV regions remains unknown; it is unclear if the pathogenic factor is a gene dosage effect of protein-coding gene(s), noncoding species (ie, microRNA), modifying regulatory element, or other factor.21,22 Further investigation of CNV carriers may elucidate underlying mechanisms of pathogenesis and also accelerate potential translational efforts and precise therapeutic strategies. Clinical investigation of CNV carriers is challenging, however, given their rare frequency and requisite access to large-scale clinical and genetic resources concurrently. Several research consortia focus on individual CNVs (ie, 22q11 deletion or 3q29 deletion), while others focus on CNVs in aggregate, for example, the Deciphering Developmental Disorders project or the CNV Working Group of Enhancing Imaging Genetics Through Meta-Analysis (ENIGMA-CNV), the latter of which investigates neuroimaging outcomes.23,24,25 The study of multiple NDD CNVs is advantageous, as it enables inter-CNV comparison and assessment of composite clinical outcomes.
The current study leveraged a robust clinical genetics resource, the BioMe biobank, a genetics repository linked to electronic health records (EHRs) of approximately 25 000 individuals recruited across diverse medical specialties and across ancestry and socioeconomic background.26,27 In a forward genetics approach, individuals harboring NDD CNVs were identified without phenotypic ascertainment bias, followed by a series of novel in-silico clinical assessments. The genetics repository enabled the identification of individuals who harbor NDD CNVs, while the EHR data enabled investigation of clinical indices, including diagnostic codes, laboratory serum tests, and clinical descriptive data.
Methods
BioMe Biobank
BioMe is an EHR-linked biobank of participants from the Mount Sinai Health System, New York, New York. Participants were recruited throughout the Mount Sinai Health System across age and self-reported ancestry and from diverse medical and neuropsychiatric clinics, as approved by the Institutional Review Board of the Mount Sinai School of Medicine (eMethods and eTable 1 in the Supplement). Per the approved protocol, no disclosure or feedback of genetic results would be provided, as the analyses were for research purposes. Further, the Institutional Review Board of the Mount Sinai School of Medicine approved BioMe data access for the current analysis, including a waiver of informed consent to permit review of EHRs.
Sample Genotyping and Exome Sequencing
As previously described, the biobank participants were genotyped on Infinium Global Screening Array (Illumina).27 Exome sequencing was performed at the Regeneron Genetics Center, Tarrytown, New York (eMethods in the Supplement).
CNV Calling
The 64 NDD CNVs called in the current analysis were reported in previous biobank reports (ie, UK Biobank [UKBB] and Geisinger DiscovEHR), described as CNVs pathogenic for neurodevelopment disorders (NDD), and culled from 92 CNVs in 47 genomic locations, including reciprocal deletions and duplications.5,6,17,18,28,29 A CNV was called based on the consensus of 2 algorithms (each using a different type of sequence data), a whole-exome sequencing–based method, Lattice-Aligned Mixture Models (CLAMMS), and a genotype array-based method, PennCNV (eMethods in the Supplement).30,31 Only BioMe samples with both whole-exome sequencing–based CLAMMS and array-based PennCNV calls, subsequent to filtering and quality control (n = 24 877), were included; samples with a CNV called by one but not both calling methods were excluded from downstream analyses (eMethods in the Supplement). Individuals were designated as positive for a CNV if breakpoints overlapped at least 50% of the defined critical region and, for single-gene CNV deletions (eg, NRXN1 deletion), intersected at least 1 exon.17,18
Statistical Analysis
Enrichment for Neuropsychiatric Disorders
For phenotypic enrichment analyses, individuals without phenotype data or with less than 2 clinical encounters were excluded to increase reliability of phenotypic analyses, yielding a sample of 22 279 individuals. Fisher exact test queried statistical significance (2-sided P value < .05) of an aggregate set of NDD CNVs for neurodevelopmental and neuropsychiatric disorders. Multiple-testing Benjamini-Hochberg false discovery rate (FDR) was also reported (significance set at FDR < .05) (eMethods in the Supplement). Enrichment analyses were performed in R version 3.6.3 (The R Foundation).
Phenome-Wide Association Analyses
To decrease potential confounding effects of relatedness, a random individual from each related pair with more than second-degree relatedness was excluded, based on genotype data (kinship coefficient > 0.0885; eMethods in the Supplement). Phenome-wide association analyses (PheWAS) used REGENIE, a machine-learning method developed especially for rare variant analysis of binary (case-control) traits with unbalanced case-control ratios.32 International Classification of Diseases, Ninth Revision (ICD-9) and ICD-10 were mapped to hierarchically clustered phenotype codes (phecodes).33,34 For each phecode, cases and controls were determined longitudinally, with a case defined as at least 2 counts, a control as 0, while a count of 1 was set to missing for the phecode. Phecodes were filtered for a minimum of 100 cases for each ancestry group (African, European, and Hispanic) to ensure robust analyses, so that only the more prevalent phecodes across the biobank cohort (195 of 1736) were tested (eMethods in the Supplement). Using REGENIE version 2.0.2, each phecode was regressed onto CNV (binary) status with covariates of age, sex, ancestry, principal components 1 to 5 of genotype data, and density of EHRs. In addition to ancestry-stratified analyses, multiancestry meta-analyses were conducted using METAL version August 28, 2018.35 Multiple-testing correction was reported using 2 alternative methods, Benjamini-Hochberg FDR, with significance set at FDR < .05, and Bonferroni-corrected P value, with significance set at P < .05.
Association Analyses With Quantitative Outcome
Median body mass index (BMI) and serum laboratory values were inverse-normal transformed and regressed onto NDD CNV status (binary variable), adjusting for covariates of age, sex, ancestry, principal components 1 to 5 of the genotype data, and density of EHRs (eMethods in the Supplement). For association analyses of serum laboratory values, P values were corrected using Benjamini-Hochberg FDR, with significance set at FDR < .05. Association analyses were performed in R version 3.6.3.
Results
The biobank cohort used in the current CNV study is multiancestry and consists of a range of ages at enrollment but is skewed toward older adults, with few pediatric participants (613 [2.5%] younger than 18 years) and more women than men. Of 24 877 included participants, 14 586 (58.7%) were female; 5965 (24.0%) were of African ancestry, 7892 (31.7%) of European ancestry, 8536 (34.3%) of Hispanic ancestry, and 2484 (10.0%) of other ancestry, including Asian and American Indian ancestries; and the mean (SD) age was 50.5 (17.3) years (Table 1). To initiate the current investigation, individuals harboring NDD CNVs (any of 64 NDD CNVs) were identified within the biobank.
Table 1. BioMe Biobank Demographic Overview.
| Characteristic | No. (%) | P valuea | |
|---|---|---|---|
| Total (N = 24 877) | Participants with NDD-CNV (n = 627) | ||
| Ancestryb | |||
| African | 5965 (24.0) | 168 (26.8) | .10 |
| European | 7892 (31.7) | 208 (33.2) | .46 |
| Hispanic | 8536 (34.3) | 200 (31.9) | .21 |
| Otherc | 2484 (10.0) | 51 (8.1) | .15 |
| Age | |||
| Mean (SD), y | 50.5 (17.3) | 50.4 (17.0) | .87 |
| <18 y | 613 (2.5) | 15 (2.4) | NA |
| Female | 14 586 (58.7) | 389 (62.0) | .09 |
Abbreviations: CNV, copy number variant; NA, not applicable; NDD, neurodevelopmental disorder.
P value is derived from χ2 test for categorical variables (sex and ancestry) and 2-sided t test for age, comparing individuals with NDD CNVs (n = 627) and individuals without NDD CNVs (N = 24 250).
Ancestry is self-reported.
The ancestry category of other includes individuals not self-reporting as African, European, or Hispanic ancestries and includes Asian and American Indian ancestries.
CNV Prevalence
CNVs were called from the consensus of 2 algorithms, a whole-exome sequencing–based method (CLAMMS) and a genotype array-based method (PennCNV), yielding the result that 627 individuals (2.5%) within the biobank harbor an NDD CNV (Table 2).30,31 Within the biobank, age, sex, and ancestry did not differ significantly for the subset of NDD CNV carriers compared with individuals without NDD CNVs, and the mean (SD) age of NDD CNV carriers was 50.4 (17.0) years (Table 1).
Table 2. Neurodevelopmental Disorder (NDD) Copy Number Variants (CNVs) in the BioMe Biobanka.
| CNV | Location (hg19) | Genes, No. | Participants harboring NDD CNV, No. | Prevalence, % |
|---|---|---|---|---|
| TAR_del | chr1:145,39–145,81 | 17 | 5 | 0.020 |
| TAR_dup | chr1:145,39–145,81 | 17 | 18 | 0.072 |
| 1q21.1del | chr1:146,53–147,39 | 9 | 8 | 0.032 |
| 1q21.1dup | chr1:146,53–147,39 | 9 | 3 | 0.012 |
| NRXN1_del | chr2:50,14–51,26 | 1 | 3 | 0.012 |
| 2q11.2del | chr2:96,74–97,68 | 22 | 2 | 0.008 |
| 2q11.2dup | chr2:96,74–97,68 | 22 | 1 | 0.004 |
| 2q13del(NPHP1) | chr2:110,86–110,98 | 3 | 81 | 0.326 |
| 2q13dup(NPHP1) | chr2:110,86–110,98 | 3 | 62 | 0.249 |
| 2q13del | chr2:111,39–112,01 | 3 | 3 | 0.012 |
| 2q13dup | chr2:111,39–112,01 | 3 | 8 | 0.032 |
| 2q21.1del | chr2:131,48–131,93 | 5 | 9 | 0.036 |
| 2q21.1dup | chr2:131,48–131,93 | 5 | 5 | 0.020 |
| 3q29del | chr3:195,72–197,35 | 28 | 1 | 0.004 |
| 3q29dup | chr3:195,72–197,35 | 28 | 0 | 0 |
| Sotos_5q35del | chr5:175,72-177,05 | 39 | 0 | 0 |
| 5q35dup | chr5:175,72-177,05 | 39 | 0 | 0 |
| 7q11.23_del | chr7:72,74–74,14 | 26 | 1 | 0.004 |
| 7q11.23_dup | chr7:72,74–74,14 | 26 | 0 | 0 |
| 7q11.23dup_distal | chr7:75,14–76,06 | 16 | 0 | 0 |
| 8p23.1del | chr8:8,10–11,87 | 35 | 0 | 0 |
| 8p23.1dup | chr8:8,10–11,87 | 35 | 0 | 0 |
| 10q11.21q11.23del | chr10:49,39–51,06 | 19 | 1 | 0.004 |
| 10q11.21q11.23dup | chr10:49,39–51,06 | 19 | 2 | 0.008 |
| 10q23del | chr10:82,05–88,93 | 29 | 0 | 0 |
| 10q23dup | chr10:82,05–88,93 | 29 | 1 | 0.004 |
| 13q12del(CRYL1) | chr13:20,98–21,10 | 2 | 8 | 0.032 |
| 13q12dup(CRYL1) | chr13:20,98–21,10 | 2 | 0 | 0 |
| 13q12.12del | chr13:23,56–24,88 | 10 | 4 | 0.016 |
| 13q12.12dup | chr13:23,56–24,88 | 10 | 9 | 0.036 |
| 15q11.2del | chr15:22,81–23,09 | 5 | 60 | 0.241 |
| 15q11.2dup | chr15:22,81–23,09 | 5 | 163 | 0.655 |
| PW/AS 15q11.2q13.1 BP1-3_del | chr15:23,68–28,39 | 116 | 0 | 0 |
| PW/AS 15q11.2q13.1 BP1-3_dup | chr15:23,68–28,39 | 116 | 0 | 0 |
| 15q11q13del_BP3-BP4 (APBA2_TJP) | chr15:29,16–30,38 | 4 | 1 | 0.004 |
| 15q11q13dup_BP3-BP4 (APBA2_TJP) | chr15:29,16–30,38 | 4 | 3 | 0.012 |
| 15q11q13dup_BP3-BP5 | chr15:29,16–32,46 | 17 | 0 | 0 |
| 15q13.3del | chr15:31,08–32,46 | 8 | 5 | 0.020 |
| 15q13.3dup | chr15:31,08–32,46 | 8 | 5 | 0.020 |
| 15q13.3del(CHRNA7) | chr15:32,02–32,46 | 1 | 5 | 0.020 |
| 15q13.3dup(CHRNA7) | chr15:32,02–32,46 | 1 | 42 | 0.169 |
| 15q24del | chr15:72,90-78,15 | 77 | 0 | 0 |
| 15q24dup | chr15:72,90–78,15 | 77 | 0 | 0 |
| 16p13.11del | chr16:15,51–16,29 | 7 | 13 | 0.052 |
| 16p13.11dup | chr16:15,51–16,29 | 7 | 39 | 0.157 |
| 16p12.1del | chr16:21,95–22,43 | 8 | 2 | 0.008 |
| 16p12.1dup | chr16:21,95–22,43 | 8 | 14 | 0.056 |
| 16p11.2distal_del | chr16:28,82–29,05 | 11 | 5 | 0.020 |
| 16p11.2distal_dup | chr16:28,82–29,05 | 11 | 4 | 0.016 |
| 16p11.2del | chr16:29,65–30,20 | 30 | 15 | 0.060 |
| 16p11.2dup | chr16:29,65–30,20 | 30 | 4 | 0.016 |
| 17p12del | chr17:14,14–15,43 | 8 | 6 | 0.024 |
| 17p12dup | chr17:14,14–15,43 | 8 | 10 | 0.040 |
| Smith Magenis Syndrome_17p11.2del | chr17:16,81–20,21 | 59 | 0 | 0 |
| Potocki-Lupski syndrome_17p11.2dup | chr17:16,81–20,21 | 59 | 0 | 0 |
| 17q11.2del(NF1) | chr17:29,12–30,27 | 19 | 0 | 0 |
| 17q11.2dup(NF1) | chr17:29,12–30,27 | 19 | 0 | 0 |
| 17q12del | chr17:34,81–36,22 | 17 | 4 | 0.016 |
| 17q12dup | chr17:34,81–36,22 | 17 | 4 | 0.016 |
| 17q21.31del | chr17:43,70-44,29 | 10 | 0 | 0 |
| 22q11.2del | chr22:19,04–21,47 | 61 | 1 | 0.004 |
| 22q11.2dup | chr22:19,04–21,47 | 61 | 7 | 0.028 |
| 22q11.2distal_del | chr22:21,92–23,65 | 26 | 0 | 0 |
| 22q11.2distal_dup | chr22:21,92–23,65 | 26 | 0 | 0 |
Abbreviations: del, deletion; dup, duplication.
Each of 64 neurodevelopmental disorder CNVs genotyped in the biobank using a consensus of 2 CNV calling algorithms.
Prevalence varied by CNV locus and type, notable for 5 highly prevalent CNVs: chr15q11.2 deletion and duplication, chr2q13 (NPHP1) deletion and duplication, and chr15q13.3 (CHRNA7) duplication (Table 2). Only 1 carrier of the 22q11.2 hemizygous deletion was identified, and for 21 CNVs, no carriers were identified (eg, chr15-PWS-DUP, chr17 Potocki-Lupski syndrome). The prevalence of each NDD CNV in BioMe was compared with previously reported CNV analyses of the larger-scale UKBB (n = 421 268) and DiscovEHR (n = 90 595) (eTable 2A in the Supplement).17,18 Six NDD CNVs were identified as significantly different in prevalence in BioMe compared with UKBB, including the 5 relatively common NDD CNVs; 4 were decreased in the BioMe biobank (2q13 [NPHP1] deletion, 2q13 [NPHP1] duplication, 15q13.3 [CHRNA7] duplication, and 15q11.2 deletion) and 1 was increased (15q11.2 duplication) (eTable 2B in the Supplement).17,18 Within BioMe, no significant difference of individual NDD CNV prevalence was observed across ancestry groups (eTable 2C in the Supplement).
In assessing relatedness among NDD CNV carriers, 99 pairs of at least second-degree relatedness were identified, including 17 pairs in whom both relatives harbored NDD CNVs and 82 pairs in which one but not both relatives harbored an NDD CNV (eTable 3 in the Supplement). Furthermore, among NDD CNV carriers, 20 individuals harbored 2 NDD CNVs. For a series of phenotype enrichment/association analyses, individuals harboring NDD CNVs were aggregated, excluding individuals harboring 4 relatively common NDD CNVs (15q11.2 duplication, 2q13 [NPHP1] deletion and duplication and 15q13.3 [CHRNA7] duplication) to permit the assessment of pooled NDD CNVs of rarer frequency.
Enrichment of Neuropsychiatric Disorders
First, individuals harboring NDD CNVs were tested for enrichment of select NDDs (Table 3; eMethods and eTable 4 in the Supplement). The aggregate set of NDD CNV carriers (n = 267) were enriched for congenital disorders (OR, 2.0; 95% CI, 1.1-3.5; P = .01), but not schizophrenia nor seizure disorder. Ancestry-stratified enrichment analyses of NDD CNV carriers for congenital disorders did not yield significant enrichment for ancestry groups (eTable 5 in the Supplement). The subset of 22 NDD CNV carriers harboring at least one of 8 CNVs reported to be genome-wide significant for schizophrenia were also not enriched for schizophrenia (eTable 4 in the Supplement).
Table 3. Enrichment of Neurodevelopmental Disorder (NDD) Copy Number Variants (CNVs) for Neurodevelopmental and Neuropsychiatric Disorders in the BioMe Biobanka.
| Disorder | No. | OR (95% CI) | P valueb | FDRc |
|---|---|---|---|---|
| Neurodevelopmental disorder | ||||
| Schizophrenia/other schizophrenia spectrum psychosis | 412 | 1.2 (0.4-2.7) | .64 | .77 |
| ASD/intellectual disability | 29 | 6.1 (0.7-24.7) | .05 | .09 |
| Congenital disorders | 639 | 2.0 (1.1-3.5) | .01 | .04 |
| Epilepsy/seizure | 342 | 0.9 (0.3-2.6) | >.99 | >.99 |
| Adult-onset neuropsychiatric disorder | ||||
| Bipolar disorder | 329 | 1.3 (0.4-3.1) | .60 | >.99 |
| Major depressive disorder | 3668 | 1.5 (1.1-2) | .01 | .04 |
Abbreviations: ASD, autism spectrum disorders; FDR, false discovery rate; OR, odds ratio.
See eTable 4 in the Supplement for description of each disorder by International Classification of Diseases code and for tabulation of neurodevelopmental disorder copy number variants tested.
Two-sided Fisher exact test for neurodevelopmental disorder copy number variant enrichment by disorder.
FDR is calculated using the Benjamini-Hochberg FDR method.
Enrichment for autism spectrum disorder and intellectual disability was not significant for the NDD CNVs (OR, 6.1; 95% CI, 0.7-24.7; P = .05), limited by few cases represented in BioMe; within the BioMe cohort, the prevalence of childhood or developmental disorders is low (BioMe autism spectrum disorder and intellectual disability prevalence = 0.13% [29 of 22 279]; ICD-10 codes, F84 and F70-F79) owing to few pediatric participants compared with adult-onset disorders, which better approximate overall population prevalence (ie, BioMe schizophrenia prevalence = 1.1% [243 of 22 279]; ICD-10 code, F20).
NDD CNVs were enriched for major depressive disorder (MDD; OR, 1.5; 95% CI, 1.1-2.0; P = .01), with the MDD enrichment driven by individuals of African ancestry (OR, 2.0; 95% CI, 1.2-3.2; P = .01) (eTable 5 in the Supplement). In contrast, there was no NDD CNV enrichment for bipolar disorder (OR, 1.3; 95% CI, 0.4-3.1; P = .60).
Association With ICD Diagnosis Codes
To investigate phenotypic associations broadly beyond select neuropsychiatric disorders, an agnostic PheWAS was next applied to test the association of NDD CNVs with ICD codes, coded medical diagnoses across organ systems.36,37 Here, PheWAS tested 195 hierarchically clustered ICD phecodes for their association with NDD CNVs (eTables 6 and 7 in the Supplement). Each PheWAS was stratified by ancestry (African, European, and Hispanic) as well as combined in a multiancestry meta-analysis. Overall, multiancestry PheWAS yielded several significant associations (Figure; eTable 8 in the Supplement). An aggregate set of 238 NDD CNVs (excluding 4 relatively common NDD CNVs) was significantly associated with 8 phecodes. Top significant associations were identified with a genitourinary phenotype, urinary tract infection (z score = 4.4; P = 1.2 × 10⁻⁵) and morbid obesity (z score = 3.8; P = 1.3 × 10⁻⁴); other significant associations included essential hypertension (z score = 3.4; P = 6.9 × 10⁻⁴), inflammatory neuropathy (z score = 3.3; P = 8.8 × 10⁻⁴) and other symptoms, back pain (z score = 3.5; P = 5.7 × 10⁻⁴), and nonspecific chest pain (z score = 3.2; P = 1.6 × 10⁻³) (eTable 8A in the Supplement).
Figure. Phenome-Wide Association Analysis (PheWAS) of Neurodevelopmental Disorder (NDD) Copy Number Variants (CNVs), Multiancestry Meta-analysis.
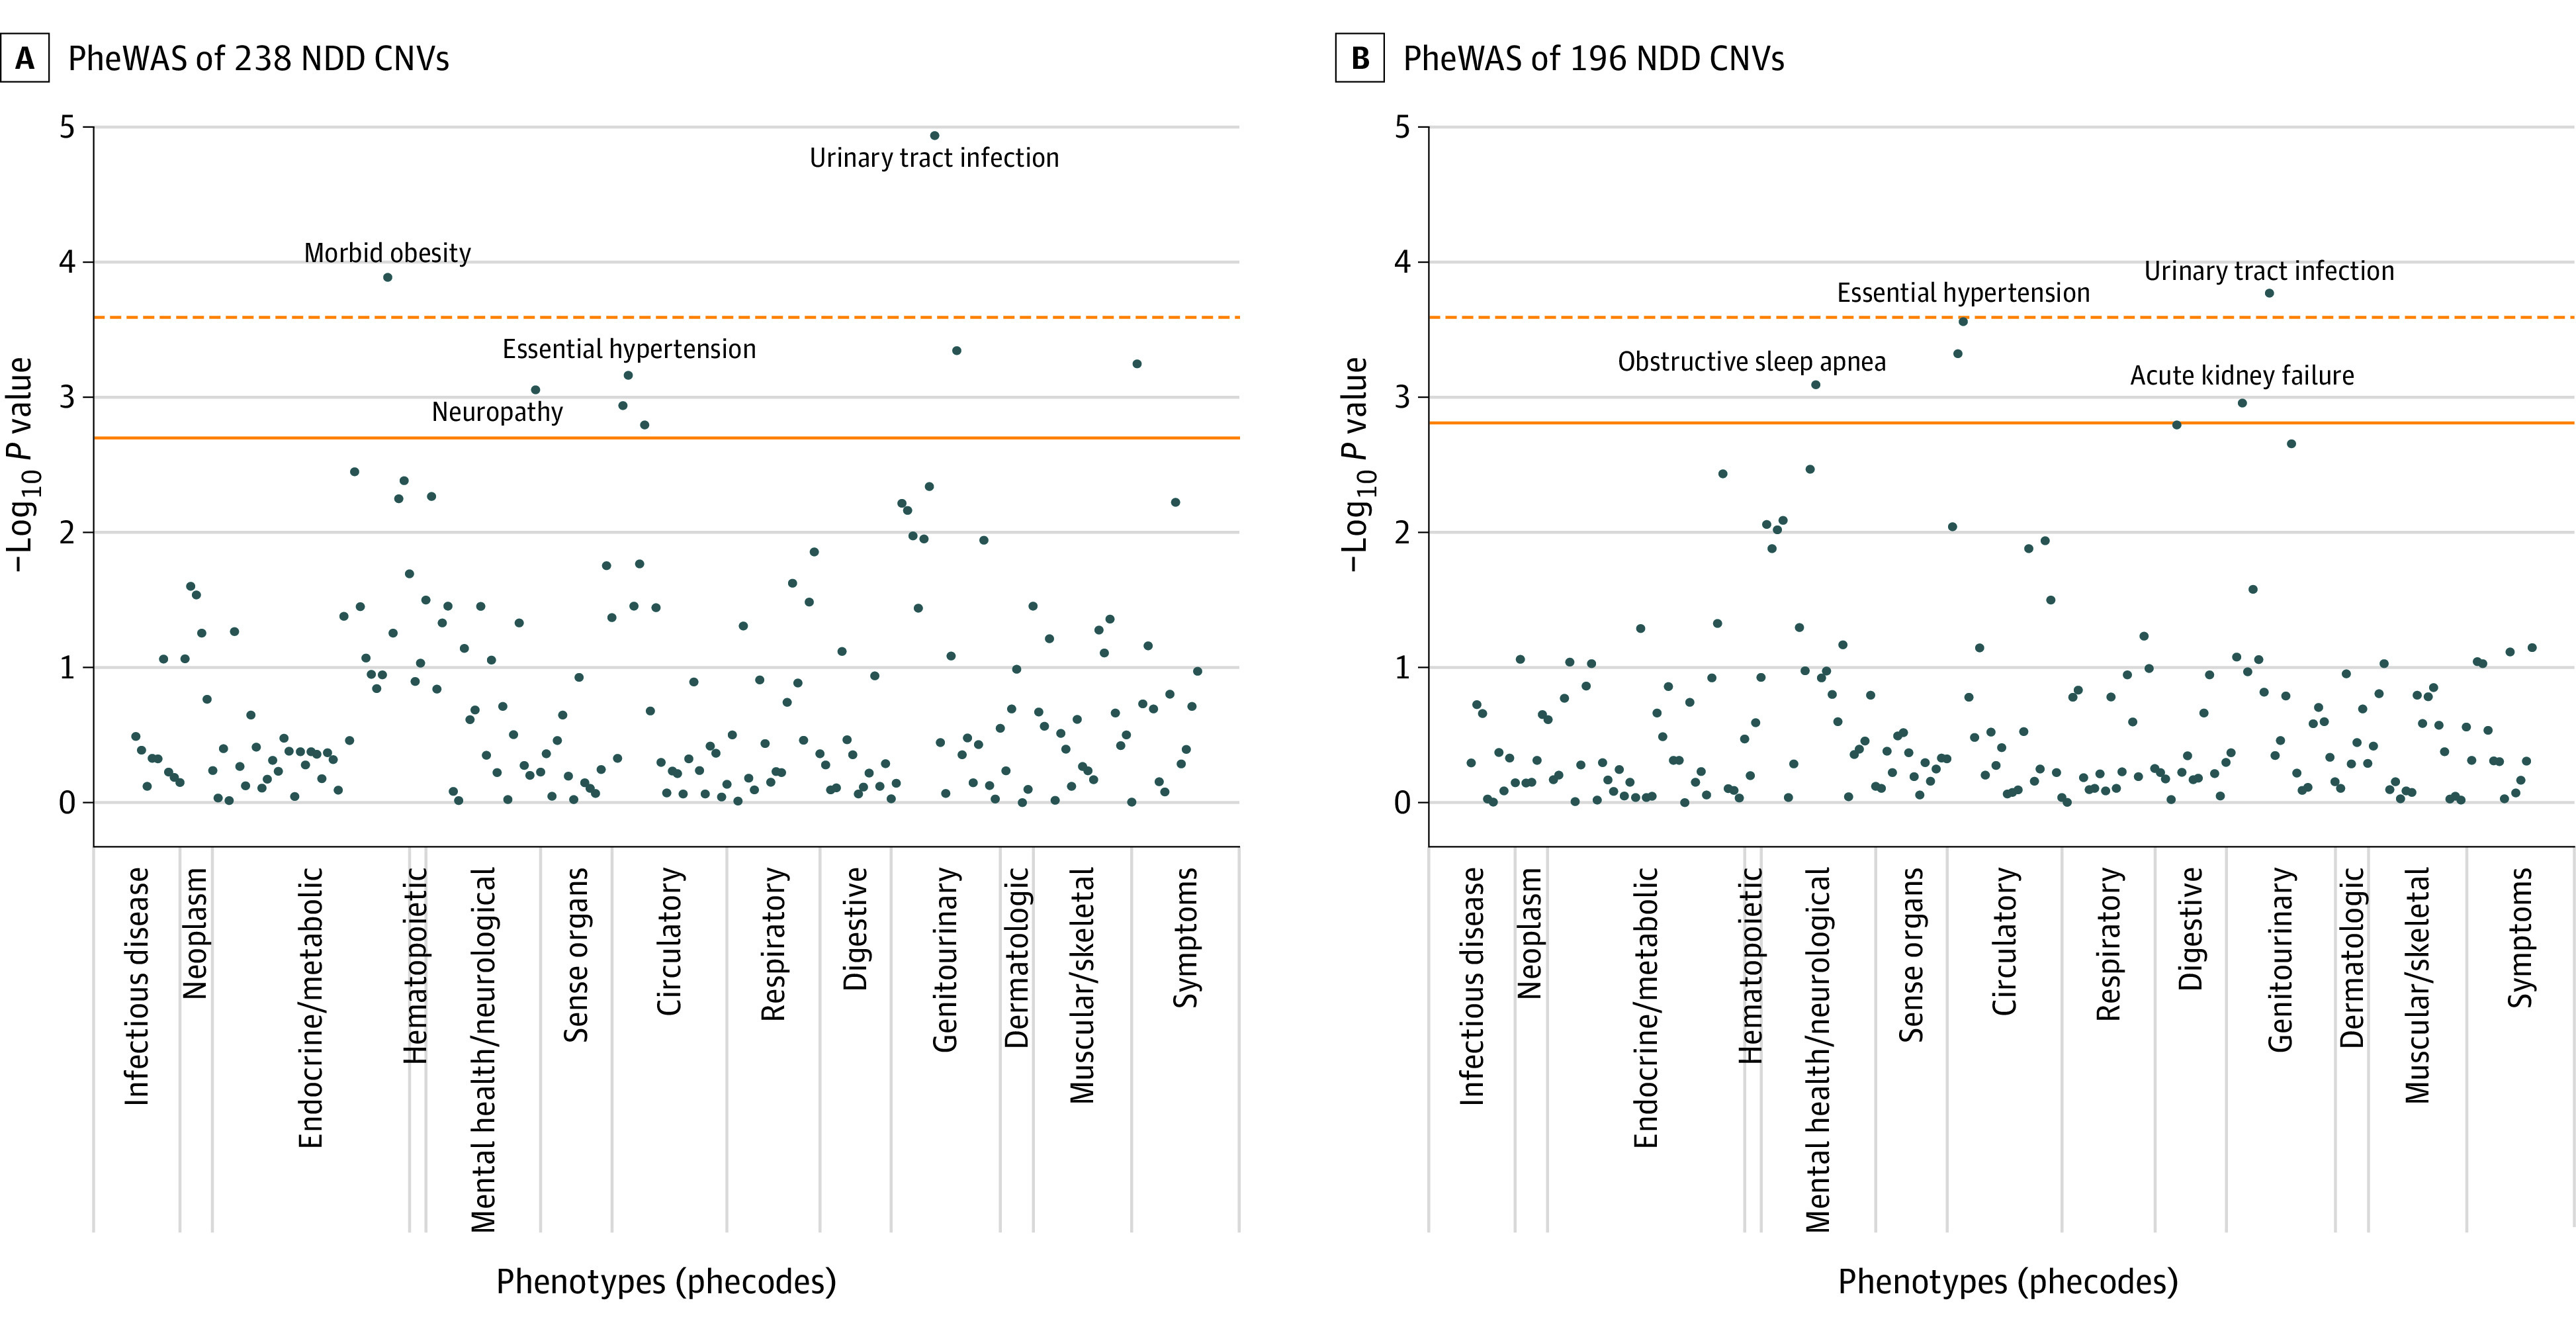
Manhattan plots of PheWAS results for 238 NDD CNVs, excluding 4 relatively common NDD CNVs (A), and 193 NDD CNVs, excluding 5 relatively common NDD CNVs (B). For each plot, 195 International Classification of Diseases, Ninth Revision (ICD-9)– and ICD-10–based phecodes are on the x-axis, and the order of the phecodes on the x-axis corresponds to the order in eTable 6 in the Supplement, where each phecode is also defined. Detailed PheWAS results can be found in eTable 8A and B in the Supplement. The solid horizontal line indicates the Benjamini-Hochberg false discovery rate threshold of .05, and the dotted horizontal line indicates the Bonferroni-corrected P value.
Further, to enable a more direct comparison with a previously published UKBB analysis of NDD CNVs, an alternative set of 193 NDD CNVs was queried, excluding 5 relatively common CNVs (4 relatively common CNVs as previously and 15q11.2 deletion).18 In this multiancestry PheWAS, 6 significant associations were observed, 3 overlapping the previous PheWAS. The top 2 significant associations were identified with urinary tract infection (z score = 3.8; P = 1.7 × 10⁻⁴) and essential hypertension (z score = 3.6; P = 2.8 × 10⁻⁴). In addition, significant associations were observed with obstructive sleep apnea (z score = 3.4; P = 8.1 × 10⁻⁴), acute kidney failure (z score = 3.3; P = 1.1 × 10⁻³), and dysphagia (z score = 3.2; P = 1.6 × 10⁻³) (eTable 8B in the Supplement).
Association With Clinical Indices (BMI and Laboratory Values)
Further, we investigated the association of NDD CNVs with quantitative clinical outcomes, BMI, and common serum laboratory values. The aggregate 226 NDD CNVs were found to be associated with increased BMI (β = 0.19; 95% CI, 0.10-0.31; P = .003) (eTable 9 and eFigure in the Supplement). An interaction analysis indicated that ancestry did not have a statistically significant interaction with NDD CNV status on BMI outcome. Of note, the 16p11.2 deletion (associated with BMI in past reports) was distributed among ancestries (3 of African ancestry, 4 of European ancestry, and 3 of Hispanic ancestry).
In addition, obstructive sleep apnea (OSA), a phenotype found to be significant in the presently reported PheWAS (Figure; eTable 8B in the Supplement), widely considered an obesity-related phenotype, was queried to confirm obesity status within the biobank.38 Individuals diagnosed with OSA were found to have significantly increased BMI compared with those without OSA (t1252 = 29.3; P < 2.2 × 10⁻¹⁶), with increased probability of an obesity diagnosis (ICD-10 codes 278 or 278.1) compared with those without OSA (OR, 6.8; 95% CI, 6.0-7.7).
Lastly, aggregate NDD CNVs were tested for their association with 36 common serum laboratory tests, given their widespread medical utility, including commonly ordered panels, comprehensive metabolic panel, complete blood count, and lipid panel. No significant associations were observed after multiple testing correction (eTable 10 in the Supplement).
Discussion
In the current study, individuals who harbor rare CNVs that are known risk factors for NDD were identified within the BioMe biobank and their clinical presentation surveyed. The leveraged biobank is advantageous in its multiancestry composition and repository of robust clinical data. Overall, per the consensus of 2 CNV calling algorithms, 2.5% of individuals within BioMe harbored at least 1 of 64 NDD CNVs. Ancestry distribution of NDD CNV carriers was comparable with ancestry distribution of the biobank overall (approximately one-third of European ancestry and approximately one-quarter of African ancestry). Further, 21 NDD CNVs did not have any carriers within this biobank. The prevalence of individual NDD CNVs varied compared with previous biobank reports, the UKBB (n = 421 268) and Geisinger DiscovEHR (n = 90 595) by CNV locus.17,18 The divergence in ancestry across biobanks is notable, as the UKBB and Geisinger DiscovEHR cohorts are nearly exclusively of European ancestry (ie, 98% of European ancestry in the DiscovEHR), while BioMe is markedly multiancestry. Compared with the DiscovEHR cohort, the same NDD CNVs that had no carriers in DiscovEHR also had no carriers in BioMe. Compared with the UKBB, there was an inversion of counts at some CNV loci within BioMe, including at 16p11.2 and 1q21.1 loci, for which more deletions than duplications were observed; in the UKBB, more duplications than deletions were observed. In addition, 4 relatively highly prevalent NDD CNVs were found to be decreased in prevalence in BioMe compared with UKBB, (2q13 [NPHP1] deletion/duplication, chr 15q11.2 deletion, and 15q13.3 [CHRNA7] duplication), an unexpected finding, given that the UKBB was formed with an intention to recruit a healthy cohort, while BioMe, recruited from a health care system. However, the differences between BioMe and UKBB at some CNV loci do not appear to be directly attributable to ancestry divergence, as within BioMe, CNV prevalence did not differ significantly by ancestry groups. Alternatively, false-negatives (that is, undercalling of CNVs) could have occurred in the current analysis, a potential systematic bias in genotype array–based algorithms and other CNV calling algorithms.39 The current analysis included a more stringent consensus of 2 CNV calling algorithms, in contrast to the UKBB CNV analyses to date, which used 1 genotype array–based CNV calling algorithm.18
Within BioMe, among NDD CNV carriers, there was a significant enrichment for congenital disorders, confirming previous reports.5,6,17 MDD was also found to be significantly enriched, addressing in part conflicting past reports about the enrichment of NDD CNVs in individuals with MDD.40,41 However, in contrast to the UKBB finding of enrichment of MDD in the cohort of European ancestry, the current BioMe analysis yielded enrichment of MDD among individuals of African ancestry but not Hispanic or European ancestry.40 These differences may in part represent power differential related to differences in European ancestry sample sizes. There was no enrichment for schizophrenia nor seizure disorder for NDD CNVs, potentially indicative of heterogeneity within the BioMe biobank. Alternatively, the current disease enrichment findings may differ from previous findings owing to ancestry composition, as previous reports included mostly individuals of European ancestry, contrasted with the current multiancestry analysis.
The current study used a filtering criteria of at least 2 ICD codes to validate a diagnosis and a minimum engagement of 2 clinical encounters, but the validity of ICD codes as a proxy for neuropsychiatric diagnosis warrants ongoing assessment. Future studies may incorporate phenotyping algorithms and computational tools to mine EHR data and to identify and validate NDD cases, as has been developed for mood disorders, or alternatively implement semistructured interviews of a subset of biobank participants to validate the EHR-based diagnostic coding.42
A previous UKBB analysis tested NDD CNVs for association with 58 common medical phenotypes, identifying 46 individual phenotype-CNV associations (FDR < 0.1), obesity being the most frequent (associated with TAR duplication, 16p13.11 deletion, 16p12.1 deletion, 16p11.2 distal deletion, and 16p11.2 deletion), followed by kidney failure (associated with 3q29 duplication, 16p12.1 deletion, 16p11.2 deletion, and 17q12 duplication), and hypertension (associated with 16p13.11 duplication, 16p12.1 deletion, and 16p11.2 deletion). The current BioMe analysis tested an expanded set of 195 phenotypes for association with aggregate NDD CNVs, replicating the UKBB analysis by also identifying significant enrichment for obesity, kidney failure, and hypertension. In addition, significant associations were identified with phenotypes not tested in the UKBB analysis, including urinary tract infection and an obesity-related phenotype, obstructive sleep apnea.38 Overall, multiple PheWAS-significant associations identified across organ system in the current multiancestry analysis indicates a potential increased burden of medical illness in NDD CNV carriers, warranting future inquiry and elucidation, especially given the preponderance of past focus on neuropsychiatric effects of NDD CNV carriers.
Furthermore, corroborating the obesity associations identified by PheWAS in the present analysis, the aggregate NDD CNVs were significantly associated with a quantitative outcome, increased BMI. While the 16p11.2 deletion is a well-characterized risk factor for obesity, this implicates the potential role of other NDD CNVs in obesity.43,44 The association between NDD CNVs and obesity, including BMI, may be explored further, as studies to date are limited one-off studies of obesity in specific CNV syndromes, with some clinical and molecular reports indicating a need for more systematic, in-depth investigation.45,46,47 As for common risk variants, joint genome-wide association analysis of BMI and an adult-onset NDD, schizophrenia, indicate an overlap of 63 loci (FDR < 0.01), although with variants demonstrating opposite directionality and a negative genetic correlation (r = −0.11); in another study, risk variants for BMI and schizophrenia were notable for 3-dimensional interaction within dopaminergic neurons.48,49 Overall, the role of the central nervous system in obesity is becoming increasingly apparent, underscored by functional genomic studies of obesity risk loci, implicating brain-specific functional pathways.50
Future recall of NDD CNV carriers may permit clinical measurements beyond EHR-based outcomes, such as neurocognitive or neuroimaging outcomes as well as clinical interviews to obtain more detailed psychiatric symptomatology and retrospective childhood and developmental history. The role of other NDD-associated genetic variants may be investigated in future biobank investigations, namely exome sequencing variants. In addition, the investigation of other genomic CNVs may illuminate their role in influencing NDD or NDD-related phenotypes. The role of background polygenic risk in influencing penetrance, or NDD-case status, is critical, albeit not examined in the current multiancestry study, given the existing disparity in the availability of polygenic risk scores across ancestry.51
Limitations
This study has some limitations. The BioMe biobank (and indeed, any biobank) is affected by ascertainment bias, an important caveat (ie, approximately 67% of the BioMe cohort analyzed was recruited from outpatient medicine clinics). Further, the health care system from which BioMe is derived is not contained, so participants may receive care from other systems. An adult may present to BioMe having received care elsewhere as a child or adolescent, or may present for specialty medical care, having received psychiatric care elsewhere. EHR data incorporated in the current analysis dates to 2003 and 2004, limiting direct, early-life analyses for most adults.
Because of their rarity, analyses combined NDD CNVs across loci to ensure well-powered associations, but pooling may dilute heterogeneity of the effects of individual CNVs. Further, aggregate NDD CNV sets for the currently reported phenotypic enrichment and association analyses excluded 4 relatively common CNVs (ie, 15q11.2 duplication, 2q13 [NPHP1] deletion and duplication, and 15q13.3 [CHRNA7] duplication) to enable comparison with previously published NDD CNV analyses and to permit assessment of relatively rarer NDD CNVs. Although each NDD CNV was selected based on previous reports as per pathogenicity criteria defined by American College of Medical Genetics standards, the strength of evidence varies by NDD CNV locus.28,29 Associations with quantitative indices were limited to median BMI and serum laboratory values, but models using generalized linear mixed models may better fit biobank data, which may extend many years with repeated measurements. The current analyses used select strategies to control for some EHR variables (ie, threshold of number of encounters for inclusion, covarying for EHR density, REGENIE method for case/control imbalance), but further methodological innovations specific to large-scale biobank analyses may be incorporated, as they continue to emerge.52 Medication burden in NDD CNV carriers was not examined in the current report but may be queried in future analyses, an unlikely confounder of the currently reported phenotypic associations.
Conclusions
Overall, the present analyses illustrate the utility of a biobank-based approach to clinically characterize NDD CNVs. Enrichments for some previously reported phenotypes (congenital disorders) but not others (schizophrenia, seizure disorder) underscore the heterogeneity of the biobank as well as known variable penetrance and expressivity of these pathogenic CNVs. The noted enrichment for MDD augments support for a potential role of NDD CNVs in another neuropsychiatric phenotype. Consistent with reported pleiotropy, NDD CNVs may also be associated with select medical outcomes persisting in adulthood, including hypertension and obesity-related outcomes, warranting future investigation with translational implications. Clinical genetic investigations based on genetic stratification (ie, precision psychiatry) may lead to insights of at-risk individuals and novel therapeutic strategies targeting specific genetic variants. The importance of diverse inclusion within biobanks and considering the effect of rare genetic variants in a multiancestry context is evident.
eMethods.
eReferences.
eFigure. BMI by NDD CNV status.
eTable 1. BioMe recruitment by clinic.
eTable 2. NDD CNV prevalence, across biobanks, in BioMe vs UKBB, and by ancestry.
eTable 3. Related NDD CNV carriers.
eTable 4. Enrichment of NDD CNV carriers, multiancestry.
eTable 5. Enrichment of NDD CNV carriers, ancestry-stratified.
eTable 6. Phenotype counts for PheWAS of NDD CNVs.
eTable 7. NDD CNV counts for PheWAS.
eTable 8. PheWAS of NDD CNVs, multiancestry.
eTable 9. BMI association with NDD CNVs, multiancestry.
eTable 10. Serum laboratory test association with combined NDD CNVs, multiancestry.
References
- 1.Sebat J, Lakshmi B, Malhotra D, et al. Strong association of de novo copy number mutations with autism. Science. 2007;316(5823):445-449. doi: 10.1126/science.1138659 [DOI] [PMC free article] [PubMed] [Google Scholar]
- 2.Marshall CR, Howrigan DP, Merico D, et al. ; Psychosis Endophenotypes International Consortium; CNV and Schizophrenia Working Groups of the Psychiatric Genomics Consortium . Contribution of copy number variants to schizophrenia from a genome-wide study of 41,321 subjects. Nat Genet. 2017;49(1):27-35. doi: 10.1038/ng.3725 [DOI] [PMC free article] [PubMed] [Google Scholar]
- 3.Pinto D, Delaby E, Merico D, et al. Convergence of genes and cellular pathways dysregulated in autism spectrum disorders. Am J Hum Genet. 2014;94(5):677-694. doi: 10.1016/j.ajhg.2014.03.018 [DOI] [PMC free article] [PubMed] [Google Scholar]
- 4.Cooper GM, Coe BP, Girirajan S, et al. A copy number variation morbidity map of developmental delay. Nat Genet. 2011;43(9):838-846. doi: 10.1038/ng.909 [DOI] [PMC free article] [PubMed] [Google Scholar]
- 5.Coe BP, Witherspoon K, Rosenfeld JA, et al. Refining analyses of copy number variation identifies specific genes associated with developmental delay. Nat Genet. 2014;46(10):1063-1071. doi: 10.1038/ng.3092 [DOI] [PMC free article] [PubMed] [Google Scholar]
- 6.Dittwald P, Gambin T, Szafranski P, et al. NAHR-mediated copy-number variants in a clinical population: mechanistic insights into both genomic disorders and mendelizing traits. Genome Res. 2013;23(9):1395-1409. doi: 10.1101/gr.152454.112 [DOI] [PMC free article] [PubMed] [Google Scholar]
- 7.Tang SX, Gur RE. Longitudinal perspectives on the psychosis spectrum in 22q11.2 deletion syndrome. Am J Med Genet A. 2018;176(10):2192-2202. doi: 10.1002/ajmg.a.38500 [DOI] [PubMed] [Google Scholar]
- 8.Moberg PJ, Richman MJ, Roalf DR, et al. Neurocognitive functioning in patients with 22q11.2 deletion syndrome: a meta-analytic review. Behav Genet. 2018;48(4):259-270. doi: 10.1007/s10519-018-9903-5 [DOI] [PMC free article] [PubMed] [Google Scholar]
- 9.Schizophrenia Working Group of the Psychiatric Genomics Consortium . Biological insights from 108 schizophrenia-associated genetic loci. Nature. 2014;511(7510):421-427. doi: 10.1038/nature13595 [DOI] [PMC free article] [PubMed] [Google Scholar]
- 10.Wilfert AB, Sulovari A, Turner TN, Coe BP, Eichler EE. Recurrent de novo mutations in neurodevelopmental disorders: properties and clinical implications. Genome Med. 2017;9(1):101. doi: 10.1186/s13073-017-0498-x [DOI] [PMC free article] [PubMed] [Google Scholar]
- 11.Malhotra D, Sebat J. CNVs: harbingers of a rare variant revolution in psychiatric genetics. Cell. 2012;148(6):1223-1241. doi: 10.1016/j.cell.2012.02.039 [DOI] [PMC free article] [PubMed] [Google Scholar]
- 12.Kirov G. CNVs in neuropsychiatric disorders. Hum Mol Genet. 2015;24(R1):R45-R49. doi: 10.1093/hmg/ddv253 [DOI] [PubMed] [Google Scholar]
- 13.Tansey KE, Rees E, Linden DE, et al. Common alleles contribute to schizophrenia in CNV carriers. Mol Psychiatry. 2016;21(8):1085-1089. doi: 10.1038/mp.2015.143 [DOI] [PMC free article] [PubMed] [Google Scholar]
- 14.Bergen SE, Ploner A, Howrigan D, et al. ; CNV Analysis Group and the Schizophrenia Working Group of the Psychiatric Genomics Consortium . Joint contributions of rare copy number variants and common SNPs to risk for schizophrenia. Am J Psychiatry. 2019;176(1):29-35. doi: 10.1176/appi.ajp.2018.17040467 [DOI] [PMC free article] [PubMed] [Google Scholar]
- 15.Girirajan S, Rosenfeld JA, Cooper GM, et al. A recurrent 16p12.1 microdeletion supports a two-hit model for severe developmental delay. Nat Genet. 2010;42(3):203-209. doi: 10.1038/ng.534 [DOI] [PMC free article] [PubMed] [Google Scholar]
- 16.Pizzo L, Lasser M, Yusuff T, et al. Functional assessment of the “two-hit” model for neurodevelopmental defects in Drosophila and X. laevis. PLoS Genet. 2021;17(4):e1009112. doi: 10.1371/journal.pgen.1009112 [DOI] [PMC free article] [PubMed] [Google Scholar]
- 17.Martin CL, Wain KE, Oetjens MT, et al. Identification of neuropsychiatric copy number variants in a health care system population. JAMA Psychiatry. 2020;77(12):1276-1285. doi: 10.1001/jamapsychiatry.2020.2159 [DOI] [PMC free article] [PubMed] [Google Scholar]
- 18.Crawford K, Bracher-Smith M, Owen D, et al. Medical consequences of pathogenic CNVs in adults: analysis of the UK Biobank. J Med Genet. 2019;56(3):131-138. doi: 10.1136/jmedgenet-2018-105477 [DOI] [PubMed] [Google Scholar]
- 19.Schmidt M, Schmidt SA, Sandegaard JL, Ehrenstein V, Pedersen L, Sørensen HT. The Danish National Patient Registry: a review of content, data quality, and research potential. Clin Epidemiol. 2015;7:449-490. doi: 10.2147/CLEP.S91125 [DOI] [PMC free article] [PubMed] [Google Scholar]
- 20.Männik K, Mägi R, Macé A, et al. Copy number variations and cognitive phenotypes in unselected populations. JAMA. 2015;313(20):2044-2054. doi: 10.1001/jama.2015.4845 [DOI] [PMC free article] [PubMed] [Google Scholar]
- 21.Qiao Y, Badduke C, Mercier E, Lewis SM, Pavlidis P, Rajcan-Separovic E. miRNA and miRNA target genes in copy number variations occurring in individuals with intellectual disability. BMC Genomics. 2013;14:544. doi: 10.1186/1471-2164-14-544 [DOI] [PMC free article] [PubMed] [Google Scholar]
- 22.Warnica W, Merico D, Costain G, et al. Copy number variable microRNAs in schizophrenia and their neurodevelopmental gene targets. Biol Psychiatry. 2015;77(2):158-166. doi: 10.1016/j.biopsych.2014.05.011 [DOI] [PMC free article] [PubMed] [Google Scholar]
- 23.Sønderby IE, Gústafsson Ó, Doan NT, et al. ; 16p11.2 European Consortium, for the ENIGMA-CNV working group . Dose response of the 16p11.2 distal copy number variant on intracranial volume and basal ganglia. Mol Psychiatry. 2020;25(3):584-602. doi: 10.1038/s41380-018-0118-1 [DOI] [PMC free article] [PubMed] [Google Scholar]
- 24.Firth HV, Wright CF; DDD Study . The Deciphering Developmental Disorders (DDD) study. Dev Med Child Neurol. 2011;53(8):702-703. doi: 10.1111/j.1469-8749.2011.04032.x [DOI] [PubMed] [Google Scholar]
- 25.van der Meer D, Sønderby IE, Kaufmann T, et al. ; Writing Committee for the ENIGMA-CNV Working Group . Association of copy number variation of the 15q11.2 BP1-BP2 region with cortical and subcortical morphology and cognition. JAMA Psychiatry. 2020;77(4):420-430. [DOI] [PMC free article] [PubMed] [Google Scholar]
- 26.Li L, Cheng WY, Glicksberg BS, et al. Identification of type 2 diabetes subgroups through topological analysis of patient similarity. Sci Transl Med. 2015;7(311):311ra174. doi: 10.1126/scitranslmed.aaa9364 [DOI] [PMC free article] [PubMed] [Google Scholar]
- 27.Abul-Husn NS, Soper ER, Odgis JA, et al. ; CBIPM Genomics Team; Regeneron Genetics Center . Exome sequencing reveals a high prevalence of BRCA1 and BRCA2 founder variants in a diverse population-based biobank. Genome Med. 2019;12(1):2. doi: 10.1186/s13073-019-0691-1 [DOI] [PMC free article] [PubMed] [Google Scholar]
- 28.Kearney HM, Thorland EC, Brown KK, Quintero-Rivera F, South ST; Working Group of the American College of Medical Genetics Laboratory Quality Assurance Committee . American College of Medical Genetics standards and guidelines for interpretation and reporting of postnatal constitutional copy number variants. Genet Med. 2011;13(7):680-685. doi: 10.1097/GIM.0b013e3182217a3a [DOI] [PubMed] [Google Scholar]
- 29.Riggs ER, Andersen EF, Cherry AM, et al. Technical standards for the interpretation and reporting of constitutional copy-number variants: a joint consensus recommendation of the American College of Medical Genetics and Genomics (ACMG) and the Clinical Genome Resource (ClinGen). Genet Med. 2020;22(2):245-257. doi: 10.1038/s41436-019-0686-8 [DOI] [PMC free article] [PubMed] [Google Scholar]
- 30.Packer JS, Maxwell EK, O’Dushlaine C, et al. CLAMMS: a scalable algorithm for calling common and rare copy number variants from exome sequencing data. Bioinformatics. 2016;32(1):133-135. [DOI] [PMC free article] [PubMed] [Google Scholar]
- 31.Wang K, Li M, Hadley D, et al. PennCNV: an integrated hidden Markov model designed for high-resolution copy number variation detection in whole-genome SNP genotyping data. Genome Res. 2007;17(11):1665-1674. doi: 10.1101/gr.6861907 [DOI] [PMC free article] [PubMed] [Google Scholar]
- 32.Mbatchou J, Barnard L, Backman J, et al. Computationally efficient whole genome regression for quantitative and binary traits. bioRxiv. Preprint posted online June 22, 2020. doi: 10.1101/2020.06.19.162354 [DOI] [PubMed]
- 33.Wei WQ, Bastarache LA, Carroll RJ, et al. Evaluating phecodes, clinical classification software, and ICD-9-CM codes for phenome-wide association studies in the electronic health record. PLoS One. 2017;12(7):e0175508. doi: 10.1371/journal.pone.0175508 [DOI] [PMC free article] [PubMed] [Google Scholar]
- 34.Wu P, Gifford A, Meng X, et al. Mapping ICD-10 and ICD-10-CM codes to phecodes: workflow development and initial evaluation. JMIR Med Inform. 2019;7(4):e14325. doi: 10.2196/14325 [DOI] [PMC free article] [PubMed] [Google Scholar]
- 35.Willer CJ, Li Y, Abecasis GR. METAL: fast and efficient meta-analysis of genomewide association scans. Bioinformatics. 2010;26(17):2190-2191. doi: 10.1093/bioinformatics/btq340 [DOI] [PMC free article] [PubMed] [Google Scholar]
- 36.Denny JC, Ritchie MD, Basford MA, et al. PheWAS: demonstrating the feasibility of a phenome-wide scan to discover gene-disease associations. Bioinformatics. 2010;26(9):1205-1210. doi: 10.1093/bioinformatics/btq126 [DOI] [PMC free article] [PubMed] [Google Scholar]
- 37.Denny JC, Bastarache L, Ritchie MD, et al. Systematic comparison of phenome-wide association study of electronic medical record data and genome-wide association study data. Nat Biotechnol. 2013;31(12):1102-1110. doi: 10.1038/nbt.2749 [DOI] [PMC free article] [PubMed] [Google Scholar]
- 38.Veasey SC, Rosen IM. Obstructive sleep apnea in adults. N Engl J Med. 2019;380(15):1442-1449. doi: 10.1056/NEJMcp1816152 [DOI] [PubMed] [Google Scholar]
- 39.Wineinger NE, Tiwari HK. The impact of errors in copy number variation detection algorithms on association results. PLoS One. 2012;7(4):e32396. doi: 10.1371/journal.pone.0032396 [DOI] [PMC free article] [PubMed] [Google Scholar]
- 40.Kendall KM, Rees E, Bracher-Smith M, et al. Association of rare copy number variants with risk of depression. JAMA Psychiatry. 2019;76(8):818-825. doi: 10.1001/jamapsychiatry.2019.0566 [DOI] [PMC free article] [PubMed] [Google Scholar]
- 41.O’Dushlaine C, Ripke S, Ruderfer DM, et al. Rare copy number variation in treatment-resistant major depressive disorder. Biol Psychiatry. 2014;76(7):536-541. doi: 10.1016/j.biopsych.2013.10.028 [DOI] [PMC free article] [PubMed] [Google Scholar]
- 42.Castro VM, Minnier J, Murphy SN, et al. ; International Cohort Collection for Bipolar Disorder Consortium . Validation of electronic health record phenotyping of bipolar disorder cases and controls. Am J Psychiatry. 2015;172(4):363-372. doi: 10.1176/appi.ajp.2014.14030423 [DOI] [PMC free article] [PubMed] [Google Scholar]
- 43.Walters RG, Jacquemont S, Valsesia A, et al. A new highly penetrant form of obesity due to deletions on chromosome 16p11.2. Nature. 2010;463(7281):671-675. doi: 10.1038/nature08727 [DOI] [PMC free article] [PubMed] [Google Scholar]
- 44.Poot M. Syndromes hidden within the 16p11.2 deletion region. Mol Syndromol. 2018;9(4):171-174. doi: 10.1159/000490845 [DOI] [PMC free article] [PubMed] [Google Scholar]
- 45.Wentz E, Björk A, Dahlgren J. Neurodevelopmental disorders are highly over-represented in children with obesity: a cross-sectional study. Obesity (Silver Spring). 2017;25(1):178-184. doi: 10.1002/oby.21693 [DOI] [PubMed] [Google Scholar]
- 46.Stahel P, Nahmias A, Sud SK, et al. Evaluation of the genetic association between adult obesity and neuropsychiatric disease. Diabetes. 2019;68(12):2235-2246. doi: 10.2337/db18-1254 [DOI] [PubMed] [Google Scholar]
- 47.Wang K, Li WD, Glessner JT, Grant SF, Hakonarson H, Price RA. Large copy-number variations are enriched in cases with moderate to extreme obesity. Diabetes. 2010;59(10):2690-2694. doi: 10.2337/db10-0192 [DOI] [PMC free article] [PubMed] [Google Scholar]
- 48.Bahrami S, Steen NE, Shadrin A, et al. Shared genetic loci between body mass index and major psychiatric disorders: a genome-wide association study. JAMA Psychiatry. 2020;77(5):503-512. doi: 10.1001/jamapsychiatry.2019.4188 [DOI] [PMC free article] [PubMed] [Google Scholar]
- 49.Espeso-Gil S, Halene T, Bendl J, et al. A chromosomal connectome for psychiatric and metabolic risk variants in adult dopaminergic neurons. Genome Med. 2020;12(1):19. doi: 10.1186/s13073-020-0715-x [DOI] [PMC free article] [PubMed] [Google Scholar]
- 50.Loos RJ. The genetics of adiposity. Curr Opin Genet Dev. 2018;50:86-95. doi: 10.1016/j.gde.2018.02.009 [DOI] [PMC free article] [PubMed] [Google Scholar]
- 51.Martin AR, Kanai M, Kamatani Y, Okada Y, Neale BM, Daly MJ. Clinical use of current polygenic risk scores may exacerbate health disparities. Nat Genet. 2019;51(4):584-591. doi: 10.1038/s41588-019-0379-x [DOI] [PMC free article] [PubMed] [Google Scholar]
- 52.Beesley LJ, Salvatore M, Fritsche LG, et al. The emerging landscape of health research based on biobanks linked to electronic health records: existing resources, statistical challenges, and potential opportunities. Stat Med. 2020;39(6):773-800. doi: 10.1002/sim.8445 [DOI] [PMC free article] [PubMed] [Google Scholar]
Associated Data
This section collects any data citations, data availability statements, or supplementary materials included in this article.
Supplementary Materials
eMethods.
eReferences.
eFigure. BMI by NDD CNV status.
eTable 1. BioMe recruitment by clinic.
eTable 2. NDD CNV prevalence, across biobanks, in BioMe vs UKBB, and by ancestry.
eTable 3. Related NDD CNV carriers.
eTable 4. Enrichment of NDD CNV carriers, multiancestry.
eTable 5. Enrichment of NDD CNV carriers, ancestry-stratified.
eTable 6. Phenotype counts for PheWAS of NDD CNVs.
eTable 7. NDD CNV counts for PheWAS.
eTable 8. PheWAS of NDD CNVs, multiancestry.
eTable 9. BMI association with NDD CNVs, multiancestry.
eTable 10. Serum laboratory test association with combined NDD CNVs, multiancestry.