Abstract
Background and Objectives
Task fMRI is a clinical tool for language lateralization, but has limitations, and cannot provide information about network-level plasticity. Additional methods are needed to improve the precision of presurgical language mapping. We investigate language resting-state functional connectivity (RS fMRI; FC) in typically developing children (TD) and children with epilepsy. Our objectives were to (1) understand how FC components differ between TD children and those with epilepsy; (2) elucidate how the location of disease (frontal/temporal epilepsy foci) affects FC; and (3) investigate the relationship between age and FC.
Methods
Our sample included 55 TD children (mean age 12 years, range 7–18) and 31 patients with focal epilepsy (mean age 13 years, range 7–18). All participants underwent RS fMRI. Using a bilateral canonical language map as target, vertex-wise intrahemispheric FC map and interhemispheric FC map for each participant were computed and thresholded at top 10% to compute an FC laterality index (FCLI; [(L – R)/(L + R)]) of the frontal and temporal regions for both integration (intrahemispheric FC; FCLIi) and segregation (interhemispheric FC; FCLIs) maps.
Results
We found FC differences in the developing language network based on disease, seizure foci location, and age. Frontal and temporal FCLIi was different between groups (t[84] = 2.82, p < 0.01; t[84] = 4.68, p < 0.01, respectively). Frontal epilepsy foci had the largest differences from TD (Cohen d frontal FCLIi = 0.84, FCLIs = 0.51; temporal FCLIi = 1.29). Development and disease have opposing influences on the laterality of FC based on groups. In the frontal foci group, FCLIi decreased with age (r = −0.42), whereas in the temporal foci group, FCLIi increased with age (r = 0.40). Within the epilepsy group, increases in right frontal integration FCLI relates to increased right frontal task activation in our mostly left language dominant group (r = 0.52, p < 0.01). Language network connectivity is associated with higher verbal intelligence in children with epilepsy (r = 0.45, p < 0.05).
Discussion
These findings lend preliminary evidence that FC reflects network plasticity in the form of adaptation and compensation, or the ability to recruit support and reallocate resources within and outside of the traditional network to compensate for disease. FC expands on task-based fMRI and provides complementary and potentially useful information about the language network that is not captured using task-based fMRI alone.
Presurgical localization of the language network is necessary to avoid postoperative deficits from epilepsy surgery, and fMRI language mapping is commonly used to determine the laterality of eloquent language cortex and is increasingly used for localization.1 However, fMRI language activation does not fully predict postsurgical language decline,1-5 and provides limited information about network plasticity. Additional methods are needed to improve the precision and predictive power of presurgical language mapping. Resting-state functional connectivity (FC) may be an alternative to task fMRI.6-8 Following early work,9 FC quantifies within-hemisphere connections to reflect network synchronicity (“integration”), and across hemisphere connections to reflect network suppression from contralateral homologs (“segregation”). Prior research on language lateralization in healthy adults suggests integration is a proxy for left-hemisphere language dominance, and segregation approximates suppression of the right hemisphere.9 In typically developing (TD) adults, FC correlates with vocabulary performance.9 FC identifies the lateralized language network,9-11 adds to predictive models of postsurgical language decline,6 and shows promise as a presurgical tool.
Our prior work established that FC hemispheric contrast (FC-HC) identifies the lateralized language network similar to language task-based fMRI.11 However, FC-HC mapping for the epilepsy group, which is left language dominant (based on task-fMRI), was bilateral, which we posit reflects language plasticity due to greater atypical language representation in epilepsy.11 We define “typical” language representation as the anatomically distinct left-dominant frontal (Broca area) and temporal (Wernicke area) areas.12 Plasticity is a network's malleability to adapt to change,13 and refers to physiologic brain changes to support learning.14 Plasticity includes network compensation, adaptation, and reorganization. Compensation is the ability to recruit support and reallocate resources located within the traditionally defined anatomical network (e.g., right homologs supporting a left dominant network).12,15 Adaptation is the ability to recruit support and reallocate resources located beyond the traditionally defined anatomical network (e.g., supplementary motor area activation implicating the attention network to support a language network).12,16 While compensation or adaptation may be temporary responses to a demand, reorganization is a more permanent change of the dominant network resources to homologs (i.e., right dominant language) or nontraditionally defined network brain areas (e.g., brain regions outside traditional network). In young children, brain regions have more neural equipotential for functional network plasticity than in adults.17,18 Examining the language network in children with epilepsy provides a natural study of factors that influence the maturation and expression of neural networks.
Our prior work combined integration and segregation into a single hemispheric value contrast (FC-HC) to maximize the lateralization effect. We have yet to investigate the developmental trajectory of language FC in TD children. It is unclear if brain regions (frontal vs temporal) or if distinct FC metrics (integration vs segregation) are differentially sensitive to development. This article expands on our prior work by delving into the components of the FC metrics and their relationship to age. We employ a cross-sectional design to expand on the understanding of FC as it relates to the presence of epilepsy, overlap with seizure foci, and age. For all analyses, we conduct comparisons of language FC within frontal and temporal regions to examine differences across age and brain regions. We expect regional differences due to the developmental trajectory of brain maturation. First, we expect the results from children with epilepsy to be different from those of TD children. We hypothesize that FC metrics will capture disease-related differences in frontal and temporal language regions, evidenced by lower integration and segregation. Similarly, we expect hemispheric FC integration and segregation to be different based on the epilepsy foci. We hypothesize that frontal disease foci would show greater differences because these regions have protracted neural maturation and a greater propensity for plasticity.19 Lastly, we hypothesize that left-hemispheric integration will strengthen over childhood with increased network specialization for language processes. Thus, left language integration and segregation will be greater with age.
Methods
Standard Protocol Approvals, Registrations, and Patient Consents
All parents/guardians gave written informed consent, and where appropriate assent, with procedures approved by institutional review boards (Georgetown University Medical Center; PI Vaidya; IRB 2008–343 and Children's National Hospital Office for the Protection of Human Subjects; PI Berl and Gaillard; IRB Pro00000106).
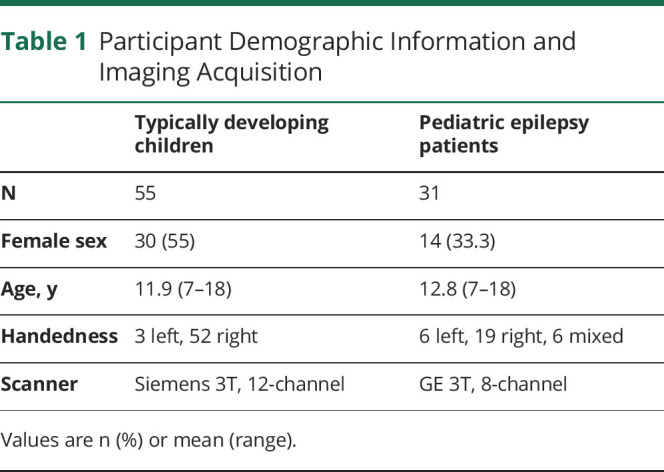
A brief summary of our methods is provided, as we describe detailed recruitment procedures, imaging protocol, sample characteristics, preprocessing, and postprocessing methods in our prior work11 (see Table 1 for participant demographic information). Participants included 55 TD children as control participants (TD; 30 female, mean age 12 years, range 7–18, 52 right-handed) and 31 patients with focal epilepsy (EPI; 14 female, mean age 13, range 7–18, 19 right-handed) undergoing phase 1 surgery evaluation. All participants underwent resting-state (RS) fMRI scan (5 minutes, eyes open, with a fixation cross and the instruction to “not to think of anything in particular”). No patient had a generalized tonic-clonic seizure the day of the fMRI. All patients were given an age-appropriate Wechsler intelligence measure. RS-fMRI were collected using a gradient echo pulse sequence with an 8-channel head coil on a scanner with repetition time 2 seconds, flip angle 90°, in-plane field of view 192 × 192 mm, 3.0 mm isotropic voxels. TD children were scanned at Georgetown University using a 12-channel head coil on a Siemens Trio 3T scanner. All patients underwent fMRI as part of their presurgical evaluation for epilepsy at Children's National Hospital using an 8-channel head coil on a GE 3T scanner. TD children resting-state fMRI data collection details can be found in previous studies.20-23 Prior work established FC patterns are similar in healthy adults and TD children (see prior study, Figure S4),11 therefore we only included TD children in the current study.
Table 1.
Participant Demographic Information and Imaging Acquisition
Patients with focal unaware epilepsy underwent ictal video EEG and a high-resolution MRI epilepsy protocol. All patients included in this study had poor seizure control as they were identified for phase 1 surgery evaluation. All patients underwent task fMRI language mapping. Language laterality is reported based on the Auditory Description Decision Task top 10% activation, which has been previously and extensively described.11 In brief, auditory word definitions are provided in a 5-minute block design contrasted by backwards speech. Images were motion corrected, smoothed, and normalized for single subject first level activation analyses using GLM in SPM12. The key contrast of interest is task > reverse speech for language function.
The imaging data underwent a standard preprocessing pipeline in SPM12 (Statistical Parametric Mapping; Wellcome Trust Centre for Neuroimaging) with motion correction, unwarping, and indirect normalization to Montreal Neurological Institute (MNI) space using a deformation field generated through T1 segmentation. It then underwent denoising steps using the CONN toolbox (version 19.c) with the aCompCor strategy, but with “scrubbing” criteria for high motion volumes FD >0.5 mm as suggested for nonmultiband fMRI data to remove spurious variance.24 We checked FC metrics in CONN (i.e., scrubbing, number of scans). We set denoising filtering to 0.01–0.1 Hz and no despiking. We checked the distribution of FC across all voxels in the brain for quality assurance. The final samples included in the current study had less than 20% high movement volumes. We mapped denoised volumetric time series within the cortical ribbon onto standard 32 K_fs_LR mid-thickness surfaces and combined left and right hemispheres into CIFTI format for FC calculation. We used the workbench toolbox “wb_command – volume-to-surface-mapping” from the Human Connectome Project. This provides a vertex-wise time series of bold signals for FC calculation. A vertex refers to the intersection of 3 triangles on brain surface mesh. Specifically, this mapping process from 3D volume to 2D surface space involves sampling old signal of each voxel between the pial and white matter surface for each vertex. The algorithm then estimates the amount of the polyhedron's volume that falls inside any nearby voxels. The volume that overlaps with each nearby voxel is used to weight the voxel values when they are mapped to the surface space.
CONN processed data were exported to run our in-house FC pipeline.11 In brief, we computed a whole-brain connectivity matrix (vertex to vertex) using a Pearson correlation (r). Then we set a correlation threshold to determine whether vertices were “connected.” Next, we computed the degree of within-hemisphere connectivity for each vertex within the gray matter by calculating the number of ipsilateral connections to a target language mask (described below; intrahemispheric FC; hereafter referred to as within-hemisphere connections, which represents integration). We then established the ipsilateral connection values for every gray matter vertex in the brain. Similarly, we computed the degree of across-hemisphere connectivity by calculating the number of contralateral connections to the same language mask (interhemispheric FC; hereafter referred to as across-hemisphere connections, which represents segregation). Then, the within and across FC values consisted of raw counts of connections, which are dependent on image resolution. Therefore, to make raw counts comparable across different scanners, we standardized these raw counts by dividing them by the total number of vertices in the language mask in 1 hemisphere. This rendered a standardized value that ranged from 0 to 1 for within- and across-hemisphere FC values. From these procedures, we obtained vertex-wise intrahemispheric (integration) and interhemispheric (segregation) FC maps. To assure the final FC measures are not biased by arbitrary threshold selected for defining “connected” or not, the weighted mean across different edge density thresholds (top 10% to top 50%) was used (see prior study for detailed rationale and comparison of different thresholding methods).11
Resulting vertexwise intrahemispheric FC map and interhemispheric FC map for each participant were thresholded at top 10% and used to compute an FC laterality index (FCLI; [(L – R)/(L + R)]) of the frontal and temporal regions separately within the language mask for both integration (FCLIi) and segregation (FCLIs), respectively. For instance, frontal integration FCLIi >0 suggests greater frontal ipsilateral FC in the left hemisphere than the right (left favored). Frontal integration FCLIi <0 indicates greater frontal ipsilateral FC in the right hemisphere than the left (right favored). Similarly, frontal segregation FCLIs >0 suggests greater contralateral FC from the left frontal region than the right (left favored), and FCLIs <0 indicates greater contralateral FC from the right frontal region than the left (right favored). Importantly, segregation is an inverted metric (i.e., greater contralateral FC = lower network segregation). For each participant, we generated a total of 8 raw FC metrics, that is, the raw FC value for each hemisphere for both integration and segregation (raw L FCi; raw R FCi; raw L FCs; raw R FCs) for each brain region (frontal and temporal). Then, we compute 4 laterality indexes, that is, integration and segregation (FCLIi; FCLIs) for each brain regions (frontal and temporal). In our prior work, we combined FCi and FCs to generate FC-HC,11 but here we investigate the components that make up the FC-HC, which is previously described.
To ensure that FC is language-specific, we used a comprehensive language mask obtained from Neurosynth.org for the FC calculation. Specifically, the search term of “language” produced a false discovery rate–corrected (p = 0.01) mask through the meta-analysis of 1,101 “language”-related studies. To ensure our mask was symmetrical and did not bias either hemisphere, we flipped this overall left-lateralized language mask to create a mirrored version and combined them to create a mask, so all areas on both the left and right hemisphere are encompassed in this mask. Note this mask contains >99% of voxels present in the masks of other language-related search terms in Neurosynth. Thus, this comprehensive and representative mask included all the possible language regions in both hemispheres and was large enough to include language areas reported in epilepsy populations with intrahemispheric reorganization.25-27 We then mapped the union language mask to the surface for vertex-wise FC calculation.
Data Availability
Data for the patient groups may be made available (anonymized) if requested through a formal data sharing agreement with the author's institutions. The code developed for the analysis of the data in this study is available through the following resource: osf.io/w8g4n/?view_only=3386e755c8614e369b7bbcaca5b29370. Healthy control resting state data are publicly available at ABIDE: The Autism Consortium (fcon_1000.projects.nitrc.org/indi/abide/abide_II.html).
Statistical Analysis Plan
We completed the following analyses in SPSS version 26. Analyses were grouped by objective. We computed t tests between groups for the first objective (epilepsy vs TD children). For the second objective, we computed t test between epilepsy subgroups (frontal vs temporal foci). For the third objective, we computed correlations between FCLIs, age, and age2 for each group. First, we compared group differences between TD children and children with epilepsy by independent samples t test for the FCLI of frontal and temporal integration and segregation. Given the novelty of the metric, Cohen d values were computed to provide a measure of effect size. We also investigated the 8 raw FC values of hemispheric integration and segregation at each hemisphere to understand what is driving the laterality index and assist with interpretation. Second, we performed similar analysis but comparing epilepsy groups (frontal vs temporal foci). Third, we computed Pearson (r) correlations between age and frontal and temporal FCLI for each group (TD children, epilepsy, frontal foci, temporal foci). Structural neuroimaging literature suggests nonlinear relationships between age and brain development,28 therefore we investigated nonlinear relationships as well. We favored the interpretation of the nonlinear relationship when the Pearson R value was a significant improvement upon the linear metric. Thus, we mean-centered age, and computed quadratic functions of age, and its Pearson r correlations with FCLI. We used Fisher Z statistic to compute whether correlation coefficients were different between groups. Similarly, for significant findings we investigated raw hemispheric values of integration and segregation to understand what is driving the laterality index association with age and assist with interpretation. We used the Benjamini-Hochberg statistical correction for false discovery rate with the recommended 5% false-positive rate to correct for multiple comparisons.29,30 The statistical correction was determined by rank ordering the p values for all analyses and computing the Benjamini-Hochberg critical value. All significant results survived statistical correction for multiple comparisons at p < 0.05. We also conducted post hoc analyses to verify findings without right-sided language dominance patients, and investigate how our FC results correspond with task activation.
Results
Descriptive Information
The mean age at epilepsy onset was 7 years (range 0–17), mean age at the time of study 11.9. Twenty-three patients had a left hemisphere seizure focus and 8 patients had a right-sided focus. Ten had focal cortical dysplasia, 8 had a tumor, 5 had normal MRIs, 2 had other malformations of cortical development, 2 had encephalomalacia. Four had vascular etiology. Epilepsy foci were primarily localized to frontal and temporal regions (14 frontal, 14 temporal, and 3 parietal). Nineteen out of 31 patients were right-handed, based on the Edinburgh Handedness Inventory (see eTable 1, links.lww.com/WNL/B662 for complete patient information). Patients primarily exhibited left-lateralized language in frontal (n = 26) and temporal (n = 25) language areas on task fMRI. Clinical characterization is provided in Table 1, including EEG interictal epileptiform discharges findings and whether or not patients proceeded to surgery (n = 14). The average verbal IQ for the sample was 94 (SD 19; n = 24). We computed correlations of FCLI with age at epilepsy onset, duration of epilepsy, and monotherapy × polytherapy. None of these relationships reached significance.
TD vs Pediatric Epilepsy
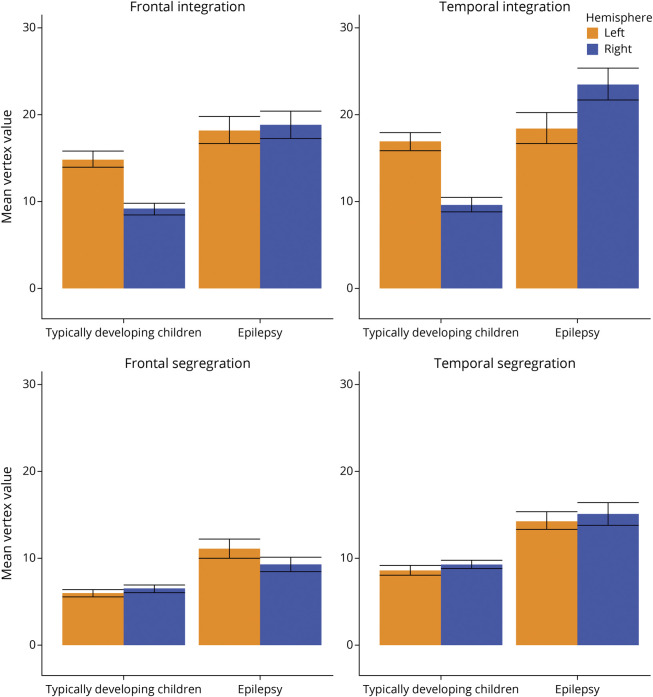
Laterality of frontal and temporal integration is different across groups, and large effect sizes are observed (Table 2). Frontal (FCLIi mean 0.22) and temporal integration (FCLIi mean 0.27) is greater in the left hemisphere than the right hemisphere in TD, as indicated by a positive laterality index value. This is driven by greater left language within-hemisphere FC in TD (see Figure 1 for raw FC value). EPI has frontal integration FCLIi values close to 0 (FCLIi mean −0.02), indicating both hemispheres have equal within-hemisphere FC (Figure 1). In contrast, EPI has negative temporal integration FCLI (FCLIi mean −0.14), indicating temporal integration (within hemisphere FC) was greater in the right hemisphere than the left. Segregation FCLIs values do not differ between groups regardless of brain region (see Table 2). Both TD and EPI segregation FCLIs were close to zero, indicating both hemispheres have equal across-hemisphere FC.
Table 2.
Group Comparisons of Frontal and Temporal Functional Connectivity
Figure 1. Raw Hemispheric Values for Each Group.
Frontal vs Temporal Epilepsy Focus
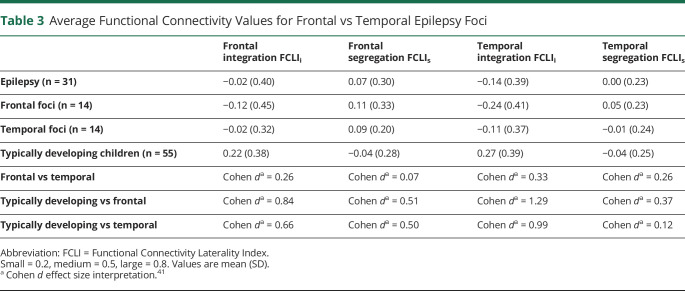
We examined the effect of the location of seizure foci given that 14 patients had frontal foci and 14 patients had temporal foci. We did not include parietal onset seizures due to the small sample size (n = 3). We found no differences and Cohen d effect sizes were small for frontal integration, temporal integration, frontal segregation, and temporal segregation (Table 3).
Table 3.
Average Functional Connectivity Values for Frontal vs Temporal Epilepsy Foci
Developmental Differences
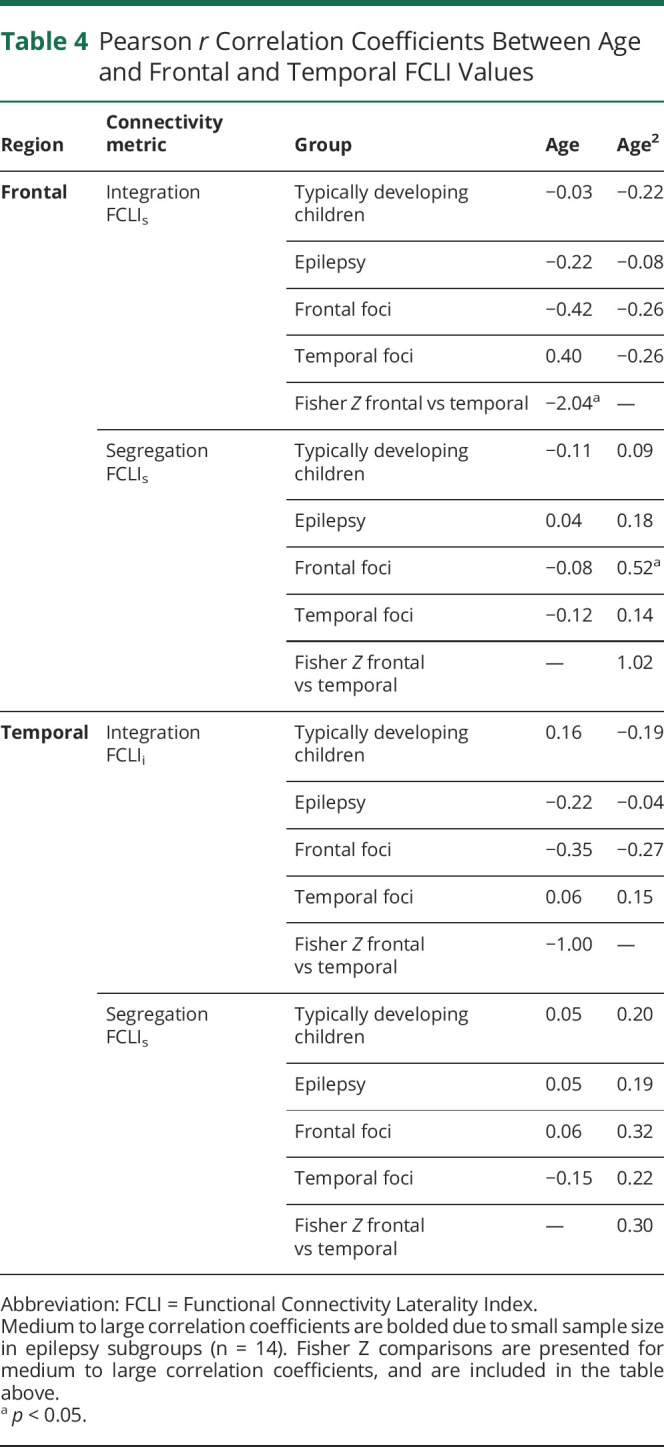
Due to small sample size and multiple comparisons, results are only discussed if Pearson r values were medium to large (see Table 4).30
Table 4.
Pearson r Correlation Coefficients Between Age and Frontal and Temporal FCLI Values
For the TD children, no significant relationship is observed between age and FC metrics across regions.
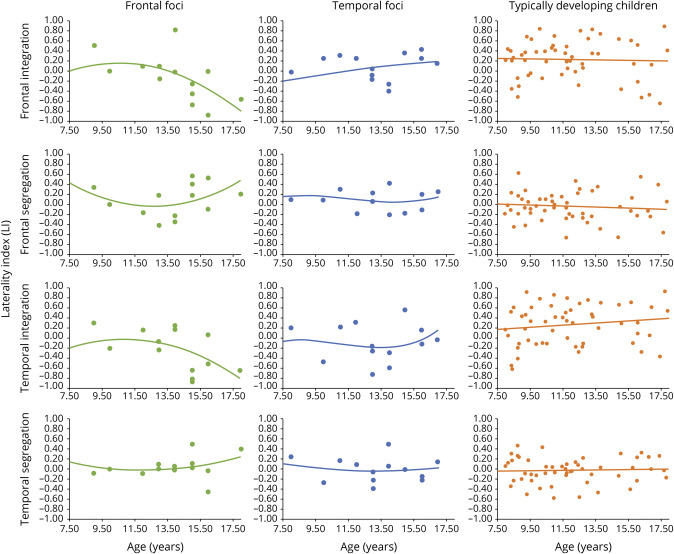
For the epilepsy group, no significant relationship is observed between age and FC metrics across regions. However, there were relationships when groups were separated by location of seizure focus (frontal vs temporal; see Figure 2 and supplementary eFigure 2, links.lww.com/WNL/B662).
Figure 2. Typically Developing Children and Children With Epilepsy.
Relationships between age and language network integration and segregation.
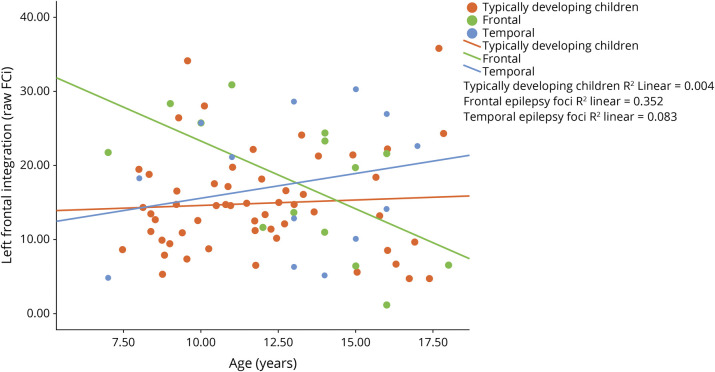
For the frontal epilepsy foci group, as age increases, the frontal integration FCLIi becomes increasingly negative, indicating an increasingly right-favored laterality index with age. Further analysis of the subcomponents of FCLIi (i.e., raw L FCi; raw R FCi) reveals that this is driven by decreased left frontal integration (raw L FCi) as children aged (see Figure 3). There is a relationship between age and raw left frontal integration (raw L FCi r = −0.60, p < 0.05). Frontal segregation FCLIs has a quadratic association with age (age r2 = 0.52, p < 0.05). In young children, left hemisphere frontal across-hemisphere connectivity (raw L FCs) decreases until around age 12.5, and then increases with older age. Right frontal across-hemisphere connectivity (raw R FCs) shows the opposite pattern, and increases until age 12.5, and then decreases (see eFigure 1, links.lww.com/WNL/B662). Temporal integration FCLIi follows a similar pattern of more right-favored FCLIi with age (age r = −0.35). Left temporal integration decreases with age (raw L FCi), whereas right temporal integration increases with age (raw R FCi; see supplementary eFigure 1). Temporal segregation FCLIs has a quadratic relationship with age (age r2 = 0.32), such that the left and right hemispheres (raw L and R FCs) have increasing across-hemisphere connectivity in the temporal regions until about age 12.5, and then contralateral connectivity peaks and subsequently declines, indicating higher temporal lobe segregation.
Figure 3. Typically Developing Children and Frontal vs Temporal Epilepsy Foci.
Raw mean vertex value for left frontal integration.
For the temporal epilepsy foci group, as age increases, there is greater left frontal integration FCLIi. Investigation of raw data reveals left frontal integration (raw L FCi) increased, while right frontal integration (raw R FCi) decreases over age. Additional FCLI metrics (frontal FCLIs temporal FCLIi and FCLIs) are not associated with age.
Group Differences
We report Fisher Z tests to indicate if the relationship between FCLIs and age is different between groups. For frontal integration, differences between the frontal and temporal epilepsy foci groups are present (see Table 3).
Post Hoc Analyses
Removal of Right Dominant Participants
To determine whether language dominance affected our findings, we removed 8 patients with epilepsy who had right-sided language lateralization in frontal or temporal regions on task-based fMRI. When we removed them, the primary analyses and findings described above remained significant. Thus, the significant findings of FC are not merely a reflection of language dominance.
Association With Activation in Patients
To test whether FC metrics are associated with a greater propensity for right hemisphere activation, we computed a correlation between the raw right hemisphere FC integration and segregation values (raw FCi and FCs) and the raw vertex count for right hemisphere activation based on language task fMRI in 3 regions: inferior frontal gyrus (IFG), Wernicke area, and the middle frontal gyrus (MFG). Within the whole epilepsy group, the right frontal raw FCi is positively correlated with right MFG activation (r = 0.52, p < 0.01). The same relationship was not found for activations in IFG or Wernicke areas (r = 0.21 p > 0.05 and r = 0.33, p > 0.05, respectively). The positive correlation between right frontal raw FCi and right MFG activation was mainly driven by the frontal foci group (p = 0.53, p = 0.05). Moreover, in the frontal epilepsy foci group, right IFG activation also negatively correlated with left temporal raw FCi (p = −0.63, p = 0.02).
Association With Verbal IQ
To test whether FC metrics are associated with language, we computed correlations between the FCLI and raw FC values and verbal intelligence (VIQ) for the patients who had available IQ data (n = 24). In the epilepsy group, frontal segregation FCLIs was significantly positively correlated with higher VIQ score (r = 0.45, p < 0.05). Upon investigating raw values, left frontal integration was significantly associated with higher VIQ (r = 0.45, p < 0.05), and left frontal across-hemisphere connectivity was also highly correlated with higher VIQ (r = 0.65, p < 0.01). Greater left temporal across-hemisphere connectivity was associated with lower VIQ (r = −0.46, p < 0.05) in the whole epilepsy sample; however, this relationship is driven by children with a temporal epilepsy focus (r = −0.72, p < 0.05; n = 11).
Discussion
FC metrics provide additional insights into typical language network maturation and the influence of disease, which may reflect network plasticity and an effect of epilepsy. Our 3 main findings are as follows. (1) There are group differences in language FC between TD children and those with epilepsy during development. Supporting the plasticity principle of compensation, children with epilepsy who have a left-dominant language network distribute their network resources differently than TD children. (2) Development (i.e., correlation with age) and frontal FC differs by location of seizure foci. Supporting the plasticity principle of neural commitment, frontal areas of the developing brain have greater equipotential in younger children. (3) Increases in right frontal FC integration are related to increased right hemisphere task activation in our left language dominant group. Furthermore, increased left temporal FC is related to decreased right IFG activation. These findings provide preliminary evidence that FC may reflect the mechanism of change following functional disruption due to disease. (4) There was a relationship between language network connectivity and verbal intelligence in children with epilepsy. These findings lend support for the plasticity principle of adaptation or the network's ability to recruit support outside the traditionally defined network to support language function. We found a greater language burden on the right MFG, traditionally defined as executive control network, in our epilepsy group. FC expands on task-based fMRI and provides complementary and potentially useful information about the language network not captured using task-based fMRI alone.
FC is related to, but distinct from, task fMRI activation. Task activation identifies language regions within a network burdened during the task (i.e., activation patterns differ if listening to a story vs generating words). In contrast, FC approximates the constant underlying coordinated activity of neurons that support activation yet expands beyond activation, and measures the larger “language-ready” network. The language-ready brain refers to the neurobiological topography that allows brain regions to support language function.31 FC may reflect the network's capacity to compensate by recruiting other neural resources. Unlike TD children, children with epilepsy exhibit FC that did not favor either hemisphere in the frontal regions. An increased propensity for both hemispheres to remain language ready (i.e., bilateral FCLI) may reflect an adaptation to epilepsy.
In TD children, language lateralization increases over childhood based on observations from language task fMRI. Bilateral activation in children under age 6 occurs commonly and is proposed as one mechanism for recovery following early injury to the left hemisphere.19,32 With epilepsy, the brain may retain this bilateral developmental pattern at least for FC. Children may need to recruit greater network resources to subserve language function, similar to how adults, when given increased language demands, show greater bilateral activation.33-35 If FC is a proxy for language readiness, then FC may be able to supplement language mapping information by providing an index of the network's ability to compensate as needed due to demands or in the context of neural disruption/injury. These results require replication and further investigation with larger samples to validate that network differences reflect compensatory processes and further investigate how results may be affected by epilepsy treatment.
The differences in maturational timing of brain structure may underlie the different results found in the frontal vs temporal lobe. In typical development, frontal regions have protracted maturation, myelination, and cortical pruning.28,36 The majority of FC differences in our study of older children were found in the frontal lobe, supporting the notion that maturation of FC mirrors structural development with temporal regions reaching maturity before frontal regions. Even though we did not find a correlation with age, we did find differences primarily in the frontal lobe. In prior research, resting-state FC and task fMRI demonstrate left hemisphere language dominance.11,37 In our presumed left language dominant group, most TD children exhibited left favored frontal and temporal integration; however, we did not find a relationship between age and FC metrics. The lack of findings in TD children may indicate a mature language network, particularly as the average age of our TD sample is 12 years, and prior research suggests that frontal and temporal regions resemble adult left dominance by age 10.19,38
Our results suggest FC provides insight into plasticity. However, additional studies are needed to test more sophisticated models of interactions with age and development, and the ability to control for more epilepsy treatment and development-related factors, as well as determine how these factors influence FC metrics. Due to small sample size, we did not have sufficient power to detect relationships using more sophisticated models, such as spline regressions or generalized additive models. Our correlational results provide exploratory hints that FC may be helpful to identify differences that require further investigation with larger samples and more sophisticated statistical modeling. Due to the complexity of network development aside from disease, further research across a larger age range is needed to detect reliable nonlinear associations. Additional research is also needed on TD children and those with epilepsy who have non-left language dominance. Epilepsy is heterogeneous; our sample is inherently limited by different causes of epilepsy and medications. Future studies will also need to examine outcomes and whether FC can predict postsurgical language performance.
Our measure and approach towards integration and segregation has been validated empirically and theoretically supported in other studies.9 However, our measures of integration and segregation are inferred based on a correlation matrix. There are other ways to operationalize integration and segregation using graph theory metrics of clustering coefficient and characteristic path length. Our temporal resolution was not sufficient to warrant interpretation of the data at individual frequencies, such as temporal lag. Future research should investigate additional aspects of signal relationships such as imaginary part of coherency, phase-based metrics, and frequency-resolved directed interactions.39 Future research could further validate and support the correlational results presented here using alternative approaches of signal synchrony and casualty.40
We observed that FCLI identifies variance in the language network based on disease group, brain region, epilepsy foci, and age in TD children and children with epilepsy. We posit that these differences align with notions of functional neuroplasticity at the intersection of brain networks, development, and disease. If FC metrics reflect mechanism, then these tools may be able to predict surgery outcomes and language recovery. FC may provide insights into periods of language plasticity or vulnerability to help predict reorganization capacity for pediatric epilepsy. Ultimately, FC may expand presurgical evaluation to language network mapping rather than language task dominance.
Glossary
- EPI
patients with focal epilepsy
- FC
functional connectivity
- FCi
functional connectivity integration
- FCLI
functional connectivity laterality index
- FCs
functional connectivity segregation
- HC
hemispheric contrast
- IFG
inferior frontal gyrus
- MFG
middle frontal gyrus
- MNI
Montreal Neurological Institute
- RS
resting-state
- TD
typically developing
- VIQ
verbal intelligence
Appendix. Authors
Study Funding
District of Columbia Intellectual and Developmental Disabilities Research Center (U54 HD090257) and UL1TR001876 to X.Y., MH084961 to C.J.V., and NIH grant R01-DC016902 to W.D.G.
Disclosure
The authors report no disclosures relevant to the manuscript. Go to Neurology.org/N for full disclosures.
References
- 1.Szaflarski JP, Gloss D, Binder JR, et al. Practice guideline summary: use of fMRI in the presurgical evaluation of patients with epilepsy: report of the guideline development, dissemination, and implementation subcommittee of the American Academy of Neurology. Neurology. 2017;88(4):395-402. [DOI] [PMC free article] [PubMed] [Google Scholar]
- 2.Bonelli SB, Thompson PJ, Yogarajah M, et al. Imaging language networks before and after anterior temporal lobe resection: results of a longitudinal fMRI study. Epilepsia. 2012;53(4):639-650. [DOI] [PMC free article] [PubMed] [Google Scholar]
- 3.Busch RM, Floden DP, Prayson B, et al. Estimating risk of word-finding problems in adults undergoing epilepsy surgery. Neurology. 2016;87(22):2363-2369. [DOI] [PMC free article] [PubMed] [Google Scholar]
- 4.Rosazza C, Ghielmetti F, Minati L, et al. Preoperative language lateralization in temporal lobe epilepsy (TLE) predicts peri-ictal, pre- and post-operative language performance: an fMRI study. Neuroimage Clin. 2013;3:73-83. [DOI] [PMC free article] [PubMed] [Google Scholar]
- 5.Sabsevitz DS, Swanson SJ, Hammeke TA, et al. Use of preoperative functional neuroimaging to predict language deficits from epilepsy surgery. Neurology. 2003;60(11):1788-1792. [DOI] [PubMed] [Google Scholar]
- 6.Audrain S, Barnett AJ, McAndrews MP. Language network measures at rest indicate individual differences in naming decline after anterior temporal lobe resection. Hum Brain Mapp. 2018;39(11):4404-4419. [DOI] [PMC free article] [PubMed] [Google Scholar]
- 7.Fox MD, Greicius M. Clinical applications of resting state functional connectivity. Front Syst Neurosci. 2010;4:19. [DOI] [PMC free article] [PubMed] [Google Scholar]
- 8.Kamran M, Hacker CD, Allen MG, et al. Resting-state blood oxygen level-dependent functional magnetic resonance imaging for presurgical planning. Neuroimaging Clin N Am. 2014;24(4):655-669. [DOI] [PMC free article] [PubMed] [Google Scholar]
- 9.Gotts SJ, Jo HJ, Wallace GL, Saad ZS, Cox RW, Martin A. Two distinct forms of functional lateralization in the human brain. Proc Natl Acad Sci USA. 2013;110(36):E3435-E3444. [DOI] [PMC free article] [PubMed] [Google Scholar]
- 10.Doucet GE, Pustina D, Skidmore C, Sharan A, Sperling MR, Tracy JI. Resting-state functional connectivity predicts the strength of hemispheric lateralization for language processing in temporal lobe epilepsy and normals. Hum Brain Mapp. 2015;36(1):288-303. [DOI] [PMC free article] [PubMed] [Google Scholar]
- 11.Mbwana JS, You X, Ailion A, et al. Functional connectivity hemispheric contrast (FC-HC): a new metric for language mapping. Neuroimage Clin. 2021;1:102598. [DOI] [PMC free article] [PubMed] [Google Scholar]
- 12.Mesulam MM. From sensation to cognition. Brain. 1998;121(pt 6):1013-1052. [DOI] [PubMed] [Google Scholar]
- 13.Kolb B, Whishaw IQ. Brain plasticity and behavior. Annu Rev Psychol. 1998;49:43-64. [DOI] [PubMed] [Google Scholar]
- 14.Crosson B, Rodriguez AD, Copland D, et al. Neuroplasticity and aphasia treatments: new approaches for an old problem. J Neurol Neurosurg Psychiatry. 2019;90(10):1147-1155. [DOI] [PMC free article] [PubMed] [Google Scholar]
- 15.Rolls ET, Baylis GC, Hasselmo ME, Nalwa V. The effect of learning on the face selective responses of neurons in the cortex in the superior temporal sulcus of the monkey. Exp Brain Res. 1989;76(1):153-164. [DOI] [PubMed] [Google Scholar]
- 16.Vandenberghe R, Price C, Wise R, Josephs O, Frackowiak RS. Functional anatomy of a common semantic system for words and pictures. Nature. 1996;383(6597):254-256. [DOI] [PubMed] [Google Scholar]
- 17.Oddy M. Head injury during childhood. Neuropsychol Rehabil. 1993;3:301-320. [Google Scholar]
- 18.Levin HS, Benton AL, Grossman RG. Neurobehavioral Consequences of Closed Head Injury. Oxford University Press; 1982. [Google Scholar]
- 19.Berl MM, Mayo J, Parks EN, et al. Regional differences in the developmental trajectory of lateralization of the language network. Hum Brain Mapp. 2014;35(1):270-284. [DOI] [PMC free article] [PubMed] [Google Scholar]
- 20.Gordon EM, Stollstorff M, Vaidya CJ. Using spatial multiple regression to identify intrinsic connectivity networks involved in working memory performance. Hum Brain Mapp. 2012;33(7):1536-1552. [DOI] [PMC free article] [PubMed] [Google Scholar]
- 21.Lynch CJ, Breeden AL, You X, et al. Executive dysfunction in autism spectrum disorder is associated with a failure to modulate frontoparietal-insular hub architecture. Biol Psychiatry Cogn Neurosci Neuroimaging. 2017;2(6):537-545. [DOI] [PMC free article] [PubMed] [Google Scholar]
- 22.Loewenstern J, You X, Merchant J, et al. Interactive effect of 5-HTTLPR and BDNF polymorphisms on amygdala intrinsic functional connectivity and anxiety. Psychiatry Res Neuroimaging. 2019;285:1-8. [DOI] [PMC free article] [PubMed] [Google Scholar]
- 23.Yerys BE, Gordon EM, Abrams DN, et al. Default mode network segregation and social deficits in autism spectrum disorder: evidence from non-medicated children. Neuroimage Clin. 2015;9:223-232. [DOI] [PMC free article] [PubMed] [Google Scholar]
- 24.Power JD, Schlaggar BL, Petersen SE. Recent progress and outstanding issues in motion correction in resting state fMRI. NeuroImage. 2015;105:536-551. [DOI] [PMC free article] [PubMed] [Google Scholar]
- 25.Mbwana J, Berl MM, Ritzl EK, et al. Limitations to plasticity of language network reorganization in localization related epilepsy. Brain. 2009;132(pt 2):347-356. [DOI] [PMC free article] [PubMed] [Google Scholar]
- 26.Rosenberger LR, Zeck J, Berl MM, et al. Interhemispheric and intrahemispheric language reorganization in complex partial epilepsy. Neurology. 2009;72(21):1830-1836. [DOI] [PMC free article] [PubMed] [Google Scholar]
- 27.You X, Zachery AN, Fanto EJ, et al. fMRI prediction of naming change after adult temporal lobe epilepsy surgery: activation matters. Epilepsia. 2019;60(3):527-538. [DOI] [PMC free article] [PubMed] [Google Scholar]
- 28.Tanaka C, Matsui M, Uematsu A, Noguchi K, Miyawaki T. Developmental trajectories of the fronto-temporal lobes from infancy to early adulthood in healthy individuals. Dev Neurosci. 2012;34(6):477-487. [DOI] [PubMed] [Google Scholar]
- 29.Benjamini Y, Hochberg Y. Controlling the false discovery rate: a practical and powerful approach to multiple testing. J R Stat Soc. 1995;57(1):289-300. [Google Scholar]
- 30.Bennett CM, Wolford GL, Miller MB. The principled control of false positives in neuroimaging. Soc Cogn Affect Neurosci. 2009;4(4):417-422. [DOI] [PMC free article] [PubMed] [Google Scholar]
- 31.Hagoort P, Poeppel D. The infrastructure of the language-ready brain. Lang Music Brain. 2015;101;233-256. [Google Scholar]
- 32.Olulade OA, Seydell-Greenwald A, Chambers CE, et al. The neural basis of language development: changes in lateralization over age. Proc Natl Acad Sci U S A. 2020;117(38):23477-23483. [DOI] [PMC free article] [PubMed] [Google Scholar]
- 33.Bench CJ, Frith CD, Grasby PM, et al. Investigations of the functional anatomy of attention using the Stroop test. Neuropsychologia. 1993;31(9):907-922. [DOI] [PubMed] [Google Scholar]
- 34.de Zubicaray GI, Wilson SJ, McMahon KL, Muthiah S. The semantic interference effect in the picture-word paradigm: an event-related fMRI study employing overt responses. Hum Brain Mapp. 2001;14(4):218-227. [DOI] [PMC free article] [PubMed] [Google Scholar]
- 35.Zhang H, Eppes A, Diaz MT. Task difficulty modulates age-related differences in the behavioral and neural bases of language production. Neuropsychologia. 2019;124:254-273. [DOI] [PMC free article] [PubMed] [Google Scholar]
- 36.Paus T, Collins DL, Evans AC, Leonard G, Pike B, Zijdenbos A. Maturation of white matter in the human brain: a review of magnetic resonance studies. Brain Res Bull. 2001;54(3):255-266. [DOI] [PubMed] [Google Scholar]
- 37.Smitha KA, Akhil Raja K, Arun KM, et al. Resting state fMRI: a review on methods in resting state connectivity analysis and resting state networks. Neuroradiol J. 2017;30(4):305-317. [DOI] [PMC free article] [PubMed] [Google Scholar]
- 38.Kadis DS, Pang EW, Mills T, Taylor MJ, McAndrews MP, Smith ML. Characterizing the normal developmental trajectory of expressive language lateralization using magnetoencephalography. J Int Neuropsychol Soc. 2011;17(5):896-904. [DOI] [PubMed] [Google Scholar]
- 39.Bastos AM, Schoffelen J-M. A tutorial review of functional connectivity analysis methods and their interpretational pitfalls. Front Syst Neurosci. 2016;9:175. [DOI] [PMC free article] [PubMed] [Google Scholar]
- 40.Rubinov M, Sporns O. Complex network measures of brain connectivity: uses and interpretations. NeuroImage. 2010;52(3):1059-1069. [DOI] [PubMed] [Google Scholar]
- 41.Sawilowsky SS. New effect size rules of thumb. J Mod Appl Stat Methods. 2009;8(2):597-599. [Google Scholar]
Associated Data
This section collects any data citations, data availability statements, or supplementary materials included in this article.
Data Availability Statement
Data for the patient groups may be made available (anonymized) if requested through a formal data sharing agreement with the author's institutions. The code developed for the analysis of the data in this study is available through the following resource: osf.io/w8g4n/?view_only=3386e755c8614e369b7bbcaca5b29370. Healthy control resting state data are publicly available at ABIDE: The Autism Consortium (fcon_1000.projects.nitrc.org/indi/abide/abide_II.html).


