

Abstract
Objective:
To analyze the effect of orthodontic treatment with premolar extraction on the stress distribution of the occlusal force in the human skull.
Materials and Methods:
A three-dimensional finite element (3D FE) model was constructed based on computed tomography scan data, and it served as the pretreatment model. For the extraction model simulating postorthodontic occlusion, the first premolar was removed in the pretreatment model, and the anterior and posterior segments were repositioned. Stress distribution was evaluated by 3D FE analysis in both models under the simulation of 1000 N for occlusal forces and 400 N for masseter muscle force.
Results:
The occlusal stresses were concentrated at the alveolar bone near the teeth, the infrazygomatic crest, the frontal process, the temporal process of the zygomatic bone, the infraorbital rim, the pyriform aperture region, and the pterygoid plate in both models. The von Mises stress at the pterygoid plate area was lower in the extraction model (3.53 MPa) than in the pretreatment model (5.57 MPa), while the stress at the frontal process of the maxilla was higher in the extraction model (2.32 MPa) than in the pretreatment model (2.16 MPa).
Conclusions:
The results indicated that the occlusal forces were transferred through the maxillonasal, maxillozygomatic, and maxillopterygoid stress trajectories and that stress distribution moved more “forward” with the orthodontic treatment with premolar extraction.
Keywords: Finite element analysis, Maxilla, Occlusal force, Stress, Tooth movement
INTRODUCTION
The occlusal forces during mastication are transferred through the teeth, periodontal ligaments (PDLs), and the alveolar bone to the supporting structures of the skull.1–5 In 1948 Seipel5 found the canine, zygomatic, and pterygoid pillars in the human face by injecting the black india ink into the dry skull. According to the photoelastic analysis1,2 and finite element (FE) analysis,3,4 there were also three main stress trajectories in the face: the maxillonasal, maxillozygomatic, and maxillopterygoid stress trajectories. Therefore, the occlusal forces loaded onto the maxillary teeth could be distributed to all the facial elements with no significant stress concentration on the alveolar bone.
It is generally accepted that the maximum occlusal force is higher in the molars than in the incisors.6–8 According to the report by Sultana et al.,8 the occlusal force was 431 N in the molar region and 32.5 N in the anterior region. Furthermore, the center of the tooth contacts is known to be anteroposteriorly located in the region of the first molar.7 The position of the maxillary first molar was considered the key to the occlusion by Angle9 and Helman10 in the early 20th century. Atkinson11,12 also suggested an inherent relationship between the so-called ‘key ridge,’ the infrazygomatic crest, and the position of the maxillary first molar.
The position of the maxillary first molar, however, is often changed anteriorly or posteriorly by orthodontic treatment. In orthodontic treatment, premolars are commonly extracted for relief of crowding, correction of an unacceptable intermolar relationship, or improvement of the facial esthetics. It is well accepted that during orthodontic treatment involving the extraction of the premolars, dimensional changes occur in the dental arch.13,14 When the first premolars are extracted, one can usually expect the posterior teeth to move forward approximately one-third of the space, leaving two-thirds of the space for relief of crowding and incisor retraction.14 We hypothesized that these dimensional changes in the dental arch could affect the pattern of the stress distribution of the occlusal force in the skull.
In the FE study by Cattaneo et al.3 the forward and backward displacements of the maxillary molars from the infrazygomatic crest affected the pattern of load transfer through the maxillary complex. To date, however, there have been no studies dealing with the stress distribution after orthodontic treatment with premolar extraction. Therefore, the purpose of this study was to analyze the effect of orthodontic treatment with premolar extraction on the occlusal stress distribution in the skull using the FE method.
MATERIALS AND METHODS
A three-dimensional (3D) FE model of a human skull was produced based on computed tomography (CT) scan data of a healthy 13.5-year-old girl with complete permanent dentition and no craniofacial anomaly. The protocols of this study were approved by the ethics committee of the institute (IRB2011-10-2). The CT scan was performed on a CT scanner (SCT-6800TXL, Shimadzu Corp, Kyoto, Japan) with a 3-mm scan increment and a 1-mm slice thickness. The CT images were read into the visualization software (Mimics, Materilise, Leuven, Belgium), where the images were segmented by thresholding to obtain the left skull and the maxillary teeth. COSMOS/M programs (Structural Research & Analysis Co, Los Angeles, Calif) were then used for the meshing process of the constructed 3D model and for the analysis of the 3D FE model (Figure 1). The 3D FE models were assumed to be composed of maxillary teeth, PDL (0.25 mm thick),15 cortical bones (1 mm thick), and cancellous bones.16 The PDL layers were modeled around the roots by manual.
Figure 1. .

The process for the 3D FE model: (A) CT scan, (B) 3D reconstruction of the CT scans, and (C) meshing of the 3D FE model.
Figures 1C and 2A show the pretreatment 3D FE model. To produce the extraction model, the first premolar was removed in the pretreatment model. Then the anterior segment was repositioned back by 5.2 mm and the posterior segment forward by 2.8 mm on the sagittal plane (Figure 2). Bucco-lingual minor repositioning and rotation of the anterior and posterior dental segments were done to maintain the continuous curvature of the dental arch. These resulted in two models: the pretreatment model, consisting of 64,765 nodes and 319,803 elements, and the extraction model, consisting of 63,494 nodes and 315,536 elements. The properties of each material, particularly the Young's modulus and Poisson's ratio (Table 1), were used as in the previous studies,17–19 and all of the materials were assumed to be isotropic, homogeneous, and linearly elastic.
Figure 2. .

3D FE model: (A) pretreatment model, (B) extraction model, and (C) occlusal view.
Table 1. .
The Physical Properties of the Materials Used

The von Mises stress and the normal stress were evaluated under the simulation of 1000 N for the occlusal force on the left maxillary teeth and the simulation of 400 N for the masseter muscle force at the inferior part of the zygomatic arch (Table 2). For the boundary conditions, the movement was restricted in the top cutting plane. The stress distributions were compared at four points within the main stress trajectories: the frontal process of the maxilla (FM), the zygomatic process of the frontal bone (ZF), the zygomatic process of the temporal bone (ZT), and the pterygomaxillary suture area (PM) (Figure 3).
Table 2. .
The Loading Conditions Used

Figure 3. .
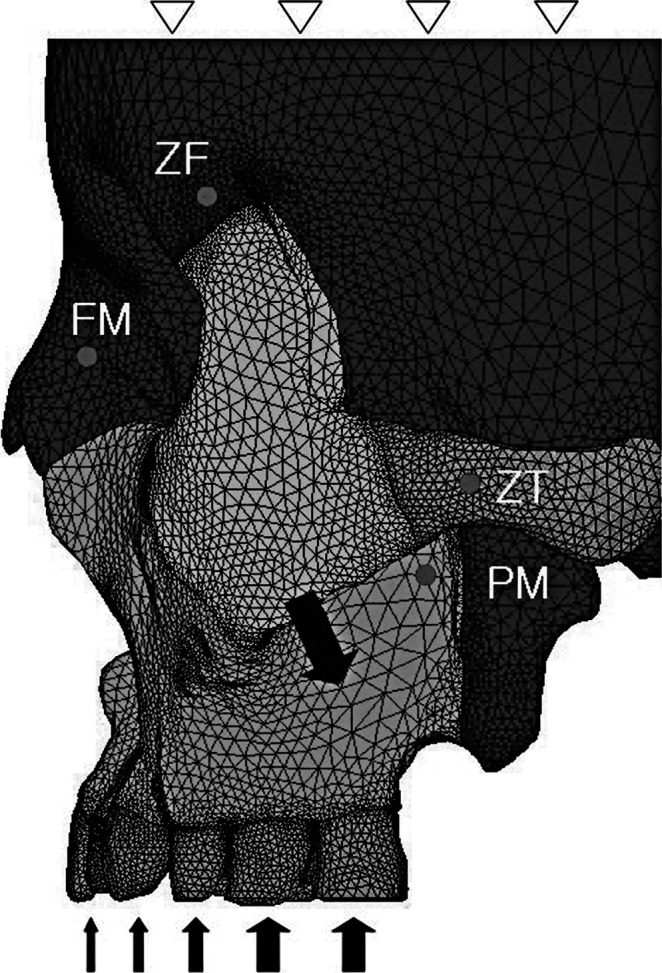
Lateral view of the FE model. The boundary and external loading conditions are shown. The amounts of stress in both models were compared at four points: the frontal process of the maxilla (FM), the zygomatic process of the frontal bone (ZF), the zygomatic process of the temporal bone (ZT), and the pterygomaxillary suture area (PM).
RESULTS
In Figure 4, when the occlusal forces were applied on the maxillary teeth, the stresses were observed at the alveolar bone, maxilla, and zygomatic arch and reached the frontal and temporal bones in both models. Even though the stresses were generally distributed throughout the skull, a high concentration of stresses was present at the zygomatic arch and infrazygomatic crest. The stresses were also concentrated in the pyriform aperture, infraorbital rim, and pterygoid plate areas.
Figure 4. .

von Mises stress distribution in the pretreatment model (A) and the extraction model (B). Red color means a high stress concentration.
In Table 3 and Figure 4, the von Mises stress was the highest at ZT, followed by the PM, FM, and ZF areas, in both models. The stress at PM (3.53 MPa) was lower in the extraction model than in the pretreatment model (5.57 MPa), while the stress at FM (2.32 MPa) was higher in the extraction model than in the pretreatment model (2.16 MPa).
Table 3. .
von Mises Stress (MPa) in the Pretreatment Model and Extraction Model

Table 4 and Figure 5 show the normal stresses in the x-, y-, and z-axes. In the vertical direction (y-axis), compressive stresses were found at the infrazygomatic crest, PM, and FM, and tensile stress was found at ZF. The compressive stress at PM was lower in the extraction model (3.33 MPa) than in the pretreatment model (5.55 MPa), while the stress at FM was higher in the extraction model (2.14 MPa) than in the pretreatment model (1.76 MPa). In the anteroposterior direction (z-axis), compressive stresses were found at the zygomatic arch and at the infrazygomatic area in both models, and tensile stresses were found at the infraorbital rim and at the alveolar bones near the teeth in both models. In the lateral direction (x-axis), the compressive stress was found at the infrazygomatic area, and the tensile stresses were found at the infraorbital rim and at the alveolar bones near the teeth in both models. In the x-, y-, and z-axes, the extraction model showed a slightly different stress pattern compared to the pretreatment model, and the compressive stress decreased at PM. At the ZT area, the stress pattern was changed from compressive to tensile stress, or the reverse.
Table 4. .
Normal Stresses (MPa) in the Pretreatment Model and Extraction Model Along the x-Axis, y-Axis, and z-Axisa

Figure 5. .

Normal stress distribution along the y-axis (A and B), z-axis (C and D), and x-axis (E and F). Blue color (negative value) represents compressive stress, while red color (positive value) represents tensile stress.
DISCUSSION
It is important to understand the stress distribution mechanism of occlusal force, because this strong force should be distributed to the other supporting structures to prevent local bone damage. In the present study, the stress distributed in the anterior regions was observed to run through the maxilla and the nasal bone, toward the frontal bone. In the premolar and molar areas, the stress ran through the infrazygomatic crest and reached the zygoma, then branched superiorly to the frontal bone and posteriorly along the zygomatic arch to the temporal bone. In the area of the second molar, the stress spread to the pterygoid plate. In other words, the occlusal forces were transferred through the maxillonasal, maxillozygomatic, and maxillopterygoid stress trajectories, as previously reported.1,2,4,5
The results showed that the stress gradually decreased with the distribution, but in the key ridge, zygomatic arch, pterygoid plate, infraorbital rim, and pyriform aperture regions, high stress concentrations were observed (Figure 4). It is well known that the cortical bone in this region is thick and dense histologically.11,12,16,20 According to Wolff's Law,21 the functional change of bones is followed by definite changes in their internal architecture and external conformation. Stresses loaded on bones can cause bone strain, like a stretch or shortening.22 Frost21,23 explained that the strengthening of bone occurs on the load-bearing bone if bone strain exceeds the bone's modeling threshold (20 MPa in stress). High concentration of stress at the key ridge, zygomatic arch, and pyriform aperture regions can explain the bony adaptation of the human skull to the functional load.
The von Mises stresses were higher at the zygomaticotemporal suture and pterygoid plate areas than at the nasofrontal and zygomaticofrontal suture areas in both models (Table 3; Figure 4), from which it can be inferred that these areas play an important role in stress bearing and transferring. In the extraction model, however, the von Mises stress decreased by 36.6% (from 5.57 MPa to 3.53 MPa) in the pterygoid plate area (PM) and increased by 7.6% (from 2.16 MPa to 2.32 MPa) in the nasofrontal suture area (FM), compared to the pretreatment model. In other words, the mesial displacement of the upper molars resulting from orthodontic treatment with premolar extraction may weaken the role of the maxillopterygoid stress trajectory (PM) while strengthening the role of the maxillonasal stress trajectory (FM).
In the vertical direction (y-axis), compressive stress was observed at the infrazygomatic crest, PM, and FM areas, and tensile stress was found at the ZF area (Table 4; Figure 5A,B). The key ridge and zygomatic arch areas showed the equilibrium of the force, meaning that the compressive stress by the upward occlusal force and the tensile stress by the downward masseter muscle force are balanced in these areas. Our finding was in agreement with the results of Alexandridis et al.,1 who investigated the occlusal stress distribution in the zygomatic arch area using the photoelastic method. In the extraction model, the compressive stress increased in the anterior part of the maxilla (from 1.76 MPa to 2.14 MPa at FM) and decreased in the posterior part of the maxilla (from 5.55 MPa to 3.33 MPa at PM). In the zygomatic arch (ZT), the compressive stress changed to tensile stress. This means that the equilibrium area of the force moved more anteriorly. This change in the zygomatic area may bend the zygomatic arch further downward. Moreover, anterior rotation of the maxilla may occur because this stress distribution can be supposed in patients using anterior high-pull headgear.
Figure 5C and D show the stress distribution in the anteroposterior direction (z-axis). Tensile stresses were observed at FM, ZF, and ZT (Table 4). Delaire24 suggested that upward occlusal force is required for the continuous anterior growth of the premaxilla after orthopedic treatment with a face mask in Class III patients. The results of this study showed mathematically that occlusal force could stimulate the frontomaxillary, zygomaticofrontal, and zygomaticotemporal sutures. In the extraction model, however, the tensile stress was slightly reduced in such areas.
As shown in Figure 5C and D, tensile stresses were also observed in the alveolar bone near the teeth, and compressive stress was observed in the interdental area between the first and second molars. Rupprecht et al.25 reported that the maxillary first molars were most often affected by alveolar fenestrations and that the presence of fenestrations was positively correlated with a thin alveolar bone and negatively correlated with occlusal attrition. According to Frost,23 when bone strains stay below a lower threshold range, disuse-mode remodeling can reduce bone strength, but repeated bone strains above the bone's modeling threshold strain range can cause microscopic fatigue damage (microdamage) in the bone. If the alveolar bone does not adapt physiologically to the local change in the stress distribution in relation to the mesial displacement of the upper molars, alveolar dehiscences and fenestrations can occur in this area.
In the lateral direction (x-axis), compressive stress was observed at the lower part of the maxilla, including the infrazygomatic crest, while tensile stress was observed at the upper part of the maxilla, near the infraorbital rim, in both models (Table 4; Figure 5E,F). It can be explained that as the occlusal force and masseter muscle force are not on the same line of force, the occlusal force does not disappear when the masseter muscle force appears. From this stress pattern, it can be speculated that the entire maxillary complex may bend in the frontal plane, resulting in the compression of the midpalatal suture area. The palatine torus and buccal exostosis that occur on the palate and buccal aspect of the upper premolars and molars are described as hyperplastic bones. Our findings can support the suggestions by Jainkittivong and Langlais26 that environmental factors such as masticatory stress may represent an etiology of the torus and exostosis, if Wolff's Law21 is accepted.
FE analysis is a powerful tool for analyzing the biomechanical changes in the complex geometric parts of the human skeleton. The FE model applied in this study, however, has some drawbacks in reflecting the biological subject. The thickness of the cortical bone and PDL is variable,15,20 and the properties of the biological material of PDL are not isotropic, homogeneous, and linearly elastic.27 The biomechanical reactions of the PDL to external load are different in the adult and the adolescent as a result of the changes in PDL elasticity.18
The amount of mesial movement of the upper molars and alveolar bone remodeling after orthodontic treatment with premolar extraction is variable in individual cases. Some authors7 reported that the occlusal force and occlusal contact area were smaller in the extraction subjects than in the normal subjects, although others8 reported no differences. To visualize the definite differences of the effects of premolar extraction, we used higher occlusal force and muscle force than the loading condition applied by Cattaneo et al.3 and Gross et al.4 In addition, 1000 N for the unilateral occlusal forces is high compared with the force associated with healthy young adults (905.3 N for full arch).6 Therefore, the stress distribution in the present study may differ from the results obtained in the biologic subjects. But the focus of the present study was to evaluate the effect of the positional change of the upper dentition. In this study, it was confirmed that the occlusal load transfer to the maxillofacial region could change after orthodontic treatment with premolar extraction, and local stress concentration was observed in the alveolar bone near the teeth. The effects of the change in the maxillary load transfer after orthodontic treatment on the maxillary growth and the development of the palatine tori, buccal exostosis, alveolar dehiscence, and fenestration should be investigated in a future study.
CONCLUSIONS
The occlusal stresses were transferred through the maxillonasal, maxillozygomatic, and maxillopterygoid stress trajectories.
With the mesial displacement of the upper molars, the equilibrium of the force moved more anteriorly from the key ridge.
Orthodontic treatment with premolar extraction changed the stress distribution of the occlusal force in the human skull, weakening the role of the maxillopterygoid trajectory while strengthening the role of the maxillonasal trajectory.
REFERENCES
- 1.Alexandridis C, Caputo AA, Thanos CE. Distribution of stresses in the human skull. J Oral Rehabil. 1985;12:499–507. doi: 10.1111/j.1365-2842.1985.tb01297.x. [DOI] [PubMed] [Google Scholar]
- 2.Alexandridis C, Thanos CE, Caputo AA. Distribution of stress patterns in the human zygomatic arch and bone. J Oral Rehabil. 1981;8:495–505. doi: 10.1111/j.1365-2842.1981.tb00524.x. [DOI] [PubMed] [Google Scholar]
- 3.Cattaneo PM, Dalstra M, Melsen B. The transfer of occlusal forces through the maxillary molars: a finite element study. Am J Orthod Dentofacial Orthop. 2003;123:367–373. doi: 10.1067/mod.2003.73. [DOI] [PubMed] [Google Scholar]
- 4.Gross MD, Arbel G, Hershkovitz I. Three-dimensional finite element analysis of the facial skeleton on simulated occlusal loading. J Oral Rehabil. 2001;28:684–694. doi: 10.1046/j.1365-2842.2001.00711.x. [DOI] [PubMed] [Google Scholar]
- 5.Seipel CM. Trajectories of the jaws. Acta Odontol Scand. 1948;8:81–191. doi: 10.3109/00016354809040430. [DOI] [PubMed] [Google Scholar]
- 6.Kumagai H, Suzuki T, Hamada T, Sondang P, Fujitani M, Nikawa H. Occlusal force distribution on the dental arch during various levels of clenching. J Oral Rehabil. 1999;26:932–935. doi: 10.1046/j.1365-2842.1999.00473.x. [DOI] [PubMed] [Google Scholar]
- 7.Lee JS, Kim SC. Changes of occlusal contacts and occlusal force following orthodontic treatment. J Wonkwang Biomater Implant Res Inst. 1999;8:149–160. [Google Scholar]
- 8.Sultana MH, Yamada K, Hanada K. Changes in occlusal force and occlusal contact area after active orthodontic treatment: a pilot study using pressure-sensitive sheets. J Oral Rehabil. 2002;29:484–491. doi: 10.1046/j.1365-2842.2002.00849.x. [DOI] [PubMed] [Google Scholar]
- 9.Angle EH. Malocclusion of the Teeth 7th ed. Philadelphia, Pa: SS White Dental Manufacturing; 1907. [Google Scholar]
- 10.Helman M. An interpretation of Angle's classification of malocclusion of the teeth supported by evidence from comparative anatomy and evolution. Dent Cosmos. 1920;42:476–495. [Google Scholar]
- 11.Atkinson SR. The mesiobuccal root of the maxillary first molar. Am J Orthod. 1952;38:642–652. [Google Scholar]
- 12.Atkinson SR. A key to occlusion. Am J Orthod. 1968;54:217–233. doi: 10.1016/0002-9416(68)90211-x. [DOI] [PubMed] [Google Scholar]
- 13.Cha BK, Lee JY, Jost-Brinkmann PG, Yoshida N. Analysis of tooth movement in extraction cases using three-dimensional reverse engineering technology. Eur J Orthod. 2007;29:325–331. doi: 10.1093/ejo/cjm019. [DOI] [PubMed] [Google Scholar]
- 14.Creekmore TD. Where teeth should be positioned in the face and jaws and how to get them there. J Clin Orthod. 1997;31:586–608. [PubMed] [Google Scholar]
- 15.Coolidge ED. The thickness of the human periodontal membrane. J Am Dent Assoc. 1937;24:1260–1270. [Google Scholar]
- 16.Peterson J, Wang Q, Dechow PC. Material properties of the dentate maxilla. Anat Rec A Discov Mol Cell Evol Biol. 2006;288:962–972. doi: 10.1002/ar.a.20358. [DOI] [PubMed] [Google Scholar]
- 17.Jafari A, Shetty KS, Kumar M. Study of stress distribution and displacement of various craniofacial structures following application of transverse orthopedic forces—a three-dimensional FEM study. Angle Orthod. 2003;73:12–20. doi: 10.1043/0003-3219(2003)073<0012:SOSDAD>2.0.CO;2. [DOI] [PubMed] [Google Scholar]
- 18.Tanne K, Yoshida S, Kawata T, Sasaki A, Knox J, Jones ML. An evaluation of the biomechanical response of the tooth and periodontium to orthodontic forces in adolescent and adult subjects. Br J Orthod. 1998;25:109–115. doi: 10.1093/ortho/25.2.109. [DOI] [PubMed] [Google Scholar]
- 19.Yu HS, Baik HS, Sung SJ, Kim KD, Cho YS. Three-dimensional finite-element analysis of maxillary protraction with and without rapid palatal expansion. Eur J Orthod. 2007;29:118–125. doi: 10.1093/ejo/cjl057. [DOI] [PubMed] [Google Scholar]
- 20.Lee HS. The Bone Thickness of Infrazygomatic Crest Area in Growing Skeletal Class III Patients by Computed Tomography [master's thesis] Gangneung, South Korea: Gangneung-Wonju National University; 2006. [Google Scholar]
- 21.Frost HM. Wolff's Law and bone's structural adaptations to mechanical usage: an overview for clinicians. Angle Orthod. 1994;64:175–188. doi: 10.1043/0003-3219(1994)064<0175:WLABSA>2.0.CO;2. [DOI] [PubMed] [Google Scholar]
- 22.Hylander WL. In vivo bone strain in the mandible of Galago crassicaudatus. Am J Phys Anthropol. 1977;46:309–326. doi: 10.1002/ajpa.1330460212. [DOI] [PubMed] [Google Scholar]
- 23.Frost HM. A 2003 update of bone physiology and Wolff's Law for clinicians. Angle Orthod. 2004;74:3–15. doi: 10.1043/0003-3219(2004)074<0003:AUOBPA>2.0.CO;2. [DOI] [PubMed] [Google Scholar]
- 24.Delaire J. Maxillary development revisited: relevance to the orthopaedic treatment of Class III malocclusions. Eur J Orthod. 1997;19:289–311. doi: 10.1093/ejo/19.3.289. [DOI] [PubMed] [Google Scholar]
- 25.Rupprecht RD, Horning GM, Nicoll BK, Cohen ME. Prevalence of dehiscences and fenestrations in modern American skulls. J Periodontol. 2001;72:722–729. doi: 10.1902/jop.2001.72.6.722. [DOI] [PubMed] [Google Scholar]
- 26.Jainkittivong A, Langlais RP. Buccal and palatal exostoses: prevalence and concurrence with tori. Oral Surg Oral Med Oral Pathol Oral Radiol Endod. 2000;90:48–53. doi: 10.1067/moe.2000.105905. [DOI] [PubMed] [Google Scholar]
- 27.Toms SR, Lemons JE, Bartolucci AA, Eberhardt AW. Nonlinear stress-strain behavior of periodontal ligament under orthodontic loading. Am J Orthod Dentofacial Orthop. 2002;122:174–179. doi: 10.1067/mod.2002.124997. [DOI] [PubMed] [Google Scholar]