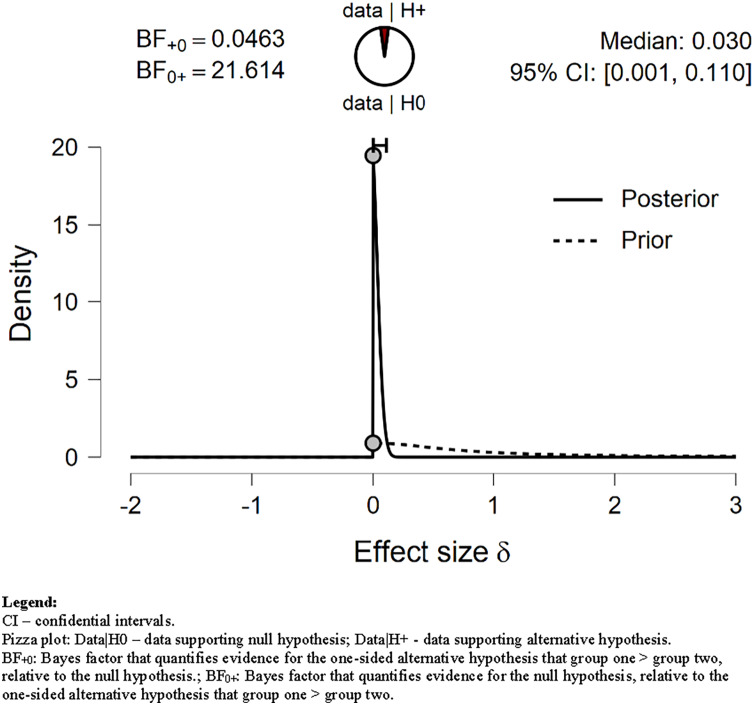
Figure 2. Prior and posterior MPA.
Displays the prior (dashed line) and posterior (solid line) distribution of the effect size under the alternative hypothesis; the gray circles represent the height of the prior and the posterior density at effect size delta = 0. The horizontal solid line represents the width of the 95% credible interval of the posterior.

