

Abstract
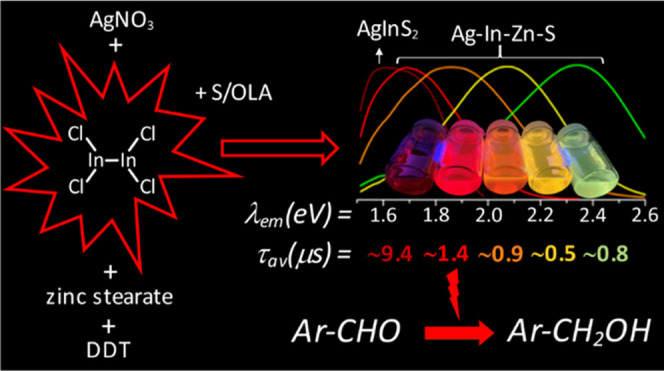
A new indium precursor, namely, indium(II) chloride, was tested as a precursor in the synthesis of ternary Ag–In–S and quaternary Ag–In–Zn–S nanocrystals. This new precursor, being in fact a dimer of Cl2In–InCl2 chemical structure, is significantly more reactive than InCl3, typically used in the preparation of these types of nanocrystals. This was evidenced by carrying out comparative syntheses under the same reaction conditions using these two indium precursors in combination with the same silver (AgNO3) and zinc (zinc stearate) precursors. In particular, the use of indium(II) chloride in combination with low concentrations of the zinc precursor yielded spherical-shaped (D = 3.7–6.2 nm) Ag–In–Zn–S nanocrystals, whereas for higher concentrations of this precursor, rodlike nanoparticles (L = 9–10 nm) were obtained. In all cases, the resulting nanocrystals were enriched in indium (In/Ag = 1.5–10.3). Enhanced indium precursor conversion and formation of anisotropic, longitudinal nanoparticles were closely related to the presence of thiocarboxylic acid type of ligands in the reaction mixture. These ligands were generated in situ and subsequently bound to surfacial In(III) cations in the growing nanocrystals. The use of the new precursor of enhanced reactivity facilitated precise tuning of the photoluminescence color of the resulting nanocrystals in the spectral range from ca. 730 to 530 nm with photoluminescence quantum yield (PLQY) varying from 20 to 40%. The fabricated Ag–In–S and Ag–In–Zn–S nanocrystals exhibited the longest, reported to date, photoluminescence lifetimes of ∼9.4 and ∼1.4 μs, respectively. It was also demonstrated for the first time that ternary (Ag–In–S) and quaternary (Ag–In–Zn–S) nanocrystals could be applied as efficient photocatalysts, active under visible light (green) illumination, in the reaction of aldehydes reduction to alcohols.
Introduction
The preparation of highly luminescent semiconductor nanocrystals, which do not contain toxic metals, is of great importance, especially in view of their application in medicine and biomedical sciences.1−3 This necessity of eliminating toxic elements resulted in quick development of new preparation methods focused on cadmium- and lead-free nanocrystals of various binary, ternary and quaternary semiconductors.4,5 Luminescent binary such as InP6 and ternary AgInS2 and CuInS27−10 nanocrystals are especially interesting in this respect. Colloidal ternary nanocrystals of core/shell structure AgInS2/ZnS as well as alloyed quaternary ones (AgInS2–ZnS) are highly luminescent, yielding emission tunable in a wide spectral range. For this reason, they are tested as components of quantum dot light-emitting diodes (LEDs)11−14 as well as in various types of biomedical applications.15−19 Moreover, in recent years, increasing number of reports can be found on their photovoltaic20−22 and photocatalytic23,24 applications.
In the synthesis of these indium-containing nanocrystals, indium(III) chloride and indium(III) acetate are more frequently used as indium precursors.25−27 There also exist reports on the application of indium(III) nitrate, indium(III) acetylacetonate, indium(III) mercaptoacetate, and more recently, InBr3 and InI3 as precursors.28,29 The reason for testing this rather large number of different simple precursors has its origin in their varying reactivities, inherently associated, among others, with their different solubilities in the reaction medium. The second factor of significant importance is the capability of transforming the initial precursor into its active form through binding ligands to cations originating from this precursor. The decomposition of this active form, strongly dependent on the energy of particular bonds breaking and forming new ones, results in the nucleation of nanocrystals.28,30 A combination of the above-mentioned factors may lead to products of different chemical compositions.28,31
Simple indium precursors are usually used in association with higher fatty acids ligands in varying ratios.32 Alternatively salts of indium(III) with higher carboxylic acids can be used, playing a dual role of a metal precursor and a source of ligands.33 According to the theory of hard and soft acids and bases, In3+ being a hard acid readily binds to hard bases like higher carboxylic acids or amines containing long alkyl substituents.34 It should, however, be noted that In3+ ions present in the reaction mixture at different stages of nucleation or crystal growth are significantly harder acids than surfacial In3+ ions.35 Different hard acid character of surfacial In3+ ions is clearly manifested by strong effects of ligands on the luminescent properties of indium-containing nanocrystals.36,37
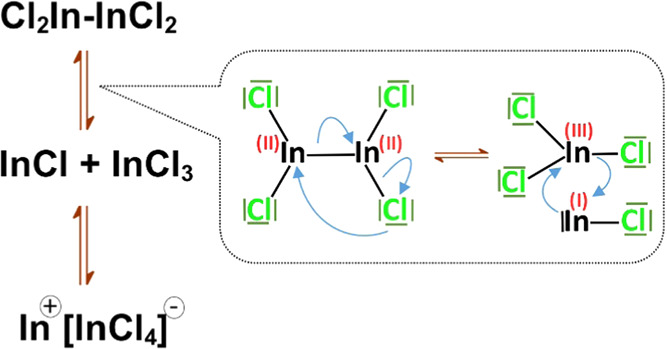
There exist several compounds in which the formal oxidation state of indium is lower than +3.38 Among them, indium(II) chloride seems especially interesting as a candidate for indium precursor in the synthesis of nanocrystals since it is stable in air and commercially available. In reality, this compound is present in a form of a dimer In2Cl4. In–In bond in this compound is weak compared to In–Cl one. This leads to its disproportionation with simultaneous formation of In+[InCl4]− (see Scheme 1).39 This disproportionation reaction can be strictly controlled40,41 and applied for in situ generation of In3+ ions in the reaction mixture used in the preparation of nanocrystals. The interest in new precursors containing indium in the oxidation state lower than +3 can be exemplified by a recent report of the use of complexes generated from In(I)Cl in the synthesis of colloidal InAs nanocrystals.42
Scheme 1. Mechanism of Indium(II) Chloride Disproportionation.
In this paper, we demonstrate for the first time that indium(II) chloride can be used as an efficient precursor in the preparation of highly luminescent inorganic semiconductor nanocrystals varying in composition, shape, and size. In particular, using this precursor it is possible to prepare ternary AgInS2 and alloyed quaternary AgInS2–ZnS nanocrystals exhibiting strong photoluminescence covering the whole visible range of the spectrum. The new precursor turned out to be more reactive than In(III) precursors investigated to date. Its enhanced reactivity had a pronounced effect on the chemical constitution and morphology of the resulting nanocrystals and on surfacial ligand transformations, previously never observed for this type of nanocrystals.
Results and Discussion
Synthesis and Characterization of the Nanocrystals
Similarly to indium(III) chloride, indium(II) chloride is stable under ambient conditions; thus, all operations involving this reagent can be performed in air. A comparison of the reactivities of both types of precursors was made possible by replacing indium(III) chloride with indium(II) chloride in the reaction mixture, while keeping all other reaction conditions unchanged.43−45 Ternary Ag–In–S nanocrystals were obtained from a reaction mixture consisting of AgNO3 and InCl2 precursors, 1-dodecanethiol (DDT), and 1-octadecene (ODE) as a solvent (batch AIS). In the case of the synthesis of quaternary Ag–In–Zn–S nanocrystals, zinc stearate was additionally added (batches A-(1–4)). An increasing number of A-X samples corresponds to increasing zinc content. Before describing the procedure of nanocrystals preparation, it is instructive to discuss the color changes of the reaction mixtures containing InCl2 upon their heating from room temperature to 150 °C. At 90 °C, their color changed to yellow, upon further increase of the temperature to 150 °C this color again changed to dark brown. The observed changes were inherently associated with the transformations of InCl2 precursor since heating of the precursor mixtures containing InCl3 did not cause any visual color change but only gradual dissolution of precursors which yielded colorless, clear liquids. Figure S1 in the Supporting Information presents photographs of both types of reaction mixtures taken at different temperatures. Moreover, in Figure S2 in the Supporting Information, UV–vis spectra, registered for the reaction mixture at different stages of its heating before and after the injection of the sulfur precursor, are compared. This is completed by a short comment explaining these changes.
The reactions leading to nanocrystals formation were initiated by injection of sulfur dissolved in oleylamine (S/OLA) to these mixtures at 150 °C. This was followed by heating to 180 °C. At this temperature, the reaction mixtures were kept for an additional 1 h. Mixtures with InCl3 precursors yielded black, insoluble precipitates at the end of the reaction, whereas in the case of the use of InCl2 precursors no precipitates could be observed.45 Nanocrystals of AIS and A-(1–4) were separated from the reaction mixture by precipitation with acetone, followed by centrifugation. They were then redispersed in typical nonpolar or weakly polar solvents such as toluene, chloroform, and methylene chloride.
AIS nanocrystals were prepared using the metal precursors ratio InCl2/AgNO3 of 3.0. The application of a significant excess of the precursor of indium was based on experimentally established findings indicating that the presence of defects in nonstoichiometric ternary nanocrystals (In/Ag > 1.0) is beneficial for the resulting photoluminescence quantum yield (PLQY), in accordance with donor–acceptor mechanism of radiative recombination.45−47 As expected AIS nanocrystals were strongly nonstoichiometric and enriched in indium: Ag1.0In1.4S2.5(S2.6), where the value given in parentheses denotes theoretical content of sulfide anions corresponding to the sum of silver and indium cations. Compositions of nanocrystals of all prepared batches (AIS and A-(1–4)) are collected in Table 1, whereas their energy-dispersive spectra (EDS) are presented in Figures S3 and S4 in the Supporting Information.
Table 1. Precursor Molar Ratios (Silver Nitrate/Indium(II) Chloride/Zinc Stearate/DDT/Sulfur in 1 mL of OLA) and Characteristics of the Synthesized Ternary Ag–In–S and Quaternary Ag–In–Zn–S Nanocrystals: Compositions; Size: Diameter/Width (D), Length (L), and Aspect Ratio (L/D).
| Ag/In/Zn/SDDT/SS | Ag/In/Zn/S(S) | C (wt %) | O (wt %) | Cl (wt %) | S (wt %) | D (nm) | L (nm) | L/D | |
|---|---|---|---|---|---|---|---|---|---|
| AIS | 1.0/3.0/–/5.0/2.5 | 1.0/1.4/–/2.5(2.6) | 6.9 | 0.6 | 1.1 | 20.9 | 9.8 ± 2.3 | 1.2 ± 0.2 | |
| A-1 | 1.0/3.0/1.0/5.0/2.5 | 1.0/1.5/0.3/3.3(3.0) | 47.9 | 8.6 | 0.6 | 9.4 | 6.2 ± 1.1 | 1.2 ± 0.2 | |
| A-2 | 1.0/3.0/3.0/5.0/2.5 | 1.0/1.5/1.9/3.6(4.6) | 45.8 | 7.3 | 1.3 | 9.6 | 3.7 ± 0.7 | 1.1 ± 0.1 | |
| A-3 | 1.0/3.0/6.0/5.0/2.5 | 1.0/1.5/4.4/6.8(7.1) | 50.3 | 9.7 | 1.2 | 9.5 | 3.9 ± 0.9 | 9.0 ± 1.7 | 2.4 ± 0.7 |
| A-4 | 1.0/3.0/9.0/5.0/2.5 | 1.0/10.3/12.4/11.8(28.3) | 62.7 | 14.1 | 0.8 | 2.8 | 3.1 ± 0.7 | 9.9 ± 2.2 | 3.3 ± 0.9 |
The powder diffractogram of AIS is shown in Figure 1a. The following peaks can be distinguished which can be ascribed to (120), (002), (121), (320), (123), and (322) of orthorhombic AgInS2 (JCPDS 00-025-1328). Enhanced intensity of (002) reflection has its origin in the strong overlap of this peak with (121) reflection of chalcopyrite AgInS2 (JCPDS 00-25-1330). Orthorhombic-chalcopyrite polytypism was reported for Ag–In–S nanocrystals48,49 similarly to wurtzite-chalcopyrite polytypism in the case of Cu–In–S nanocrystals.50 The aspect ratio of AIS nanocrystals is rather low (1.2 ± 0.20); thus, they can be considered as almost spherical of 9.8 ± 2.3 nm diameter (n = 300). Their high-resolution transmission electron microscopy (HR-TEM) and transmission electron microscopy (TEM) images are presented in Figure 1b,c, indicating an interplanar distance of 0.359 nm, which corresponds to the (120) reflection of orthorhombic AgInS2.51−53 A close inspection of these HR-TEM images reveals the presence of nanocrystals of different orientations of planes, thus corroborating polytypism of the obtained nanoparticles.50
Figure 1.

(a) X-ray diffraction (XRD) patterns of Ag1.0In1.4S2.5(S2.6) (AIS) nanocrystals; (b) HR-TEM image and selected area electron diffraction (SAED) patterns of Ag1.0In1.4S2.5(S2.6) (AIS); and (c) TEM image and the corresponding histogram of Ag1.0In1.4S2.5(S2.6) (AIS) nanocrystals.
In the preparation of quaternary Ag–In–Zn–S nanocrystals (batches A-(1–4)), the same composition of the reaction mixture was maintained with a fixed molar ratio of indium to silver precursors (InCl2/AgNO3 = 3). The only parameter being changed was the content of zinc precursor (zinc stearate) which increased from A-1 to A-4. The most striking difference in chemical compositions of AIS nanocrystals and A-(1–4) ones was the ratio of inorganic core elements to organic ones. In the case of AIS nanocrystals, the elements of the inorganic core predominated with the content of carbon originating from organic ligands being as low as 7 wt %. EDS analysis of A-(1–4) nanocrystals yielded carbon contents in the range of 46–63 wt %, clearly showing higher ligand content. This was expected, taking into account a significantly higher surface-to-volume ratio originating from the higher surface-to-volume ratio of A-(1–4) nanocrystals compared to the AIS ones. For A-(1–3) nanocrystals, introduction of the precursor of zinc had no or little effect on the conversion of indium precursor since the determined indium-to-silver ratios (In/Ag = 1.5) were very close to the value found for AIS nanocrystals (In/Ag = 1.4). Only for the highest zinc precursor content in the reaction mixture (batch A-4), the indium precursor conversion abruptly increased, yielding In/Ag = 10.3 in the resulting nanocrystals.
In Figure 2, Zn/Ag molar ratios in A-(1–4) nanocrystals are plotted against the corresponding molar ratios in the reaction mixture. Nanocrystals of A-(1–3) batches were enriched in Ag, i.e., their Zn/Ag ratios were lower than the molar ratios of their precursors. On the contrary, A-4 nanocrystals were enriched in Zn since precursors in the molar ratio Zn/Ag = 9.0 yielded nanocrystals of Zn/Ag = 12.4. Additional points in the plot B-1 (Ag1.0In2.8Zn1.3S4.0(S6.0)) and B-2 (Ag1.0In1.5Zn7.8S17.0(S10.5)) represent nanocrystals obtained with InCl3 as a precursor, which were reported in ref (54). Elemental analyses of nanocrystals obtained with two different indium precursors (InCl2vs InCl3) indicated distinct differences in their reactivities in the reaction medium. In the case of InCl2, with increasing concentration of the precursor of zinc, the conversion of indium precursor remained at a similar level A-(1–3). It abruptly increased for a high degree of zinc precursor conversion (A-4). On the contrary, conversion of InCl3 dropped with increasing conversion of the precursor of zinc.
Figure 2.
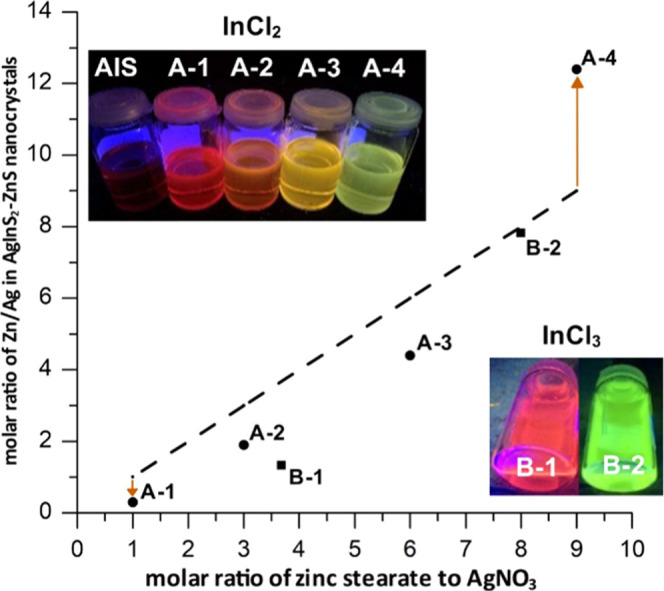
Molar ratio of zinc stearate to AgNO3 in the reaction mixture vs Zn/Ag ratio in the resulting AgInS2–ZnS nanocrystals (molar ratio of indium precursor to AgNO3 = 3.0). Circles: this research (InCl2) A-(1–4), squares: experimental data (InCl3) B-1 and B-2 from ref (54). The insets show photographs of UV-illuminated (365 nm) nanocrystals dispersed in toluene solutions.
In Figure 3a, powder diffractograms of A-(1–4) nanocrystals are presented. Three broadened peaks can be distinguished in each case, whose positions are intermediate between the reflections characteristic of orthorhombic AgInS2 (JCPDS 00-025-1328) and hexagonal ZnS (JCPDS 00-036-1450). The effect of zinc content on the position of Bragg reflections could be conveniently followed by analyzing the shift of (002) reflection, which is located at 2θ = 26.6 and 28.5° for orthorhombic AgInS2 and hexagonal ZnS, respectively. With increasing zinc content in the studied quaternary nanocrystal (002) reflection was being increasingly shifted toward higher 2θ values: 26.6° (A-1), 26.8° (A-2), 27.2° (A-3), and 28.0° (A-4). The introduction of zinc to yield quaternary nanocrystals resulted in a significant decrease of their size from 9.8 ± 2.3 nm in ternary Ag1.0In1.4S2.5(S2.6) (AIS), to 6.2 ± 1.1 nm in quaternary Ag1.0In1.5Zn0.3S3.3(S3.0) (A-1). Both AIS and A-1 nanocrystals could be considered as close to spherical but somehow irregular in shape (aspect ratio = 1.2) (see Figures 1 and 3). A-2 (Ag1.0In1.5Zn1.9S3.6(S4.6)) nanocrystals containing more zinc were even smaller (D = 3.7 ± 0.7 nm) and were characterized by an aspect ratio reduced to 1.1. Further increase in the content of zinc resulted in a radical change in the shape of nanocrystals from spherical to longitudinal. In the case of A-3 (Ag1.0In1.5Zn4.4S6.8(S7.1)) nanocrystals, their width (3.9 ± 0.9 nm) was comparable to the diameter of A-2 nanocrystals, but their length was 9.0 ± 1.7 nm, yielding an aspect ratio of 2.4. An even higher aspect ratio (3.3) was obtained for A-4 (Ag1.0In10.3Zn12.4S11.8(S28.3)) nanocrystals characterized by smaller width (3.1 ± 0.7 nm) and higher length (9.9 ± 2.2 nm).
Figure 3.

X-ray powder diffractograms of Ag1.0In1.5Zn0.3S3.3(S3.0) (A-1), Ag1.0In1.5Zn1.9S3.6(S4.6) (A-2), Ag1.0In1.5Zn4.4S6.8(S7.1) (A-3), and Ag1.0In10.3Zn12.4S11.8(S28.3) (A-4) nanocrystals (a), HR-TEM (b, d), and TEM (c, e) images of Ag1.0In1.5Zn0.3S3.3(S3.0) (A-1) and Ag1.0In10.3Zn12.4S11.8(S28.3) (A-4) alloyed nanocrystals and their corresponding histograms.
It is instructive to compare HR-TEM images of A-1 and A-4 nanocrystals significantly differing in their size, shape, and zinc content (see Figure 3b,d). The interplanar distances derived from these images were in the range of 0.310–0.339 nm and could be ascribed to (002) interplanar distances of orthorhombic AgInS2 and hexagonal ZnS, corroborating alloyed-type structure of the studied nanocrystals.23,45,55,56 Possible, alternative alloyed-type structures of tetragonal AgInS2 (JCPDF 00-25-1330) and cubic ZnS (JCPDF 00-50-0566) can be excluded since in this case significantly shorter interplanar distances, in the range 0.1–0.2 nm should have been observed.57−59 Moreover, HR-TEM studies excluded the possibility of the formation of hexagonal InAgZn2S4-type structures (JCPDF 00-025-0383) since they are characterized by interplanar distances of 0.25–0.29 nm.60−62 TEM images of A-1 and A-4 nanocrystals are shown in Figure 3c,e. The corresponding images of A-2 and A-3 nanocrystals can be found in the Supporting Information.
Nanocrystals A-1 and A-4 were compared with the corresponding nanocrystals obtained in the same conditions but using a different indium precursor, i.e., InCl3. TEM images of these nanocrystals denoted as B-1 and B-2 are shown in Figure S7 in the Supporting Information. For small concentrations of the precursor of zinc, no significant differences could be noticed between InCl3 and InCl2 precursors. In both cases, relatively large, spherical nanocrystals were obtained of very similar size: A-1 (D = 6.2 ± 1.1 nm) and B-1 (D = 6.2 ± 0.9 nm). Large concentrations of zinc precursor in the reaction mixtures resulted in pronounced differentiation in shape and size of nanocrystals obtained using different indium precursors. As already mentioned, in the case of InCl2 precursor, longitudinal nanoparticles were formed (A-4, L = 9.9 ± 2.2 nm; D = 3.3 ± 0.9 nm). The use of InCl3 precursor resulted in the formation of spherical nanocrystals of smaller size than A-1 nanoparticles (B-2, D = 4.2 ± 0.6 nm).
These morphological and composition differences clearly seen in quaternary Ag–In–Zn–S nanocrystals obtained with InCl2 and InCl3 have their origin in differences in these precursors reactivities and are consistent with our previous findings concerning the reactivity of silver precursors.63 If highly reactive silver precursor (AgNO3) in combination with InCl2 and zinc precursor of low concentration were used, AgInS2 phase was formed at the nucleation stage, which was then converted into quaternary Ag–In–Zn–S phase at subsequent stages of the crystal growth. In the case of reaction mixtures of high zinc precursor concentrations, with the highly reactive indium precursor (InCl2) concentration unchanged (case of A-4 nanocrystals), nucleation of ZnIn2S4 phase took place, which was then followed by the formation of quaternary Ag–In–Zn–S nanocrystals of longitudinal shape. This change in the nanocrystals morphology could be ascribed to the high reactivity of InCl2 combined with the high concentration of zinc precursor, both factors favoring anisotropic growth of nanoparticles.64 If InCl3, exhibiting significantly lower reactivity compared to InCl2, was present in the reaction mixture, it preferentially reacted with AgNO3 to nucleate the AgInS2 phase. This process occurred even in reaction mixtures of high zinc precursor concentrations (case of B-2 nanocrystals). Nucleation of this type resulted in a quick drop of the precursor concentration and was followed by subsequent growth, converting ternary germs into quaternary Ag–In–Zn–S nanocrystals of spherical shape and relatively low diameter. It should be, however, noted that nucleation via ZnIn2S4 phase formation was previously observed by us even in the presence of the InCl3 precursor, but only in the case when a highly reactive silver precursor was not present in the reaction mixture at the stage of nucleation. This was demonstrated by performing a two-step injection of precursors in which the sulfur precursor was injected in the first step followed by the addition of the silver precursor in the second step.65
Optical Properties
Tetragonal AgInS2 of chalcopyrite structure is thermodynamically stable at temperatures inferior to 620 °C. Its band gap is equal to 1.87 eV49,66 and its exciton Bohr radius is relatively small (5.5 nm).67 Orthorhombic AgInS2 of pseudowurtzite structure is thermodynamically stable at relatively higher temperatures, its band gap is larger—1.98 eV.49,66 The quantum confinement effect is observed for its nanocrystals of diameter inferior to 5 nm,68 indicating a similar value of the exciton Bohr radius as in the case of chalcopyrite-type AgInS2. The observed increase of the orthorhombic AgInS2 band gap can originate from its nonstoichiometry and, in particular, an increased ratio of In/Ag > 1.0. It is postulated that in this case, the upper edge of the valence band corresponds to hybridized S 3p and Ag 4d orbitals, whereas the lower edge of the conduction band is attributed to hybridized S 3p and Ag 4d orbitals.69
UV–vis–near-infrared (NIR) of ternary (AIS) and quaternary (A-(1–4)) nanocrystals dispersed in toluene are presented in Figure 4. On the basis of these spectra, optical band gaps were determined following the relationship (Ahν)2vshν (see Figure S8 in the Supporting Information). Eg(opt) ∼ 2.0 eV was determined for AIS (Ag1.0In1.4S2.5(S2.6)), nanocrystals, a value very close to that of bulk orthorhombic AgInS2. This was not unexpected since no quantum confinement was expected for these relatively large nanoparticles (9.8 ± 2.3 nm). Essentially the same Eg(opt) ∼ 2.0 eV was calculated for A-1 (Ag1.0In1.5Zn0.3S3.3(S3.0)) nanocrystals characterized by small content of zinc and relatively large size (6.2 ± 1.1 nm). Eg(opt) steadily enlarged with increasing content of zinc: 2.4 eV (A-2), 2.7 eV (A-3) and 3.2 eV (A-4). These values consistently fell in the range determined by the bands of orthorhombic AgInS2 (1.98 eV)66 and hexagonal ZnS (3.68 eV).70
Figure 4.
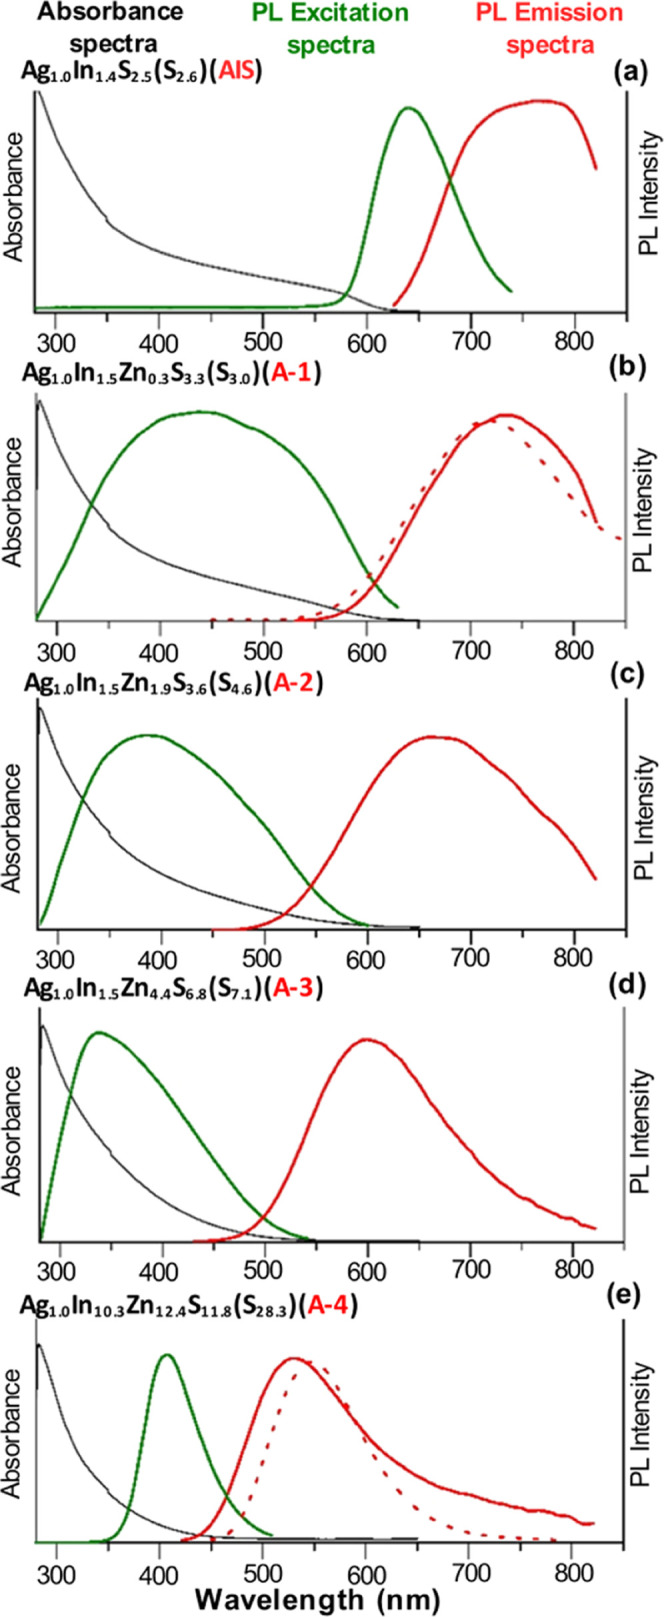
Absorbance, photoluminescence excitation, and emission spectra of toluene dispersion of Ag1.0In1.4S2.5(S2.6) (AIS) (a) and alloyed Ag1.0In1.5Zn0.3S3.3(S3.0) (A-1) (b), Ag1.0In1.5Zn1.9S3.6(S4.6) (A-2) (c), Ag1.0In1.5Zn4.4S6.8(S7.1) (A-3) (d), and Ag1.0In10.3Zn12.4S11.8(S28.3) (A-4) (e) nanocrystals. For comparison, the emission spectra (dot lines) of toluene dispersions of Ag1.0In2.8Zn1.3S4.0(S6.0) (B-1) and Ag1.0In1.5Zn7.8S17.0(S10.5) (B-2) alloyed nanocrystals are presented.
Photoluminescence of binary nanocrystals such as CdSe is governed by a simple mechanism of radiative recombination (1S(e) → 1S3/2(h)) between the states located in the vicinity of the band edge. This gives rise to a very narrow emission peak (full width at half-maximum, fwhm, of 80–150 meV at room temperature), small Stokes shift (21 ± 4 meV), and room-temperature radiative decay times of the order of 18–40 ns. Spectral parameters are also dependent on the size of nanocrystals (quantum confinement) and the presence of surfacial defects, which may quench the photoluminescence.71−73 In ternary nanocrystals such as AgInS2 as well as in core/shell AgInS2/ZnS, alloyed AgInS2–ZnS and nonstoichiometric Ag–In–Zn–S (In/Ag ≠ 1.0) ones, the emission is governed by the donor–acceptor pair recombination mechanism.74 The donor states are located in the band gap, below the lower edge of the conduction band and are associated with the presence of S vacancies and interstitial Ag atoms. The acceptor states located above the upper edge of the valence band originate from the presence of Ag vacancies and interstitial S atoms.
Surfacial defects in the forms of vacancies, dangling bonds, and oxygen adatoms may also contribute to this mechanism.68,75 Radiative recombination mechanism in ternary AgInS2 nanocrystals and related alloyed and nonstoichiometric nanoparticles gives rise to broad emission peaks (fwhm ∼ 0.4 eV) and large Stokes shifts.74 These characteristic spectral features are rationalized by strong electron–phonon interactions of trapped carriers.68 Deeper elucidation of these phenomena requires the use of time-resolved emission spectroscopy techniques. Decay curves registered for ternary AgInS2 and core/shell AgInS2/ZnS ones are of complex character and cannot be fitted with a single-exponential function and usually require the application of two23,68,74,76,77 or three-exponential models.17,24,49,75,78,79 The two-exponential model yields two decay times: the longer one (τ2) is usually ascribed to the photoluminescence originating from the bulk of the nanocrystal according to the above-described donor–acceptor pair mechanism. The shorter decay time (τ1) is related to the photoluminescence involving surfacial defects.68 In the case of photoluminescence of ternary AgInS2 and CuInS2 nanocrystals which had to be fitted using three-exponential model, different interpretations could be found in the literature explaining the presence of the third exponent.75,80,81 For example, detailed analysis of the photoluminescence decay in alloyed AgInS2–ZnS nanocrystals clearly demonstrated the necessity of fitting the obtained data using three-exponential functions. The shortest decay time (τ1) was attributed to the presence of surficial defects, the intermediate (τ2) and the longest (τ3) decay times could be tentatively ascribed to the recombination between the donor and acceptor states at the surface and in the bulk of a nanocrystal, respectively.75 These briefly outlined photoluminescence mechanisms are schematically illustrated in Figure 5b. It should, however, be noted that such characteristic Stokes-shifted and long-lived luminescence was also observed for stoichiometric AgInS2 and CuInS2 nanocrystals. This was rationalized by theoretical and experimental investigations as effects originating from the detailed structure of the valence band featuring two sublevels with different parity.82,83
Figure 5.
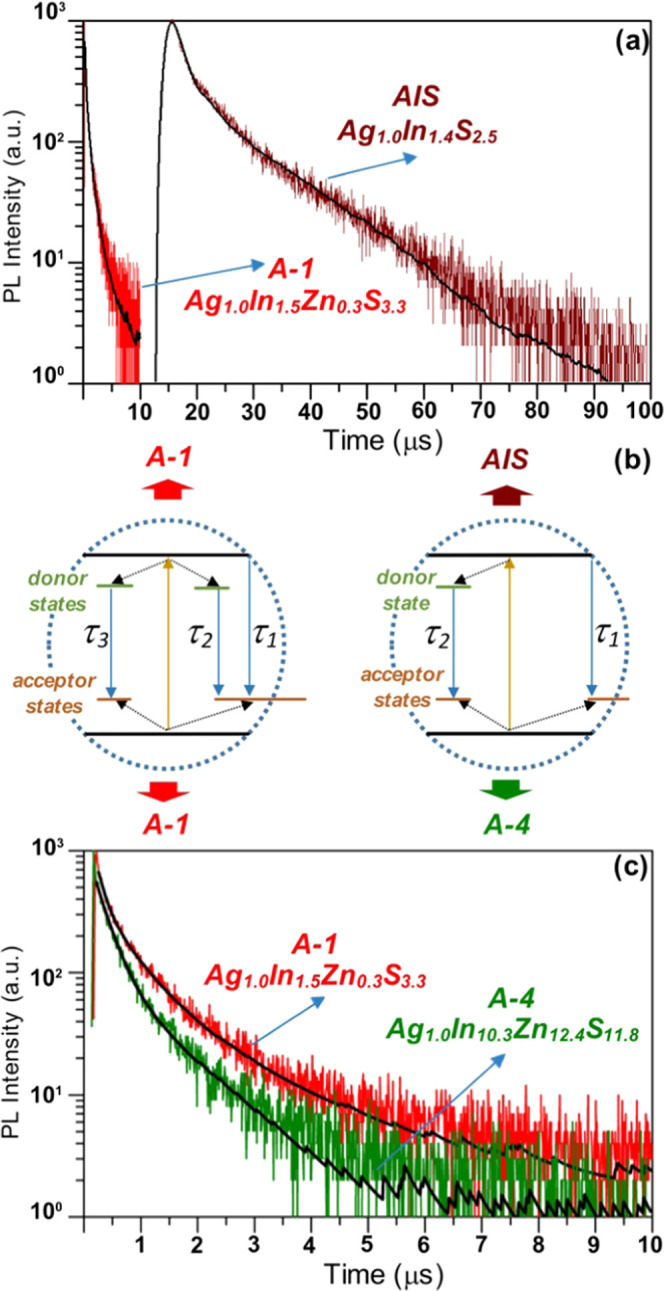
Photoluminescence decay curves of Ag1.0In1.4S2.5(S2.6) (AIS) (a) and alloyed Ag1.0In1.5Zn0.3S3.3(S3.0) (A-1) (a, c) and Ag1.0In10.3Zn12.4S11.8(S28.3) (A-4) (c) nanocrystals and the corresponding bi (AIS and A4) and three (A-1)-exponential fitting curves. Schematic of the relaxation dynamics proposed for AIS, A-1, and A-4 nanocrystals (b).
UV–vis–NIR absorption spectra as well as excitation and stationary photoluminescence spectra of AIS and A-(1–4) nanocrystals are compared in Figure 4. Photoluminescence decay curves registered for AIS, A-1, and A-4 nanocrystals are presented in Figure 5a,c. The corresponding curves obtained for A-2 and A-3 nanocrystals are shown in Figure S9 in the Supporting Information. The decay profiles were fitted using two (AIS and A-4) and three (A-1, A-2, and A-3) exponential models yielding high accuracy, as indicated by the narrow distribution of fitting residuals (see eqs 1 and 2)84
| 1 |
| 2 |
where I(t) is the photoluminescence intensity (au); τ1, τ2, and τ3 are the photoluminescence lifetime components (ns); A0 is the background noise level; and A1, A2, and A3 represent the relative weight of the decay components (%) at t = 0.
For all fitting functions, the obtained χ2 values were in the range of 0.98–1.1, proving adequacy of the applied fitting method. Average photoluminescence lifetimes were calculated according to eq 3
| 3 |
where τav denotes the average photoluminescence decay time (ns) and Ai and τi are the normalized amplitude (%) and the lifetime (ns) of the (i) component, respectively.
All optical parameters determined for ternary (AIS) and quaternary (A-(1–4)) nanocrystals are collected in Table 2.
Table 2. Optical Band Gaps, Maxima of the Photoluminescence Bands (PL), Quantum Yields (QY), Tri- and Biexponential Fit Parameters, χ2 Values, and Average Emission Lifetimes (τav) for Ternary Ag–In–S and Quaternary Ag–In–Zn–S Nanocrystals.
| sample | Eg(opt) (eV) | PL (nm) | QY (%) | τ1 (ns) | A1 (%) | τ2 (ns) | A2 (%) | τ3 (ns) | A3 (%) | χ2 | τav (ns) |
|---|---|---|---|---|---|---|---|---|---|---|---|
| AIS | 2.0 | 755 | 12.0 | 1151 | 83.4 | 13 120 | 16.6 | 1.10 | 9458 | ||
| A-1 | 2.0 | 731 | 40.0 | 139 | 16.5 | 591 | 50.7 | 1921 | 32.8 | 1.07 | 1460 |
| A-2 | 2.4 | 664 | 21.0 | 2 | 0.9 | 343 | 46.9 | 1081 | 52.1 | 0.98 | 917 |
| A-3 | 2.7 | 596 | 33.3 | 84 | 13.3 | 331.5 | 56.5 | 1051 | 30.2 | 1.09 | 500 |
| A-4 | 3.2 | 528 | 20.0 | 251 | 63.6 | 1039 | 36.4 | 1.06 | 805 |
The excitation spectrum of AIS (Ag1.0In1.4S2.5(S2.6)) nanocrystals consisted of a relatively narrow peak with a clear maximum at 625 nm located close to the absorption threshold in the UV–vis–NIR spectrum and roughly corresponding to the optical band gap (∼2.0 eV). Its emission peak was broad showing a maximum at ∼755 nm. The introduction of even small amounts of zinc to yield quaternary A-1 (Ag1.0In1.5Zn0.3S3.3(S3.0)) nanocrystals resulted in profound spectroscopic changes. In particular, the excitation peak broadened covering the spectral range of 300–600 nm. Its maximum was hypsochromically shifted to ∼450 nm. In addition, a significant increase of PLQY was observed from 12% in the case of AIS nanocrystals to 40% for A-1 ones. A-1 nanocrystals emitted red light (λmax = 731 nm). With growing zinc content the emission peak was being increasingly hypsochromically shifted to λmax = 664 nm for A-2 (Ag1.0In1.5Zn1.9S3.6(S4.6)) nanocrystals and λmax = 596 nm for A-3 (Ag1.0In1.5Zn4.4S6.8(S7.1)) nanocrystals. A-4 (Ag1.0In10.3Zn12.4S11.8(S28.3)) nanocrystals which were the richest in zinc emitted green light (λmax = 528 nm). It should be pointed out that its excitation peak was relatively narrow, contrary to the cases of A-1, A-2, and A-3 nanocrystals. Moreover, its maximum at ca. 400 nm closely corresponded to the absorption threshold in the UV–vis–NIR spectrum as well as to the optical band gap of 3.1–3.2 eV. It should be noted that these relatively narrow excitation spectra of AIS and A-4 are not typical. However, several examples of excitation spectra of similar shapes were reported for a variety of nanocrystals, for example for CuInS2–ZnS85 and AgInS2–ZnS nanocrystals69,86 The excitation spectrum of AgInS2–ZnS presented in ref (87) was essentially identical in shape to the spectra of AIS and A-4.
The spectroscopic peculiarity of AIS (Ag1.0In1.4S2.5) nanocrystals was manifested in its decay curves fitted by two-exponential functions (Figure 5a). This fitting resulted in extremely long decay times τ1 and τ2 of ∼1.1 and ∼13.1 μs leading to an average value (τav) of 9.4 μs—the highest ever reported for ternary Ag–In–S nanocrystals. Typical decay times reported for this class of nanocrystals were in the range of 3–4 μs.88 Decay curves of quaternary nanocrystals had to be fitted with three-exponential functions. The results of these fittings showed that τav values determined for quaternary nanocrystals (A-(1–3)) were 1 order of magnitude smaller than that calculated for ternary (AIS) ones. Moreover, they were dependent on zinc content decreasing from 1.5 to 0.5 μs when going from A-1 to A-3. τ1 values were also strongly reduced to 2–140 ns. Finally, τ2 and τ3, i.e., decay times reflecting donor–acceptor radiative processes associated with the nanocrystal core and surface, respectively, were of the order of 0.3 and 1.0 μs. It should also be noted that for quaternary nanocrystals, the contribution of surficial processes characterized by τ1 was significantly smaller than in the case of AIS nanocrystals, dropping to 1% for A-2 nanocrystals, where the donor–acceptor radiative recombination mechanism predominated.
The richest in zinc A-4 (Ag1.0In10.3Zn12.4S11.8(S28.3)) nanocrystals behaved distinctly different. Its decay curve could be fitted with two-exponential functions (see Figure 5b,c) yielding τav ∼ 0.8 μs. The calculated τ1 and τ2 were 251 and 1039 ns, respectively. Compared to A-(1–3) nanocrystals, the contribution of surficial mechanisms characterized by τ1 was significantly more pronounced (>60%), whereas the contribution of donor–acceptor recombination occurring in the core diminished to ca. 36% (see Table 2). These distinct differences between decay curves of A-(1–3) and A-4 and the different nature of its excitation spectrum are perfectly in line with our already expressed conclusion suggesting different nucleation mechanisms of these zinc-rich nanocrystals which involves the formation of ZnIn2S4 rather than AgInS2 as in the case of A-(1–3) nanocrystals.
Comparison of nanocrystals prepared using the InCl2 precursor with those synthesized applying InCl3 in identical conditions, i.e., B-1 in the same conditions as A-1 and B-2 in the same conditions as A-4, clearly showed that the dissimilarity of their spectroscopic properties originated from significant differences in their chemical compositions caused by the use of indium precursors of different reactivities. B-1 (Ag1.0In2.8Zn1.3S4.0(S6.0)) and B-2 (Ag1.0In1.5Zn7.8S17.0(S10.5)) emitted red (720 nm) and green (543 nm) light, respectively, consistent with their different Zn/Ag ratios.54 It should be noted that A-4 and B-2 exhibit similar emission spectra with maxima at 528 and 542 nm, respectively, despite different shapes and sizes. In the case of ternary or quaternary nanocrystals of sizes inferior to their exciton Bohr radii, the luminescence band position is a complex product of their composition and the quantum confinement phenomenon. The hypsochromic shift of the photoluminescence band of A-4 to the green region of the visible spectrum is most probably caused by the high content of Zn in these quaternary nanocrystals, although the quantum confinement effect can also interfere, taking into account their rather small diameter (L = 9.9 ± 2.2 nm, D = 3.3 ± 0.9 nm). The same two factors influence the position of the photoluminescence band of spherical B-2 nanocrystals, the effect of quantum confinement being probably more pronounced (D = 3.3 ± 0.9 nm). It is difficult to separate these two factors but their combination may lead to similar spectra of nanocrystals differing in composition, shape, and size. The application of more reactive indium(II) chloride significantly extended the range of nanocrystals compositions possible to obtain. For example, Zn/Ag ratios could be varied from 0.3 to 12.4, allowing for precise tuning of the photoluminescence in the spectral range from 755 to 528 nm.
To summarize this part of the research, the use of InCl2 as a new precursor of indium in the preparation of semiconductors nanocrystals resulted in the preparation of ternary Ag–In–S and quaternary Ag–In–Zn–S nanoparticles which distinctly differed in their morphological and spectroscopic properties from nanocrystals synthesized using different precursors of indium and stabilized either with hydrophobic or hydrophilic ligands. Detailed comparison of spectroscopic properties of nanocrystals prepared in this research and other ternary and quaternary nanocrystals of this family, reported in the literature, is presented in Table S1 in the Supporting Information.
In this respect, special attention should be paid to extremely long decay times of τav ∼ 9.4 and ∼1.5 μs, determined for AIS (Ag1.0In1.4S2.5(S2.6)) and A-1 (Ag1.0In1.5Zn0.3S3.3(S3.0)) nanocrystals, respectively. Further investigations of these nanocrystals should be carried out in view of their promising applications in bioimaging, photocatalysis, and photovoltaics.68,88
Surface Characterization
InCl2 precursor as well as the nanocrystals prepared with its use (AIS, A-1, and A-4) were additionally studied by X-ray photoelectron spectroscopy (XPS). The resulting survey spectra are presented in Figures S10 and S11 in the Supporting Information. In Figure 6a,b, high-resolution XPS (HR-XPS) spectra of indium(II) chloride are presented. In the XPS In 3d spectrum, only one doublet is present at 446.2 eV (In 3d5/2) and 453.7 eV (In 3d3/2). The measured binding energy Eb, is distinctly different than that of In(I) (444.9–445.1 eV),89,90 but it falls in the range reported for InCl3 (445.9–446.9 eV)89,90 and In2O3 (444.3–446.7 eV).91,92 Similarly, Eb derived from the XPS Cl 2p spectrum (199.3 eV for Cl 2p3/2) is close to that reported for InCl3 (199.1 eV) but is clearly different from the value reported for InCl (198.5 eV).90 The presence of only one type of indium and chlorine seems to favor the dimeric form of the precursor (Cl2In–InCl2), characterized by strong contribution of the In–In covalent bond, rather than its disproportionated form of In(I)In(III)Cl4 where two oxidation states of indium are expected. As seen from the survey spectrum, the content of carbon and oxygen were of the order 0.05 wt %. These impurities were identified as water and organic origin contaminants by recording HR-XPS C 1s and O 1s (see Figure S12 in the Supporting Information).
Figure 6.

In 3d (a) and Cl 2p (b) high-resolution XPS spectra in the surface region of indium(II) chloride and Ag1.0In1.4S2.5(S2.6) (AIS) nanocrystals. Binding energy of the reference substances: InCl3, InCl, and In2O3 are also shown.
In Figure 6a, XPS In 3d spectrum of AIS (Ag1.0In1.4S2.5(S2.6)) nanocrystals is shown. Similar to that in the case of InCl2, only one doublet can be observed, excluding nonequivalence of indium surfacial atoms. It should be noted that Eb values 444.7 eV (In 3d5/2) and 452.2 eV (In 3d3/2) are lower than the corresponding values in InCl2, indicating oxidation of In(II) to In(III). Indeed, Eb measured for In 3d5/2 is in the range reported of ternary Ag–In–S and quaternary Ag–In–Zn–S of different compositions and prepared using In(III)-based precursors (443.5–445.0 eV).62,93−95 Similar shift by ca. 1 eV toward lower Eb values is observed for residual chlorine (ca. 1 wt %) in AIS (Ag1.0In1.4S2.5(S2.6)) nanocrystals (Figure 6b). The determined values are: 198.3 eV (Cl 2p3/2) and 199.9 eV (Cl 2p1/2). Lower Eb values of In 3d5/2 and Cl 2p3/2 measured for these nanocrystals compared to InCl3 and InCl seem to indicate the effect of stoichiometric differentiation of the surface, originating predominantly from the presence of ligands, which significantly lower the hard acid character of In(III). A similar phenomenon was reported for InP nanocrystals.35
In Figure S13 in the Supporting Information, Ag 3d, In 3d, and Zn 2p HR-XPS registered for ternary AIS (Ag1.0In1.4S2.5(S2.6)) as well as quaternary A-1 (Ag1.0In1.5Zn0.3S3.3(S3.0)) and A-4 (Ag1.0In10.3Zn12.4S11.8(S28.3)) nanocrystals. No significant differences can be seen in the measured Eb values: Ag 3d5/2 ∼367 eV, In 3d5/2 ∼444.6 eV, and Zn 2p3/2 ∼1021 eV. They all fall in the range reported for ternary Ag–In–S and quaternary Ag–In–Zn–S nanocrystals.62,93−95
Figure 7 shows the valence band region of the XPS spectra of AIS, A-1, and A-4 nanocrystals. In all three samples, signals at ∼18.1 and ∼5.4 eV can be seen, originating from In 4d + C 2s and Ag 4d orbitals. For nanocrystals containing zinc (A-1 and A-4), an additional peak can be noticed at 10.2 eV, ascribed to the Zn 3d orbital.69,96,97 It should be noted that the onset of the least energetic peak in the spectra of AIS and A-1 is located near ∼0.5 eV whereas in the case of A-4 it is shifted to ∼1.1 eV. This finding is consistent with the differences in their optical band gaps derived from UV–vis–NIR investigation (see Figure S8 in the Supporting Information). AIS and A-1 show similar band gaps (Eg ∼ 2.0 eV), whereas the band gap of A-4 is significantly larger (Eg ∼ 3.2 eV).
Figure 7.
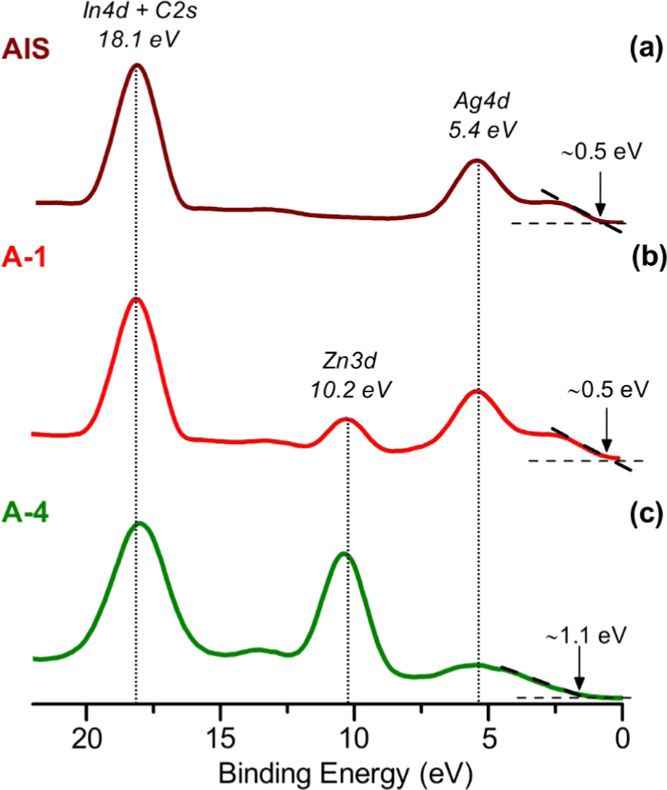
Comparison of the valence bands XPS spectra of Ag1.0In1.4S2.5(S2.6) (AIS), Ag1.0In1.5Zn0.3S3.3(S3.0) (A-1), and Ag1.0In10.3Zn12.4S11.8(S28.3) (A-4) nanocrystals.
S 2p, C 1s, and O 1s HR-XPS studies are especially useful in analyzing binding of ligands to the nanocrystal surface. HR-XPS S 2p spectra of AIS (Ag1.0In1.4S2.5(S2.6)), A-1 (Ag1.0In1.5Zn0.3S3.3(S3.0)) and A-4 (Ag1.0In10.3Zn12.4S11.8(S28.3)) nanocrystals are presented in Figure S14a–c, Supporting Information. Spectra of AIS and A-1 can be deconvoluted to two and three doublets, respectively, indicating certain nonequivalence of surficial sulfur atoms. The dominant doublet at ∼161 eV (S 2p3/2) can be ascribed to the structural (S2–) form of sulfur. The second doublet of weak intensity at 162.9 eV (S 2p3/2) and 162.6 eV (S 2p3/2) in the spectra of AIS and A-1, respectively, should be ascribed to surficial sulfur forming a covalent bond with carbon atoms of the ligand (C–S). This type of covalent bonding may be formed during chemical processes of redox nature occurring in the reaction mixture and accompanying the nanocrystal growth, as demonstrated previously.44,98 In the case of A-1 nanocrystals, an additional doublet can be noticed 166.9 eV (S 2p3/2) corresponding to oxidized forms of surficial sulfur (SOx).44,99
HR-XPS C 1s spectra (see Figure S14d–f) provide information concerning surfacial ligands. The studied nanocrystals of different compositions (AIS, A-1, and A-4) exhibit similar spectral features. The dominant signal at 284.6 eV corresponds to aliphatic carbons of long-chain ligands, whereas signals in the range of 285.2–285.6 eV can be ascribed to these carbon atoms of the ligand, which are located in close vicinity of a functional group. Thus, they can also be attributed to carbons covalently bound to surfacial sulfur atom (C–S) which is consistent with the HR-XPS S 2p spectra (vide supra). In the case of AIS and A-4 nanocrystals, additional signals can be seen at ca. 286 and 288 eV, which originate from the presence of ether (C–O) and carbonyl (C=O) types of carbon.100 O 1s HR-XPS spectra are presented in Figure S15 in the Supporting Information. In the case of AIS nanocrystals, only one signal corresponding to oxygen in organic ligands can be distinguished in the spectral range of 531.7–531.9 eV. Deconvolution of the spectra of A-1 and A-4 gives rise to an additional peak of small intensity at ca. 530 eV which can be ascribed to In2O3.100
NMR techniques applied directly to the identification of organic ligands in colloidal dispersions of the nanocrystals provide very limited information due to significant differences in the relaxation times of different groups of nonequivalent protons. This especially applies to protons of anchor groups, directly bound to the nanocrystal surface, for which partial or total quenching of the proton signals may occur.45,101 Thus, to gain more information on surfacial ligands, in addition to spectra recorded for dispersions of AIS, A-1, and A-4 nanocrystals we registered spectra of organic residue recovered after selective dissolution of the inorganic core. This approach was previously developed in our group and applied to the analysis of nanocrystals of different nature.101,102
In Figure S16 in the Supporting Information, 1H NMR spectra recorded for colloidal dispersions of AIS, A-1, and A-4 nanocrystals in C6D6 are compared with the corresponding spectra of their organic residue collected after the inorganic core dissolution. In the case of AIS (Ag1.0In1.4S2.5(S2.6)) nanocrystals, the 1H NMR spectrum of the colloidal dispersion is very similar to that registered for the organic residue. In both spectra, only signals characteristic of a long-chain alkene can be found, namely, multiplets in the following spectral ranges: 1.98–2.04 ppm (−CH2–CH=), 4.91–5.02 ppm (=CH2), and 5.77–5.85 ppm (−CH=). They undoubtedly originate from the presence of 1-octadecene. Although this compound was used as a solvent, its presence is not associated with incomplete solvent removal. It is formed as a product of the decomposition of nanocrystals stabilizing ligands, according to Scheme 2. This conclusion is supported by the results of our previous studies confirming the presence of ODE in NMR spectra of various nanocrystals such as Ag–In–Zn–S45 or Cu2ZnSnS4102 despite the fact that this compound was not present in the initial reaction mixture. 1H NMR spectra of colloidal dispersions of A-1 and A-4 nanocrystals and their organic residues are distinctly different. In the spectra of the colloidal dispersions, the lines are broadened whereas in the spectra of organic residues clear multiplets can be distinguished, allowing for unequivocal identification of the investigated chemical species. In Figure 8a, 1H NMR spectra of recovered organic residues of AIS, A-1, and A-4 nanocrystals are presented. In the spectrum of the organic part of A-4, in addition to a multiplet at 1.98–2.04 ppm (−CH2–CH=CH2) originating from the presence of ODE, a triplet appears 2.08 ppm (−CH2COOH), which can be ascribed to stearic acid (SA). In the spectral range of 2.16–2.21 ppm, a multiplet is present which can be correlated with the signal at 5.56 ppm (see 1H–1H correlated spectroscopy (COSY) spectrum in Figure 8b), which strictly excludes the presence of thiol. To a first approximation, coupling between these signals might originate from the following segment −CH2–CH=CH–CH2– characteristic of OLA. However, in view of the absence of a signal at 2.52 ppm, which is diagnostic of −CH2– adjacent to −NH2, this possibility has to be excluded. This can be further corroborated by a comparison of the spectrum of colloidal A-4 nanocrystals with that of its organic residue (see Figure S16e,f in the Supporting Information).
Scheme 2. Proposed Reaction Pathways in the Reaction Mixtures Used for the Preparation of Ag–In–S and Ag–In–Zn–S Nanocrystals.

Figure 8.

(a) 1H NMR spectra of the organic residue from Ag1.0In1.4S2.5(S2.6) (AIS), Ag1.0In1.5Zn0.3S3.3(S3.0) (A-1), and Ag1.0In10.3Zn12.4S11.8(S28.3) (A-4) nanocrystals, 1-octadecene (ODE), stearic acid (SA), 1-dodecanethiol (DDT), and oleylamine (OLA) recorded in C6D6, (b) 1H–1H COSY NMR spectrum of the organic residue (in C6D6) from Ag1.0In10.3Zn12.4S11.8(S28.3) (A-4) nanocrystals.
In the spectrum of the colloidal dispersion, a broadened signal at ∼2.2 ppm can be noticed together with another broadened signal at ∼5.62 ppm, the latter being shifted with respect to the corresponding signal in the solution spectrum of the organic residue. This shift can be considered as a spectroscopic manifestation of binding of the ligand to the nanocrystal surface. In the case of OLA bound to the nanocrystal surface, this shift is not observed as the functional group is distant from the binding site. The above short discussion clearly shows that in the course of the nanocrystal synthesis, chemical transformation of ligands may occur, leading to new ligands of different chemical identity. Below, this problem is discussed in detail.
It is known that the dissolution of elemental sulfur in OLA results in a formation of an active precursor of the following chemical formula (C18H35NH3+)(C18H35NH-S8–), which can consecutively be transformed to carboxylic acids and thioacids.103,104 It can therefore be postulated that in the reaction mixture, a thiocarboxylic acid is formed of the formula R-CH2(C=O)SH, which gives rise to a multiplet at 2.21 ppm corresponding to the methylene group (−CH2−) adjacent to the functional group, whereas the broadened signal appearing at 5.56 ppm has to be ascribed to −SH bound to the nanocrystal surface.105 A detailed analysis of the 1H–13C heteronuclear multiple bond correlation (HMBC) NMR spectrum registered for the organic residue of A-4 is presented in Figure S17 in the Supporting Information in view of the unequivocal confirmation of the chemical structure of this thioacid-type ligand. In 1H NMR spectra of all nanocrystals dispersions (AIS, A-1, and A-4), this broadened signal, originating from R-CH2(C=O)SH, is present in the spectral range of 5.00–5.75 ppm (see Figure S16 in the Supporting Information). This can be considered as a proof that the ligand is not a side product of the inorganic core dissolution process but it was formed in situ in the reaction mixture. In the case of AIS and A-1 nanocrystals, the content of this thiocarboxylic acid ligand is rather small, in contrast to A-4 nanocrystals where additional broadened and signals are observed at 3.27 and 7.80 ppm. Strong coupling between these signals suggests the presence of imine-type groupings (−CH2–N=CH−).106 Their formation can be considered as a proof of hydrogenation of DDT and OLA, yielding 1-aminooctadecane, which binds to the nanocrystal surface (C18H17NH–S-crystal). In the inorganic core dissolution process, this ligand is eliminated in a form of ODE. Chemical transformations occurring in the reaction during the nanocrystals growth and stabilization are depicted in Scheme 2. The total absence of signals attributable to DDT and OLA can be considered as an indirect proof of the validity of the proposed transformation mechanism.
XPS and NMR results presented here were almost perfectly complementary. XPS analysis of AIS (Ag1.0In1.4S2.5(S2.0)) clearly indicated the presence of carbonyl groups, despite the fact that compounds containing this group were present in the reaction mixture. Through complementary NMR analysis, it was unequivocally demonstrated that thiocarboxylic acids, i.e., compounds comprising carbonyl groups were formed in the reaction medium through transformation of the precursor of sulfur into these chemical entities. Moreover, these analyses indicated a clear correlation between the nanocrystal’s chemical composition (in particular the content of sulfur) and the presence of a given type of ligands. AIS (Ag1.0In1.4S2.5(S2.0)) and A-1 (Ag1.0In1.5Zn0.3S3.3(S3.0)) nanocrystals, enriched in sulfur as seen from the elemental EDS analysis, could be characterized by an equilibrated surface and were stabilized by crystal-bound C18H17NH–S-crystal ligands. Upon dissolution of the inorganic core these ligands were eliminated in a form of ODE. NMR spectra of organic residues of these nanocrystals revealed only minute amounts of typical coordinating ligands containing thiocarboxylic anchor groups. In the case of A-1, signals ascribed to sulfur of higher oxidation states could also be observed.
Elemental analysis of A-4 (Ag1.0In10.3Zn12.4S11.8(S28.3)) nanocrystals clearly indicated that they were strongly cation-enriched, representing unequilibrated surface. NMR spectra of their organic residues revealed the presence of thiocarboxylates and stearates as ligands bound to indium and zinc, respectively. Although there exist several reports on coordination compounds of indium(III) and thiocarboxylate ligands,107 no indium-containing inorganic nanocrystals capped with thiocarboxylates have been reported to date.
In the case of B-1 (Ag1.0In2.8Zn1.3S4.0(S6.0)) and B-2 (Ag1.0In1.5Zn7.8S17.0(S10.5)), i.e., nanocrystals prepared under the same experimental conditions as A-1 (Ag1.0In1.5Zn0.3S3.3(S3.0)) and A-4 (Ag1.0In10.3Zn12.4S11.8(S28.3)) nanocrystals, respectively, but using less reactive InCl3 precursor instead of the InCl2 one, the NMR analysis revealed two different types of stabilizing ligands. These were stearate anions originating from the precursor of zinc and 1-aminooctadecane ligands being the product of OLA hydrogenation and acting as “crystal-bound” or “surface-bound” ligands.45
To summarize this part of the paper, application of a more reactive indium precursor, namely, InCl2 instead of InCl3, results in the formation of nanocrystals capped with thiocarboxylate anions as ligands. It should be noted here that carboxylate ligands have not been detected in nanocrystals obtained from the InCl3 precursor under the same experimental conditions. Thiocarboxylates are less hard bases than stearate anions which stabilize nanocrystals obtained with InCl3. Surfacial In(III) ions in the resulting Ag–In–Zn–S quaternary nanocrystals constitute an example of less hard acids compared to bulk (macrocrystalline) indium ions. Moreover, the use of this more reactive InCl2 precursor allows for significant extension of the obtainable nanocrystals compositions and, by consequence, facilitates precise tuning of the nanocrystals photoluminescence spectra.
Photocatalytic Activity
In the last few years, several papers appeared devoted to the application of inorganic semiconductors nanocrystals as photocatalyst of many important reactions, mainly the reduction ones108,109 and C–C coupling reactions.110 In the majority of cases, cadmium chalcogenide nanocrystals, including core/shell ones, were used for this purpose.111 The most important drawback of the above-mentioned photocatalysts is their toxicity. However, a few reports of the use of nontoxic nanocrystals, such as core–shell binary InP/ZnS, appeared in the literature.112 It is therefore tempting to verify whether alloyed or nonstoichiometric ternary (Ag–In–S) and quaternary (Ag–In–Zn–S) can be used as photocatalysts. Apart from nontoxicity, the great advantage of this family of nanocrystals is the possibility of tuning their optical properties in a wide spectral range.
In the research described here, AIS (Ag1.0In1.4S2.5(S2.0)) and A-1 (Ag1.0In1.5Zn0.3S3.3(S3.0)) were tested as photocatalysts in aldehyde reduction reactions, following the procedure elaborated previously for CdSe/CdS core/shell nanocrystalline photocatalysts.109 Thiols are frequently used as reducing agents, which readily bind to the nanocrystal surface. Two aldehydes were selected for test reactions, namely, 4-chlorobenzaldehyde and 4-methoxybenzaldehyde. The same reaction set was used in all four cases: CH3COOCs/p-toluenethiol/nanocrystals (AIS or A-1) in benzene-d6. This solvent was purposely used with the goal of monitoring the changes in the reaction mixture by 1H NMR. The catalytic tests were carried out at room temperature using an LED monochromatic source (λ = 528 nm) of 10 W power (see Figure 9a,b).
Figure 9.

(a) Setup for investigation of photocatalytic reactions under 10 W green LED (λ = 528 nm) irradiation, (b) photocatalytic reduction of aldehydes to alcohols, (c) 1H NMR spectra of the photocatalytic reduction reaction mixture used for photocatalytic reduction of 4-chlorobenzaldehyde or 4-methoxybenzaldehyde with AIS (Ag1.0In1.4S2.5(S2.0)) or A-1 (Ag1.0In1.5Zn0.3S3.3(S3.0)) nanocrystals as photocatalysts (in C6D6). All four processes were carried out under the same conditions.
In Figure 9c, 1H NMR spectra of reaction mixtures, exposed to green light irradiation, for 5 h, are compared. For 4-chlorobenzaldehyde and 4-methoxybenzaldehyde, the diagnostic −CHO singlets can be distinguished at 9.55 and 9.79 ppm. Lines at 4.28 and 4.49 ppm correspond, in turn, to methylene protons in the −CH2OH units of the reaction products. The ratio of the integrated intensities of these lines allows for direct determination of the conversion degree. AIS (Ag1.0In1.4S2.5(S2.0)) is a rather inefficient photocatalyst, and the conversion of aldehyde to alcohol is ∼1% for 4-chlorobenzaldehyde. No conversion products were detected in the case of 4-methoxybenzaldehyde.
Significantly higher photocatalytic activity was measured for A-1 (Ag1.0In1.5Zn0.3S3.3(S3.0)). In the reaction of 4-chlorobenzaldehyde reduction, the conversion degree reached 50%, whereas in the case of 4-methoxybenzaldehyde, it was equal to 10%. Thus, these preliminary results confirmed the photocatalytic activity of both types (AIS and A-1) nanocrystals. Moreover, they demonstrated the inactivity of thiols as reducing agents under these experimental conditions. The observed differences in the photocatalytic activity of AIS and A-1 could be rationalized by inspection of their excitation spectra (see Figure 4). The spectrum of AIS (Ag1.0In1.4S2.5(S2.0)) presents a narrow peak with a clear maximum at 625 nm, whereas a broad band, covering the spectral range from 300 to 600 nm and comprising green radiation, can be noticed in the spectrum of A-1 (Ag1.0In1.5Zn0.3S3.3(S3.0)). Finally, a clear substituent effect on the photocatalytic activity should be noted. The presence of an electron accepting substituent (chlorine) in the para position promoted the photocatalytic reduction. On the contrary, electron-donating methoxy substituent in the same position lowered the photocatalytic activity of AIS and A-1 nanocrystals in the same experimental conditions as those reported for CdSe/CdS photocatalysts.109 For comparative reasons, we performed the same catalytic tests using B-1 nanocrystals as photocatalysts and carried out the experiments under identical conditions. It should be noted that the emission spectrum of B-1 nanocrystals was very similar to that measured for A-1. This could imply similar photocatalytic properties. However, no reduction products were detected in this case B-1 sample (see Figure S18, Supporting Information), clearly demonstrating catalytic inactivity of these nanocrystals and advantageous properties of nanocrystals prepared from the InCl2 precursor. Finally, it should be noted that the presented results of photocatalytic studies should be treated as preliminary. Further investigations are needed leading to the optimization of the catalyst composition and reaction conditions.
Conclusions
A new indium precursor, namely, indium(II) chloride in its dimeric form (In2Cl4) turned out to be significantly more reactive in the process of ternary (Ag–In–S) and quaternary (Ag–In–Zn–S) nanocrystals preparation compared to traditionally used indium(III) chloride. For low and moderate concentrations of zinc precursor (zinc stearate), the conversion of the new In2Cl4 precursor was comparable to that of the traditional InCl3 one. For the highest concentrations of zinc stearate, the conversion of the new indium precursor was significantly higher than that of InCl3, indicating different nucleation mechanisms. In the case of low zinc stearate concentrations, AgInS2 germs were formed as a consequence of high reactivities of silver and indium precursors, the resulting nanocrystal were spherical in shape. Increasing concentration of zinc stearate led to the formation of ZnIn2S4 germs and longitudinal quaternary Ag–In–Zn–S nanocrystals in the crystal growth step.
The observed changes in the composition, shape, and size of nanocrystals originated from chemical transformations of the reaction mixture leading to ligands of different chemical nature. Ternary Ag–In–S nanocrystals and quaternary Ag–In–Zn–S nanocrystals of low indium and zinc contents were capped with ligands covalently bound to structural sulfur atoms (C18H17NH–S-crystal), i.e., ligands formed in situ in the reaction mixture as a result of its chemical transformations. Quaternary Ag–In–Zn–S nanocrystals of high indium and zinc contents were capped with thiocarboxylate and stearate anionic ligands bound to indium and zinc cations, respectively. Again, thiocarboxylate ligands were formed as products of the reaction mixture chemical transformations.
Nanocrystals obtained with the highly reactive In2Cl4 indium precursor exhibited interesting photoluminescent properties. First, their photoluminescence color could be controllably tuned in the spectra range from 730 to 530 nm, always exhibiting the PLQY values in the range of 20–40%. Second, for ternary Ag–In–S nanocrystals enriched in indium, the longest, ever reported for this family of compounds photoluminescence lifetime of τav ∼ 9.4 μs, was found. A long photoluminescence lifetime of ∼1.4 μs was also measured for quaternary Ag–In–Zn–S nanocrystals. Finally, quaternary nanocrystals prepared from the InCl2 precursor turned out to be promising photocatalysts in the reaction of aldehydes reduction to alcohols.
Experimental Section
Materials
Silver nitrate (99%), indium(II) chloride (99%) indium(III) chloride (98%), zinc stearate (technical grade), 1-dodecanethiol (DDT, 98%), sulfur (99%), 1-octadecene (ODE, 90%), oleylamine (OLA, 70%), and benzene-d6 (100%, 99.6 atom % D) were supplied by Sigma-Aldrich.
Preparation of the S/OLA Precursor
Sulfur powder (15 mg, 0.47 mmol) and OLA (1.0 mL) were loaded into a glass vial, which was then immersed in an ultrasonic bath. The mixture was sonicated at room temperature (for about 10 min) until a clear red solution was formed.
Preparation of Ag–In–S and Alloyed Ag–In–Zn–S Nanocrystals
All operations were carried out under constant dry argon flow. Silver nitrate (0.03 g, 0.18 mmol), indium(II) chloride (0.11 g, 0.59 mmol), DDT (0.20 g, 1.0 mmol) and zinc stearate (0.11–1.11 g, 0.18–1.8 mmol) were mixed with ODE (15 mL) in three-neck flask. The mixture was heated to 150 °C until a homogeneous solution was formed. Then, 1 mL of S/OLA precursor was quickly injected into the reaction solution. The temperature was increased to 180 °C, and the mixture was kept at this temperature for 60 min. After the mixture was cooled to room temperature, toluene (10 mL) was added, and the reaction mixture was centrifuged—the isolated black precipitate consisting of organic waste and agglomerated particles was separated (however, usually no solids were isolated in this step). The supernatant was treated with 30 mL of acetone, leading to the precipitation of the desired fraction of nanocrystals. The nanocrystals were separated by centrifugation (7000 rpm, 5 min) and then redispersed in toluene (or hexane, chloroform, dichloromethane).
Ligand Recovery
A colloidal solution of nanocrystals (in 10 mL of toluene) and 10 mL of concentrated HCl were placed in a screw-capped ampule, which was vigorously shaken for about 60 min. Next, 20 mL of water was added and the as-obtained mixture was centrifuged (15 000 rpm, 5 min) to achieve phase separation. Solids were discarded. The organic phase was collected, and the aqueous phase was extracted with 10 mL chloroform. The combined organic extracts were washed two times with water, evaporated, and dried under reduced pressure.
Procedures for the Reduction of Aldehyde
To a solution of 4-chlorobenzaldehyde (0.6 mmol, 84 mg) or 4-methoxybenzaldehyde (0.6 mmol, 82 mg), CH3COOCs (0.1 mmol, 20 mg), and p-toluenethiol (3.0 mmol, 372 mg) in benzene-d6 (4 mL) were added Ag1.0In1.4S2.5(S2.0) (AIS) (∼10 mg in 1 mL of benzene-d6) or Ag1.0In1.5Zn0.3S3.3(S3.0) (A-1) (∼10 mg in 1 mL of benzene-d6) nanocrystals. The vial was sealed and purged with argon for 15 min before illumination by a 10 W green LED (λ = 528 nm).
Acknowledgments
This work was supported by the POB Technologie Materiałowe of Warsaw University of Technology within the Excellence Initiative: Research University (IDUP) programme. P.K. and A.P. acknowledge financial support from the National Science Centre of Poland, Grant No. 2019/33/B/ST5/00582. P.K. additionally acknowledges financial support from the Operational Program Knowledge Education Development 2014–2020 co-financed by the European Social Fund, Project No. POWR.03.02.00-00-I007/16-00 (POWER 2014–2020).
Supporting Information Available
The Supporting Information is available free of charge at https://pubs.acs.org/doi/10.1021/acs.chemmater.1c03800.
Characterization methods, photographs of the reaction mixtures, EDS spectra, TEM and HR-TEM images of Ag–In–S and Ag–In–Zn–S nanocrystals, UV–vis–NIR, photoluminescence and decay curves of Ag–In–Zn–S nanocrystals, XPS survey and HR-XPS spectra of indium precursor and Ag–In–S and Ag–In–Zn–S nanocrystals, 1H NMR spectra of C6D6 dispersion of Ag–In–S and Ag–In–Zn–S nanocrystals capped with initial ligands and ligands recovered after dissolution of nanocrystals, 1H–13C HMBC NMR spectrum of the organic residue from Ag–In–Zn–S nanocrystals, detailed comparison of spectroscopic properties of nanocrystals prepared in this research and other ternary and quaternary nanocrystals reported in the literature (PDF)
Author Contributions
P.K. and P.B. designed the concepts. P.K. prepared the samples of nanocrystals. P.K. carried out the catalytic tests. M.P. recorded the NMR spectra. A.M.M. performed the PL and TCSPC experiments. A.O. made the X-ray measurements. A.K. and M.G. made the TEM and HR-TEM measurements. W.L. and J.W.S. measured the XPS spectra. P.K., P.B., and M.P. discussed the results. P.K., P.B., M.P., and A.P. wrote the manuscript.
The authors declare no competing financial interest.
Supplementary Material
References
- Derfus A. M.; Chan W. C. W.; Bhatia S. N. Probing the Cytotoxicity of Semiconductor Quantum Dots. Nano Lett. 2004, 4, 11–18. 10.1021/nl0347334. [DOI] [PMC free article] [PubMed] [Google Scholar]
- Kirchner C.; Liedl T.; Kudera S.; Pellegrino T.; Javier A. M.; Gaub H. E.; Stölzle S.; Fertig N.; Parak W. J. Cytotoxicity of Colloidal CdSe and CdSe/ZnS Nanoparticles. Nano Lett. 2005, 5, 331–338. 10.1021/nl047996m. [DOI] [PubMed] [Google Scholar]
- Ye L.; Yong K.-T.; Liu L.; Roy I.; Hu R.; Zhu J.; Cai H.; Law W.-C.; Liu J.; Wang K.; Liu J.; Liu Y.; Hu Y.; Zhang X.; Swihart M. T.; Prasad P. N. A Pilot Study in Non-Human Primates Shows No Adverse Response to Interavenous Injection of Quantum Dots. Nat. Nanotechnol. 2012, 7, 453–458. 10.1038/nnano.2012.74. [DOI] [PubMed] [Google Scholar]
- Reiss P.; Carrière M.; Lincheneau C.; Vaure L.; Tamang S. Synthesis of Semiconductor Nanocrystals, Focusing on Nontoxic and Earth-Abundant Materials. Chem. Rev. 2016, 116, 10731–10819. 10.1021/acs.chemrev.6b00116. [DOI] [PubMed] [Google Scholar]
- Coughlan C.; Ibáñez M.; Dobrozhan O.; Singh A.; Cabot A.; Ryan K. M. Compound Copper Chalcogenide Nanocrystals. Chem. Rev. 2017, 117, 5865–6109. 10.1021/acs.chemrev.6b00376. [DOI] [PubMed] [Google Scholar]
- Tamang S.; Lincheneau C.; Hermans Y.; Jeong S.; Reiss P. Chemistry of InP Nanocrystals Syntheses. Chem. Mater. 2016, 28, 2491–2506. 10.1021/acs.chemmater.5b05044. [DOI] [Google Scholar]
- Aldakov D.; Lefrançois A.; Reiss P. Ternary and Quaternary Metal Chalcogenide Nanocrystals: Synthesis, Properties and Applications. J. Mater. Chem. C 2013, 1, 3756–3776. 10.1039/c3tc30273c. [DOI] [Google Scholar]
- Bujak P. Core and Surface Engineering in Binary, Ternary and Quaternary Semiconductor Nanocrystals - A Critical Review. Synth. Met. 2016, 222, 93–114. 10.1016/j.synthmet.2016.04.002. [DOI] [Google Scholar]
- Sobiech M.; Bujak P.; Luliński P.; Pron A. Semiconductor Nanocrystals - Polymer Hybrid Nanomaterials and their Application in Molecular Imprinting. Nanoscale 2019, 11, 12030–12074. 10.1039/C9NR02585E. [DOI] [PubMed] [Google Scholar]
- Moodelly D.; Kowalik P.; Bujak P.; Pron A.; Reiss P. Synthesis, Photophysical Properties and Surface Chemistry of Chalcopyrite-Type Semiconductor Nanocrystals. J. Mater. Chem. C 2019, 7, 11665–11709. 10.1039/C9TC03875B. [DOI] [Google Scholar]
- Ko M.; Yoon H. C.; Yoo H.; Oh J. H.; Yang H.; Do Y. R. Highly Efficient Green Zn-Ag-In-S/Zn-In-S/ZnS QDs by a Strong Exothermic Reaction for Down-Converted Green and Tripackage White LEDs. Adv. Funct. Mater. 2017, 27, 1602638 10.1002/adfm.201602638. [DOI] [Google Scholar]
- Ji C.; Lu M.; Wu H.; Zhang X.; Shen X.; Wang X.; Zhang Y.; Wang Y.; Yu W. W. 1,2-Ethanedithiol Treatment for AgIn5S8/ZnS Quantum Dot Light-Emitting Diodes with High Brightness. ACS Appl. Mater. Interfaces 2017, 9, 8187–8193. 10.1021/acsami.6b16238. [DOI] [PubMed] [Google Scholar]
- Zhu B.; Ji W.; Duan Z.; Sheng Y.; Wang T.; Yuan Q.; Zhang H.; Tang X.; Zhang H. Low Turn-on Voltage and Highly Bright Ag-In-Zn-S Quantum Dot Light-Emitting Diodes. J. Mater. Chem. C 2018, 6, 4683–4690. 10.1039/C8TC01022F. [DOI] [Google Scholar]
- Motomura G.; Ogura K.; Kameyama T.; Torimoto T.; Uematsu T.; Kuwabata S.; Tsuzuki T. Efficient Quantum-Dot Light-Emitting Diodes Using ZnS-AgInS2 Solid-Solution Quantum Dots in Combination with Organic Charge-Transport Materials. Appl. Phys. Lett. 2020, 116, 093302 10.1063/1.5143618. [DOI] [Google Scholar]
- Matysiak-Brynda E.; Bujak P.; Augustin E.; Kowalczyk A.; Mazerska Z.; Pron A.; Nowicka A. M. Stable Nanoconjugates of Transferrin with Alloyed Quaternary Nanocrystals Ag-In-Zn-S as a Biological Entity for Tumor Recognition. Nanoscale 2018, 10, 1286–1296. 10.1039/C7NR07819F. [DOI] [PubMed] [Google Scholar]
- Pilch J.; Matysiak-Brynda E.; Kowalczyk A.; Bujak P.; Mazerska Z.; Nowicka A. M.; Augustin E. New Unsymmetrical Bisacridine Derivatives Noncovalently Attached to Quaternary Quantum Dots Improve Cancer Therapy by Enhancing Cytotoxicity toward Cancer Cells and Protecting Normal Cells. ACS Appl. Mater. Interfaces 2020, 12, 17276–17289. 10.1021/acsami.0c02621. [DOI] [PubMed] [Google Scholar]
- Delices A.; Moodelly D.; Hurot C.; Hou Y.; Ling W. L.; Saint-Pierre C.; Gasparutto D.; Nogues G.; Reiss P.; Kheng K. Aqueous Synthesis of DNA-Functionalized Near-Infrared AgInS2/ZnS Core/Shell Quantum Dots. ACS Appl. Mater. Interfaces 2020, 12, 44026–44038. 10.1021/acsami.0c11337. [DOI] [PubMed] [Google Scholar]
- Ruzycka-Ayoush M.; Kowalik P.; Kowalczyk A.; Bujak P.; Nowicka A. M.; Wojewodzka M.; Kruszewski M.; Grudzinski I. P. Quantum Dots as Targeted Doxorubicin Drug Delivery Nanosystems in Human Lung Cancer Cells. Cancer Nanotechnol. 2021, 12, 8 10.1186/s12645-021-00077-9. [DOI] [Google Scholar]
- Pilch J.; Kowalik P.; Bujak P.; Nowicka A. M.; Augustin E. Quantum Dots as a Good Carriers of Unsymmetrical Bisacridines for Modulating Cellular Uptake and the Biological Response in Lung and Colon Cancer Cells. Nanomaterials 2021, 11, 462 10.3390/nano11020462. [DOI] [PMC free article] [PubMed] [Google Scholar]
- Kobosko S. M.; Jara D. H.; Kamat P. V. AgInS2-ZnS Quantum Dots: Excited State Interactions with TiO2 and Photovoltaic Performance. ACS Appl. Mater. Interfaces 2017, 9, 33379–33388. 10.1021/acsami.6b14604. [DOI] [PubMed] [Google Scholar]
- Cai C.; Zhai L.; Ma Y.; Zou C.; Zhang L.; Yang Y.; Huang S. Synthesis of AgInS2 Quantum Dots with Tunable Photoluminescence for Sensitized Solar Cells. J. Power Sources 2017, 341, 11–18. 10.1016/j.jpowsour.2016.11.101. [DOI] [Google Scholar]
- Zhang H.; Fang W.; Zhong Y.; Zhao Q. Zn-Ag-In-S Quantum Dot Sensitized Solar Cells with Enhanced Efficiency by Tuning Defects. J. Colloid Interface Sci. 2019, 547, 267–274. 10.1016/j.jcis.2019.04.006. [DOI] [PubMed] [Google Scholar]
- Torimoto T.; Kamiya Y.; Kameyama T.; Nishi H.; Uematsu T.; Kuwabata S.; Shibayama T. Controlling Shape Anisotropy of ZnS-AgInS2 Solid Solution Nanoparticles for Improving Photocatalytic Activity. ACS Appl. Mater. Interfaces 2016, 8, 27151–27161. 10.1021/acsami.6b10408. [DOI] [PubMed] [Google Scholar]
- Kameyama T.; Koyama S.; Yamamoto T.; Kuwabata S.; Torimoto T. Enhanced Photocatalytic Activity of Zn-Ag-In-S Semiconductor Nanocrystals with a Dumbbell-Shaped Heterostructure. J. Phys. Chem. C 2018, 122, 13705–13715. 10.1021/acs.jpcc.8b00255. [DOI] [Google Scholar]
- Wells R. L.; Pitt C. G.; McPhail A. T.; Purdy A. P.; Shafieezad S.; Hallock R. B. Use of Tris(trimethylsilyl)arsine To Prepare Gallium Arsenide and Indium Arsenide. Chem. Mater. 1989, 1, 4–6. 10.1021/cm00001a002. [DOI] [Google Scholar]
- Mićić O. I.; Curtis C. J.; Jones K. M.; Sprague J. R.; Nozik A. J. Synthesis and Characterization of InP Quantum Dots. J. Phys. Chem. A. 1994, 98, 4966–4969. 10.1021/j100070a004. [DOI] [Google Scholar]
- Battaglia D.; Peng X. Formation of High Quality InP and InAs Nanocrystals in a Noncoordinating Solvent. Nano Lett. 2002, 2, 1027–1030. 10.1021/nl025687v. [DOI] [Google Scholar]
- Tessier M. D.; Dupont D.; De Nolf K.; De Roo J.; Hens Z. Economic and Size-Tunable Synthesis of InP/ZnE (E = S, Se) Colloidal Quantum Dots. Chem. Mater. 2015, 27, 4893–4898. 10.1021/acs.chemmater.5b02138. [DOI] [Google Scholar]
- Raevskaya A.; Lesnyak V.; Haubold D.; Dzhagan V.; Stroyuk O.; Gaponik N.; Zahn D. R. T.; Eychmüller A. A Fine Size Selection of Brightly Luminescent Water-Soluble Ag-In-Zn-S and Ag-In-S/ZnS Quantum Dots. J. Phys. Chem. C 2017, 121, 9032–9042. 10.1021/acs.jpcc.7b00849. [DOI] [Google Scholar]
- Kim J. Y.; Steeves A. H.; Kulik H. J. Harnessing Organic Ligand Libraries for First-Principles Inorganic Discovery: Indium Phosphide Quantum Dot Precursor Design Strategies. Chem. Mater. 2017, 29, 3632–3643. 10.1021/acs.chemmater.7b00472. [DOI] [Google Scholar]
- Chen S.; Ahmadiantehrani M.; Zhao J.; Zhu S.; Mamalis A. G.; Zhu X. Heat-up Synthesis of Ag-In-S and Ag-In-S/ZnS Nanocrystals: Effect of Indium Precursors on their Optical Properties. J. Alloys Compd. 2016, 665, 137–143. 10.1016/j.jallcom.2016.01.035. [DOI] [PMC free article] [PubMed] [Google Scholar]
- Li L.; Protière M.; Reiss P. Economic Synthesis of High Quality InP Nanocrystals Using Calcium Phosphide as the Phosphorus Precursor. Chem. Mater. 2008, 20, 2621–2623. 10.1021/cm7035579. [DOI] [Google Scholar]
- Lucey D. W.; MacRae D. J.; Furis M.; Sahoo Y.; Cartwright A. N.; Prasad P. N. Monodispersed InP Quantum Dots Prepared by Colloidal Chemistry in a Noncoordinating Solvent. Chem. Mater. 2005, 17, 3754–3762. 10.1021/cm050110a. [DOI] [Google Scholar]
- Xu S.; Ziegler J.; Nann T. Rapid Synthesis of Highly Luminescent InP and InP/ZnS Nanocrystals. J. Mater. Chem. 2008, 18, 2653–2656. 10.1039/b803263g. [DOI] [Google Scholar]
- Nag A.; Kovalenko M. V.; Lee J.-S.; Liu W.; Spokoyny B.; Talapin D. V. Metal-free Inorganic Ligands for Colloidal Nanocrystals: S2–, HS–, Se2–, HSe–, Te2–, HTe–, TeS32–, OH–, and NH2– as Surface Ligands. J. Am. Chem. Soc. 2011, 133, 10612–10620. 10.1021/ja2029415. [DOI] [PubMed] [Google Scholar]
- Dai M.; Ogawa S.; Kameyama T.; Okazaki K.-i.; Kudo A.; Kuwabata S.; Tsuboi Y.; Torimoto T. Tunable Photoluminescence from the Visible to Near-Infrared Wavelength Region of Non-Stoichiometric AgInS2 Nanoparticles. J. Mater. Chem. 2012, 22, 12851–12858. 10.1039/c2jm31463k. [DOI] [Google Scholar]
- Hirase A.; Hamanaka Y.; Kuzuya T. Ligand-Induced Luminescence Transformation in AgInS2 Nanoparticles: From Defect Emission to Band-Edge Emission. J. Phys. Chem. Lett. 2020, 11, 3969–3974. 10.1021/acs.jpclett.0c01197. [DOI] [PubMed] [Google Scholar]
- Pardoe J. A. J.; Downs A. J. Development of the Chemistry of Indium in Formal Oxidation States Lower than +3. Chem. Rev. 2007, 107, 2–45. 10.1021/cr068027+. [DOI] [PubMed] [Google Scholar]
- a Downs A. J., Ed. Chemistry of Aluminium, Gallium, Indium and Thallium; Chapman and Hall: Glasgow, U.K., 1993. [Google Scholar]; b Tuck D. G. Gallium and Indium Dihalides: A Classic Structural Problem. Polyhedron 1990, 9, 377. 10.1016/S0277-5387(00)80594-X. [DOI] [Google Scholar]
- Macdonald C. L. B.; Corrente A. M.; Andrews C. G.; Taylor A.; Ellis B. D. Indium(I) Trifluoromethanesulfonate and Other Soluble Salts for Univalent Indium Chemistry. Chem. Commun. 2004, 250–251. 10.1039/b312983g. [DOI] [PubMed] [Google Scholar]
- Andrews C. G.; Macdonald C. L. B. Crown Ether Ligation: An Approach to Low-Oxidation-State Indium Compounds. Angew. Chem., Int. Ed. 2005, 44, 7453–7456. 10.1002/anie.200502901. [DOI] [PubMed] [Google Scholar]
- Ginterseder M.; Franke D.; Perkinson C. F.; Wang L.; Hansen E. C.; Bawendi M. G. Scalable Synthesis of InAs Quantum Dots Mediated through Indium Redox Chemistry. J. Am. Chem. Soc. 2020, 142, 4088–4092. 10.1021/jacs.9b12350. [DOI] [PubMed] [Google Scholar]
- Gabka G.; Bujak P.; Giedyk K.; Ostrowski A.; Malinowska K.; Herbich J.; Golec B.; Wielgus I.; Pron A. A Simple Route to Alloyed Quaternary Nanocrystals Ag-In-Zn-S with Shape and Size Control. Inorg. Chem. 2014, 53, 5002–5012. 10.1021/ic500046m. [DOI] [PubMed] [Google Scholar]
- Gabka G.; Bujak P.; Kotwica K.; Ostrowski A.; Lisowski W.; Sobczak J. W.; Pron A. Luminophores of Tunable Colors from Ternary Ag-In-S and Quaternary Ag-In-Zn-S Nanocrystals Covering the Visible to Near-Infrared Spectral Range. Phys. Chem. Chem. Phys. 2017, 19, 1217–1228. 10.1039/C6CP07008F. [DOI] [PubMed] [Google Scholar]
- Bujak P.; Wróbel Z.; Penkala M.; Kotwica K.; Kmita A.; Gajewska M.; Ostrowski A.; Kowalik P.; Pron A. Highly Luminescent Ag-In-Zn-S Quaternary Nanocrystals: Growth Mechanism and Surface Chemistry Elucidation. Inorg. Chem. 2019, 58, 1358–1370. 10.1021/acs.inorgchem.8b02916. [DOI] [PubMed] [Google Scholar]
- Zhong H.; Bai Z.; Zou B. Tuning the Luminescent Properties of Colloidal I-III-VI Semiconductor Nanocrystals for Optoelectronics and Biotechnology Applications. J. Phys. Chem. Lett. 2012, 3, 3167–3175. 10.1021/jz301345x. [DOI] [PubMed] [Google Scholar]
- Torimoto T.; Kameyama T.; Kuwabata S. Photofunctional Materials Fabricated with Chalcopyrite-Type Semiconductor Nanoparticles Composed of AgInS2 and its Solid Solutions. J. Phys. Chem. Lett. 2014, 5, 336–347. 10.1021/jz402378x. [DOI] [PubMed] [Google Scholar]
- Krustok J.; Raudoja J.; Krunks M.; Mändar H.; Collan H. Nature of the Native Deep Localized Defect Recombination Centers in the Chalcopyrite and Orthorhombic AgInS2. J. Appl. Phys. 2000, 88, 205–209. 10.1063/1.373644. [DOI] [Google Scholar]
- Park Y. J.; Oh J. H.; Han N. S.; Yoon H. C.; Park S. M.; Do Y. R.; Song J. K. Photoluminescence of Band Gap States in AgInS2 Nanopartices. J. Phys. Chem. C 2014, 118, 25677–25683. 10.1021/jp5102253. [DOI] [Google Scholar]
- Koo B.; Patel R. N.; Korgel B. A. Wurtzite-Chalcopyrite Polytypism in CuInS2 Nanodisks. Chem. Mater. 2009, 21, 1962–1966. 10.1021/cm900363w. [DOI] [Google Scholar]
- Tian L.; Elim H. I.; Ji W.; Vittal J. J. One-Pot Synthesis and Third-Order Nonlinear Optical Properties of AgInS2 Nanocrystals. Chem. Commun. 2006, 4276–4278. 10.1039/b607855a. [DOI] [PubMed] [Google Scholar]
- Wang D.; Zheng W.; Hao C.; Peng Q.; Li Y. General Synthesis of I-III-VI2 Ternary Semiconductor Nanocrystals. Chem. Commun. 2008, 2556–2558. 10.1039/b800726h. [DOI] [PubMed] [Google Scholar]
- Feng Z.; Dai P.; Ma X.; Zhan J.; Lin Z. Monodispersed Cation-Disordered Cubic AgInS2 Nanocrystals with Enhanced Fluorescence. Appl. Phys. Lett. 2010, 96, 013104 10.1063/1.3280372. [DOI] [Google Scholar]
- Kowalik P.; Bujak P.; Penkala M.; Pron A. Organic-to-Aqueous Phase Transfer of Alloyed AgInS2-ZnS Nanocrystals Using Simple Hydrophilic Ligands: Comparison of 11-Mercaptoundecanoic Acid, Dihydrolipoic Acid and Cysteine. Nanomaterials 2021, 11, 843 10.3390/nano11040843. [DOI] [PMC free article] [PubMed] [Google Scholar]
- Peng S.; Zhang S.; Mhaisalkar S. G.; Ramakrishna S. Synthesis of AgInS2 Nanocrystal Ink and Its Photoelectrical Application. Phys. Chem. Chem. Phys. 2012, 14, 8523–8529. 10.1039/c2cp40848a. [DOI] [PubMed] [Google Scholar]
- Deng M.; Shen S.; Wang X.; Zhang Y.; Xu H.; Zhang T.; Wang Q. Controlled Synthesis of AgInS2 Nanocrystals and their Application in Organic-Inorganic Hybrid Photodetectors. CrystEngComm 2013, 15, 6443–6447. 10.1039/c3ce40173a. [DOI] [Google Scholar]
- Tang X.; Yu K.; Xu Q.; Choo E. S. G.; Goh G. K. L.; Xue J. Synthesis and Characterization of AgInS2-ZnS Heterodimers with Tunable Photoluminescence. J. Mater. Chem. 2011, 21, 11239–11243. 10.1039/c1jm11346a. [DOI] [Google Scholar]
- Yang X.; Tang Y.; Tan S. T.; Bosman M.; Dong Z.; Leck K. S.; Ji Y.; Demir H. V.; Sun X. W. Facile Synthesis of Luminescent AgInS2-ZnS Solid Solution Nanorods. Small 2013, 9, 2689–2695. 10.1002/smll.201202656. [DOI] [PubMed] [Google Scholar]
- Zhang Q.-H.; Tian Y.; Wang C.-F.; Chen S. Construction of Ag-doped Zn-In-S Quantum Dots Toward White LEDs and 3D Luminescent Patterning. RSC Adv. 2016, 6, 47616–47622. 10.1039/C6RA05689J. [DOI] [Google Scholar]
- Tang X.; Zang Z.; Zu Z.; Chen W.; Liu Y.; Han G.; Lei X.; Liu X.; Du X.; Chen W.; Wang Y.; Xue J. A Facile Method for the Synthesis of Quaternary Ag-In-Zn-S Alloyed Nanorods. Nanoscale 2014, 6, 11803–11809. 10.1039/C4NR03231D. [DOI] [PubMed] [Google Scholar]
- Yang Z.; Chen W.; Zu Z.; Zang Z.; Yang Y.; Tang X. Facile Synthesis and Photoluminescence Characterization of AgInZnS Hollow Nanoparticles. Mater. Lett. 2015, 151, 89–92. 10.1016/j.matlet.2015.03.055. [DOI] [Google Scholar]
- Gao N.; Zhang R.; Chen B.; Zhang J.; Zhang X.; Rogach A. L. Template Synthesis of Silver Indium Sulfide Based Nanocrystals Performed Through Cation Exchange in Organic and Aqueous Media. Nano Res. 2021, 14, 2321–2329. 10.1007/s12274-020-3229-3. [DOI] [Google Scholar]
- Kowalik P.; Penkala M.; Bujak P.; Kmita A.; Gajewska M.; Ostrowski A.; Slodek A.; Pron A. From Ag2S to Luminescent Ag-In-S Nanocrystals via an Ultrasonic Method - an in situ Synthesis Study in an NMR Tube. J. Mater. Chem. C 2020, 8, 8942–8952. 10.1039/D0TC01880E. [DOI] [Google Scholar]
- Ma D.; Wang Z.; Shi J.-W.; Zhu M.; Yu H.; Zou Y.; Lv Y.; Sun G.; Mao S.; Cheng Y. Cu-In2S3 Nanorod Induced the Growth of Cu&In Co-Doped Multi-Arm CdS Hetero-Phase Junction to Promote Photocatalytic H2 Evolution. Chem. Eng. J. 2020, 399, 125785 10.1016/j.cej.2020.125785. [DOI] [Google Scholar]
- Kowalik P.; Mucha S. G.; Matczyszyn K.; Bujak P.; Mazur L. M.; Ostrowski A.; Kmita A.; Gajewska M.; Pron A. Heterogeneity Induced Dual Luminescence Properties of AgInS2 and AgInS2-ZnS Alloyed Nanocrystals. Inorg. Chem. Front. 2021, 8, 3450–3462. 10.1039/D1QI00566A. [DOI] [Google Scholar]
- Shay J. L.; Tell B.; Schiavone L. M.; Kasper H. M.; Thiel F. Energy Bands of AgInS2 in the Chalcopyrite and Orthorhombic Structures. Phys. Rev. B 1974, 9, 1719–1723. 10.1103/PhysRevB.9.1719. [DOI] [Google Scholar]
- Hamanaka Y.; Ogawa T.; Tsuzuki M.; Kuzuya T. Photoluminescence Properties and Its Origin of AgInS2 Quantum Dots with Chalcopyrite Structure. J. Phys. Chem. C 2011, 115, 1786–1792. 10.1021/jp110409q. [DOI] [Google Scholar]
- Mao B.; Chuang C.-H.; Wang J.; Burda C. Synthesis and Photophysical Properties of Ternary I-III-VI AgInS2 Nanocrystals: Intrinsic versus Surface States. J. Phys. Chem. C 2011, 115, 8945–8954. 10.1021/jp2011183. [DOI] [Google Scholar]
- Tsuji I.; Kato H.; Kabayashi H.; Kudo A. Photocatalytic H2 Evolution Reaction from Aqueous Solutions over Band Structure-Controlled (AgIn)xZn2(1-x)S2 Solid Solution Photocatalysts with Visible-Light Response and Their Surface Nanostructures. J. Am. Chem. Soc. 2004, 126, 13406–13413. 10.1021/ja048296m. [DOI] [PubMed] [Google Scholar]
- Pan D.; Weng D.; Wang X.; Xiao Q.; Chen W.; Xu C.; Yang Z.; Lu Y. Alloyed Semiconductor Nanocrystals with Broad Tunable Band Gaps. Chem. Commun. 2009, 4221–4223. 10.1039/b905151a. [DOI] [PubMed] [Google Scholar]
- de Mello Donegá C.; Koole R. Size Dependence of the Spontaneous Emission Rate and Absorption Cross Section of CdSe and CdTe Quantum Dots. J. Phys. Chem. C 2009, 113, 6511–6520. 10.1021/jp811329r. [DOI] [Google Scholar]
- de Mello Donegá C. Formation of Nanoscale Spatially Indirect Excitons. Evolution of the Type-II Optical Character of CdTe/CdSe Heteronanocrystals. Phys. Rev. B: Condens. Matter Mater. Phys. 2010, 81, 165303 10.1103/PhysRevB.81.165303. [DOI] [Google Scholar]
- Pu C.; Qin H.; Gao Y.; Zhou J.; Wang P.; Peng X. Synthetic Control of Exciton Behavior in Colloidal Quantum Dots. J. Am. Chem. Soc. 2017, 139, 3302–3311. 10.1021/jacs.6b11431. [DOI] [PubMed] [Google Scholar]
- Ogawa T.; Kuzuya T.; Hamanaka Y.; Sumiyama K. Synthesis of Ag-In Binary Sulfide Nanoparticles – Structural Tuning and their Photoluminescence Properties. J. Mater. Chem. 2010, 20, 2226–2231. 10.1039/b920732e. [DOI] [Google Scholar]
- Chevallier T.; Le Blevennec G.; Chandezon F. Photoluminescence Properties of AgInS2-ZnS Nanocrystals: The Critical Role of the Surface. Nanoscale 2016, 8, 7612–7620. 10.1039/C5NR07082A. [DOI] [PubMed] [Google Scholar]
- Mao B.; Chuang C.-H.; Lu F.; Sang L.; Zhu J.; Burda C. Study of the Partial Ag-to-Zn Cation Exchange in AgInS2/ZnS Nanocrystals. J. Phys. Chem. C 2013, 117, 648–656. 10.1021/jp309202g. [DOI] [Google Scholar]
- Su D.; Wang L.; Li M.; Mei S.; Wei X.; Dai H.; Hu Z.; Xie F.; Guo R. Highly Luminescent Water-Soluble AgInS2/ZnS Quantum Dots-Hydrogel Composites for Warm White LEDs. J. Alloys Compd. 2020, 824, 153896 10.1016/j.jallcom.2020.153896. [DOI] [Google Scholar]
- Sharma D. K.; Hirata S.; Bujak L.; Biju V.; Kameyama T.; Kishi M.; Torimoto T.; Vacha M. Influence of Zn on the Photoluminescence of Colloidal (AgIn)xZn2(1-x)S2 Nanocrystals. Phys. Chem. Chem. Phys. 2017, 19, 3963–3969. 10.1039/C6CP07550A. [DOI] [PubMed] [Google Scholar]
- Miropoltsev M.; Kuznetsova V.; Tkach A.; Cherevkov S.; Sokolova A.; Osipova V.; Gromova Y.; Baranov M.; Fedorov A.; Gun’ko Y.; Baranov A. FRET-Based Analysis of AgInS2/ZnAgInS/ZnS Quantum Dot Recombination Dynamics. Nanomaterials 2020, 10, 2455 10.3390/nano10122455. [DOI] [PMC free article] [PubMed] [Google Scholar]
- Jara D. H.; Stamplecoskie K. G.; Kamat P. V. Two Distinct Transitions in CuxInS2 Quantum Dots. Bandgap versus Sub-Bandgap Excitations in Copper-Deficient Structures. J. Phys. Chem. Lett. 2016, 7, 1452–1459. 10.1021/acs.jpclett.6b00571. [DOI] [PubMed] [Google Scholar]
- Berends A. C.; Mangnus M. J. J.; Xia C.; Rabouw F. T.; de Mello Donega C. Optoelectronic Properties of Ternary I-III-VI2 Semiconductor Nanocrystals: Bright Prospects with Elusive Origins. J. Phys. Chem. Lett. 2019, 10, 1600–1616. 10.1021/acs.jpclett.8b03653. [DOI] [PMC free article] [PubMed] [Google Scholar]
- Zaffalon M. L.; Pinchetti V.; Camellini A.; Vikulov S.; Capitani C.; Bai B.; Xu M.; Meinardi F.; Zhang J.; Manna L.; Zavelani-Rossi M.; Crooker S. A.; Brovelli S. Intrinsic and Extrinsic Exciton Recombination Pathways in AgInS2 Colloidal Nanocrystals. Energy Mater. Adv. 2021, 1959321 10.34133/2021/1959321. [DOI] [Google Scholar]
- Pinchetti V.; Lorenzon M.; McDaniel H.; Lorenzi R.; Meinardi F.; Klimov V. I.; Brovelli S. Spectro-electrochemical Probing of Intrinsic and Extrinsic Processes in Exciton Recombination in I-III-VI2 Nanocrystals. Nano Lett. 2017, 17, 4508–4517. 10.1021/acs.nanolett.7b02040. [DOI] [PubMed] [Google Scholar]
- Maroń A. M.; Szłapa-Kula A.; Matussek M.; Kruszyński R.; Siwy M.; Janeczek H.; Grzelak J.; Mackowski S.; Schab-Balcerzak E.; Machura B. Photoluminescence Enhancement of Re(I) Carbonyl Complexes Bearing D-A and D-π-A ligands. Dalton Trans. 2020, 49, 4441–4453. 10.1039/C9DT04871E. [DOI] [PubMed] [Google Scholar]
- Nakamura H.; Kato W.; Uehara M.; Nose K.; Omata T.; Otsuka-Yao-Matsuo S.; Miyazaki; Maeda H. Tunable Photoluminescence Wavelength of Chalcopyrite CuInS2-Based Semiconductor Nanocrystals Synthesized in a Colloidal System. Chem. Mater. 2006, 18, 3330–3335. 10.1021/cm0518022. [DOI] [Google Scholar]
- Xiong W.-W.; Yang G.-H.; Wu X.-C.; Zhu J.-J. Microwave-Assisted Synthesis of Highly Luminescent AgInS2/ZnS Nanocrystals for Dynamic Intracellular Cu(II) Detection. J. Mater. Chem. B 2013, 1, 4160–4165. 10.1039/c3tb20638f. [DOI] [PubMed] [Google Scholar]
- Xuan T.-T.; Liu J.-Q.; Yu C.-Y.; Xie R.-J.; Li H.-L. Facile Synthesis of Cadmium-Free Zn-In-S:Ag/ZnS Nanocrystals for Bio-Imaging. Sci. Rep. 2016, 6, 24459 10.1038/srep24459. [DOI] [PMC free article] [PubMed] [Google Scholar]
- Jiao M.; Li Y.; Jia Y.; Li C.; Bian H.; Gao L.; Cai P.; Luo X. Strongly Emitting and Long-Lived Silver Indium Sulfide Quantum Dots for Bioimaging: Insight into co-Ligand Effect on Enhanced Photoluminescence. J. Colloid Interface Sci. 2020, 565, 35–42. 10.1016/j.jcis.2020.01.006. [DOI] [PubMed] [Google Scholar]
- McGuire G. E.; Schweitzer G. K.; Carlson T. A. Study of Core Electron Binding Energies in Some Group IIIa, Vb and VIb Compounds. Inorg. Chem. 1973, 12, 2450–2453. 10.1021/ic50128a045. [DOI] [Google Scholar]
- Freeland B. H.; Habeeb J. J.; Tuck D. G. Coordination Compounds of Indium. Part XXXIII. X-Ray Photoelectron Spectroscopy of Neutral and Anionic Indium Halide Species. Can. J. Chem. 1977, 55, 1527–1532. 10.1139/v77-213. [DOI] [Google Scholar]
- Fan J. C. C.; Goodenough J. B. X-ray Photoemission Spectroscopy Studies of Sn-Doped Indium-Oxide Films. J. Appl. Phys. 1977, 48, 3524–3531. 10.1063/1.324149. [DOI] [Google Scholar]
- Cahen D.; Ireland P. J.; Kazmerski L. L.; Thiel F. A. X-ray Photoelectron and Auger Electron Spectroscopic Analysis of Surface Treatments and Electrochemical Decomposition of CuInSe2 Photoelectrodes. J. Appl. Phys. 1985, 57, 4761–4771. 10.1063/1.335341. [DOI] [Google Scholar]
- Li X.; Niu J.; Shen H.; Xu W.; Wang H.; Li L. S. Shape Controlled Synthesis of Tadpole-Like and Heliotrope Seed-Like AgInS2 Nanocrystals. CrystEngComm 2010, 12, 4410–4415. 10.1039/c0ce00025f. [DOI] [Google Scholar]
- Zeng B.; Chen F.; Liu Z.; Guan Z.; Li X.; Teng F.; Tang A. Seeded-Mediated Growth of Ternary Ag-In-S and Quaternary Ag-In-Zn-S Nanocrystals from Binary Ag2S Seeds and the Composition-Tunable Optical Properties. J. Mater. Chem. C 2019, 7, 1307–1315. 10.1039/C8TC05755A. [DOI] [Google Scholar]
- Mrad M.; Chaabane T. B.; Rinnert H.; Lavinia B.; Jasniewski J.; Medjahdi G.; Schneider R. Aqueous Synthesis for Highly Emissive 3-Mercaptopropionic Acid-Capped AIZS Quantum Dots. Inorg. Chem. 2020, 59, 6220–6231. 10.1021/acs.inorgchem.0c00347. [DOI] [PubMed] [Google Scholar]
- Ley L.; Pollak R. A.; McFeely F. R.; Kowalczyk S. P.; Shirley D. A. Total Valence-Band Densities of States of III-V and II-VI Compounds from X-Ray Photoemission Spectroscopy. Phys. Rev. B 1974, 9, 600–621. 10.1103/PhysRevB.9.600. [DOI] [Google Scholar]
- Nelson A. J.; Gebhard S.; Kazmerski L. L.; Colavita E.; Engelhardt M.; Höchst H. Characterization of the Native Oxide of CuInSe2 Using Synchrotron Radiation Photoemission. Appl. Phys. Lett. 1990, 57, 1428–1430. 10.1063/1.104122. [DOI] [Google Scholar]
- Turo M. J.; Macdonald J. E. Crystal-Bound vs Surface-Bound Thiols on Nanocrystals. ACS Nano 2014, 8, 10205–10213. 10.1021/nn5032164. [DOI] [PubMed] [Google Scholar]
- Konstantatos G.; Levina L.; Fischer A.; Sargent E. H. Engineering the Temporal Response of Photoconductive Photodetectors via Selective Introduction of Surface Trap States. Nano Lett. 2008, 8, 1446–1450. 10.1021/nl080373e. [DOI] [PubMed] [Google Scholar]
- Virieux H.; Le Troedec M.; Cross-Gagneux A.; Ojo W.-S.; Delpech F.; Nayral C.; Martinez H.; Chaudret B. InP/ZnS Nanocrystals: Coupling NMR and XPS for Fine Surface and Interface Description. J. Am. Chem. Soc. 2012, 134, 19701–19708. 10.1021/ja307124m. [DOI] [PubMed] [Google Scholar]
- Gabka G.; Bujak P.; Gryszel M.; Kotwica K.; Pron A. Anchor Groups Effect on Spectroscopic and Electrochemial Properties of Quaternary Nanocrystals Cu-In-Zn-S Capped with Arylamine Derivatives. J. Phys. Chem. C 2015, 119, 9656–9664. 10.1021/acs.jpcc.5b02402. [DOI] [Google Scholar]
- Gabka G.; Bujak P.; Gryszel M.; Ostrowski A.; Malinowska K.; Zukowska G. Z.; Agnese F.; Pron A.; Reiss P. Synthesis and Surface Chemistry of High Quality Wurtzite and Kesterite Cu2ZnSnS4 Nanocrystals Using Tin(II) 2-ethylhexanoate as a New Tin Source. Chem. Commun. 2015, 51, 12985–12988. 10.1039/C5CC04151A. [DOI] [PubMed] [Google Scholar]
- Davis R. E.; Nakshbendi H. F. Sulfur in Amine Solvents. J. Am. Chem. Soc. 1962, 84, 2085–2090. 10.1021/ja00870a017. [DOI] [Google Scholar]
- Thomson J. W.; Nagashima K.; Macdonald P. M.; Ozin G. A. From Sulfur–Amine Solutions to Metal Sulfide Nanocrystals: Peering into the Oleylamine – Sulfur Black Box. J. Am. Chem. Soc. 2011, 133, 5036–5041. 10.1021/ja1109997. [DOI] [PubMed] [Google Scholar]
- Kato S.; Kawahara Y.; Kageyama; Yamada R.; Niyomura O.; Murai T.; Kanda T. Thion (RCSOH), Selenon (RCSeOH), and Telluron (RCTeOH) Acids as Predominant Species. J. Am. Chem. Soc. 1996, 118, 1262–1267. 10.1021/ja953035l. [DOI] [Google Scholar]
- Calcabrini M.; Van den Eynden D.; Ribot S. S.; Pokratath R.; Llorca J.; De Roo J.; Ibáñez M. Ligand Conversion in Nanocrystal Synthesis: The Oxidation of Alkylamines to Fatty Acids by Nitrate. JACS Au 2021, 1, 1898–1903. 10.1021/jacsau.1c00349. [DOI] [PMC free article] [PubMed] [Google Scholar]
- Singh P.; Bhattacharya S.; Gupta V. D.; Nöth H. Structural Studies on Indium and Tin Thiobenzoates. Chem. Ber. 1996, 129, 1093–1098. 10.1002/cber.19961290918. [DOI] [Google Scholar]
- Jensen S. C.; Homan S. B.; Weiss E. A. Photocatalytic Conversion of Nitrobenzene to Aniline through Sequential Proton-Coupled One-Electron Transfer from a Cadmium Sulfide Quantum Dot. J. Am. Chem. Soc. 2016, 138, 1591–1600. 10.1021/jacs.5b11353. [DOI] [PubMed] [Google Scholar]
- Xi Z.-W.; Yang L.; Wang D.-Y.; Feng C.-W.; Qin Y.; Shen Y.-M.; Pu C.; Peng X. Visible Light Induced Reduction and Pinacol Coupling of Aldehydes and Ketones Catalyzed by Core/Shell Quantum Dots. J. Org. Chem. 2021, 86, 2474–2488. 10.1021/acs.joc.0c02627. [DOI] [PubMed] [Google Scholar]
- Caputo J. A.; Frenette L. C.; Zhao N.; Sowers K. L.; Krauss T. D.; Weix D. J. General and Efficient C-C Bond Forming Photoredox Catalysis with Semiconductor Quantum Dots. J. Am. Chem. Soc. 2017, 139, 4250–4253. 10.1021/jacs.6b13379. [DOI] [PubMed] [Google Scholar]
- Wang D.-Y.; Yin Y.-Y.; Feng C.-W.; Shen R.; Shen Y.-M. Advances in Homogeneous Photocatalytic Organic Synthesis with Colloidal Quantum Dots. Catalysts 2021, 11, 275 10.3390/catal11020275. [DOI] [Google Scholar]
- Chakraborty I. N.; Roy S.; Devatha G.; Rao A.; Pillai P. P. InP/ZnS Quantum Dots as Efficient Visible-Light Photocatalysts for Redox and Carbon-Carbon Coupling Reactions. Chem. Mater. 2019, 31, 2258–2262. 10.1021/acs.chemmater.9b00086. [DOI] [Google Scholar]
Associated Data
This section collects any data citations, data availability statements, or supplementary materials included in this article.