

SUMMARY
Acetyl-CoA is a key intermediate situated at the intersection of many metabolic pathways. The reliance of histone acetylation on acetyl-CoA enables the coordination of gene expression with metabolic state. Abundant acetyl-CoA has been linked to the activation of genes involved in cell growth or tumorigenesis through histone acetylation. However, the role of histone acetylation in transcription under low levels of acetyl-CoA remains poorly understood. Here, we use a yeast starvation model to observe the dramatic alteration in the global occupancy of histone acetylation following carbon starvation; the location of histone acetylation marks shifts from growth-promoting genes to gluconeogenic and fat metabolism genes. This reallocation is mediated by both the histone deacetylase Rpd3p and the acetyltransferase Gcn5p, a component of the SAGA transcriptional coactivator. Our findings reveal an unexpected switch in the specificity of histone acetylation to promote pathways that generate acetyl-CoA for oxidation when acetyl-CoA is limiting.
Keywords: glucose starvation, acetyl-CoA, histone acetylation, gluconeogenesis, fat metabolism, transcription, environmental stress response, Gcn5p, SAGA, Rpd3p
eTOC Blurb
Hsieh et al. reveal a substantial alteration in the histone acetylome when acetyl-CoA decreases due to carbon starvation. A major deacetylase releases acetyl groups from histones at growth-promoting genes, which can subsequently be used to acetylate histones at key genes involved in gluconeogenesis and fatty acid oxidation for cell survival.
Graphical Abstract
INTRODUCTION
To safeguard the genome and precisely regulate its expression, eukaryotic cells utilize histones as the core proteins that pack DNA into structural units, enabling its assembly into chromatin (Grunstein, 1990). Histone amino termini (“histone tails”) are subject to an array of posttranslational modifications that may stimulate or antagonize the transcription of genes within chromatin, known as the “histone code” hypothesis (Jenuwein and Allis, 2001; Strahl and Allis, 2000). Although much effort has been put into deciphering each modification, a systematic interpretation of these marks has remained perplexing. Since some metabolites function as donors or cofactors for catalyzing histone modifications, links between metabolism and gene expression have been suggested (Kaochar and Tu, 2012; Reid et al., 2017; Su et al., 2016; Ye and Tu, 2018). One of the most appreciated examples pertains to the coupling of histone acetylation to its donor, acetyl-CoA (Shi and Tu, 2015).
The first correlations between acetyl-CoA and histone acetylation were revealed through perturbation of metabolic enzymes responsible for the synthesis of acetyl-CoA: acetyl-CoA synthetase (Acs2p) in yeast and ATP citrate lyase (Acly) in mammalian cells (Takahashi et al., 2006; Wellen et al., 2009). Deletion of these enzymes showed that changes in nucleo-cytosolic acetyl-CoA levels can influence bulk histone acetylation, leading to apparent changes in transcription. Our lab has also described how acetyl-CoA drives histone acetylation for cell proliferation (Cai et al., 2011); a surge in acetyl-CoA promotes acetylation of histones particularly at growth-promoting genes. This has also been observed in some cancer cells to confer a proliferative advantage (Kurdistani, 2007, 2011; Ropero and Esteller, 2007; Seligson et al., 2005).
Previous studies have mostly focused on the mechanism of histone acetylation in activating gene expression in nutrient-rich conditions. However, the reduced availability of glucose can negatively impact the production of acetyl-CoA and reduce amounts of total histone acetylation (Mariño et al., 2014; Takahashi et al., 2006; Wellen et al., 2009). Yet, it remains unclear the importance of histone acetylation in gene expression when acetyl-CoA is limiting. In this study, we utilize a yeast starvation model to investigate its role in transcriptional regulation under carbon scarcity. Employing next generation sequencing and yeast genetics, we identified the genes that are differentially regulated and determined the enzymes that are involved. Our study demonstrates an underappreciated function of histone acetylation for activation of key genes required for metabolism and survival under starvation conditions.
RESULTS
Glucose availability tunes the level of acetyl-CoA and the amount of histone acetylation on H3
The abundance of intracellular acetyl-CoA alters histone acetylation in a manner that can impact transcription (Cai et al., 2011; Wellen et al., 2009). To further study this connection in Saccharomyces cerevisiae, we subjected cells to acute glucose starvation by removing glucose from cells in the exponential growth phase (Figure 1A). Glucose starvation induced a significant depletion of intracellular acetyl-CoA in as little as five minutes as measured by liquid chromatography-tandem mass spectrometry (LC-MS/MS) (Figure 1B). Concomitantly, we detected gradual decreases in histone acetylation at multiple sites on H3 (K9, K18, K23, K27) (Figure 1C). These decreases were reversed within minutes following glucose replenishment. Unlike H3 acetylation, the amounts of acetylation on H4 (K5, K8, K12) remained constant regardless of glucose availability, suggesting that acetylation sites on H3 were more susceptible to changes in acetyl-CoA levels.
Figure 1. Glucose starvation results in reduced intracellular acetyl-CoA, decreased amounts of bulk H3 acetylation, and redistribution of H3K9ac occupancy.

(A) Experimental setup of glucose starvation model. Cells were grown to log phase in glucose (+D), before switching to medium without glucose (−D). After glucose starvation, glucose was replenished at a final concentration of 2% (−D→+D).
(B) Intracellular acetyl-CoA levels were detected by LC-MS/MS. Two specific daughter fragments for acetyl-CoA (303, 159 Da) were quantified. The data are represented as mean ± SD (n = 3).
(C) Immunoblots of bulk histone acetylation in response to glucose availability. After 60 min of glucose starvation, glucose was added back for another 5 or 30 min.
(D) ChIP-PCR analysis of histone acetylation occupancy at TSS of RPL33B under three conditions: glucose-replete (+D), glucose starvation for 30 min (−D), and glucose replenished for 30 min (−D→+D). All signals were normalized to H3. The data are represented as mean ± SD (n = 3).
(E) ChIP-seq data displaying genomic occupancy of H3K9ac ± 2 kb flanking TSS in two conditions: glucose-replete (+D) and glucose starvation for 30 min (−D). The conditions were the same for all sequencing experiments in this study. Genes shown in rows were sorted in descending order by signal intensity in each condition. The black lines denote a lack of reads that map to certain regions such as telomeres or the ends of chromosomes.
(F) Differential analysis of ChIP-seq data showing genomic occupancy of H3K9ac from panel (E). The whole genome was classified based on the changes in H3K9ac signals upon glucose starvation (-D/+D): decreased (↓, colored in orange), increased (↑, colored in blue) or unchanged (-, colored in grey). Thresholds of 2-fold change (FC) and 0.05 false discovery rate (FDR) were considered significant. The numbers of genes in each category are denoted. In heatmaps, the subset with decreased H3K9ac was ranked by signal intensity from glucose-replete condition. The subsets with increased and unchanged H3K9ac were ranked by signal intensity from glucose starvation condition. Genes shown in each row are the same between two samples.
The accumulation of histone acetylation at ribosomal protein (RP) genes induces their expression (Cai et al., 2011). Therefore, we interrogated how local histone acetylation at an RP gene, RPL33B, affects transcription in a glucose-dependent manner. Through quantitative RT-PCR, we confirmed that expression of RPL33B was positively associated with the presence of glucose (Figure S1A). We then quantitated histone acetylation at RPL33B by chromatin immunoprecipitation (ChIP) analysis. Histone acetylation at RPL33B decreased significantly within 30 minutes of glucose starvation and remained low up to 4 hr (Figure S1B). In addition, the amounts of acetylation on H3, but not H4, fluctuated robustly in response to glucose availability (Figures 1D and S1C), consistent with changes in bulk levels. Taken together, we observed that the level of acetyl-CoA modulates bulk amounts of histone acetylation on H3 and local amounts at an RP gene. In addition, histone acetylation at an RP gene is positively correlated with its expression.
H3K9ac refocuses to specific regions of the genome during a time when acetyl-CoA is limiting
While most studies have interrogated the role of histone acetylation in glucose-replete conditions, its function during nutritional starvation is less understood. Thus, we aimed to determine genes that may be regulated by histone acetylation under glucose starvation. Since the acetylation marks we examined were all normalized to the same input (H3), we chose the most robust and glucose-responsive mark, H3K9ac, for further investigations (Figure 1D).
To address the impact of glucose starvation on global H3K9ac occupancy, we performed ChIP-sequencing under two conditions: glucose-replete (+D) and glucose starvation for 30 min (−D). Global H3K9ac signals peaked at transcription start sites (TSSs) regardless of conditions (Figure S2A). Interestingly, metagene analysis revealed that the median of genomic H3K9ac signals was much lower in glucose starvation than glucose-replete conditions (Figure S2B). This analysis suggests that most genes have lower amounts of H3K9ac upon glucose starvation, consistent with reduced bulk H3K9ac amounts. We further examined the H3K9ac signals at all TSSs to observe an alteration in the global landscape of H3K9ac upon glucose starvation (Figure 1E). H3K9ac was spread rather evenly at many genes in glucose-replete conditions. However, an obvious preference for H3K9ac emerged under glucose starvation, as seen by more concentrated signals at the top versus mostly blank signals at the bottom of the heatmap. Altogether, these results pointed to a more discrete distribution of H3K9ac following glucose starvation (Figure S2C).
Next, we analyzed differential occupancy of H3K9ac and sorted the genome based on changes upon glucose starvation (Figure 1F). First, we detected 872 genes exhibiting a substantial loss and almost complete disappearance of H3K9ac upon glucose starvation. Expectedly, this group consisted of genes required for growth (Figure S1D, e.g., RP genes) (Cai et al., 2011). The loss of H3K9ac at these genes may contribute to the reduction observed at the bulk level. On the other hand, we identified up to 1112 genes that acquired significant amounts of H3K9ac upon glucose starvation. Intriguingly, the profile of H3K9ac marks at these genes was more prominent compared to those at growth-promoting genes (Figure 1F). This was particularly surprising because this group somehow attained histone acetylation while the substrate acetyl-CoA was at a lower level (Figure 1B). Lastly, we found that up to 60% of the genome remained unchanged in H3K9ac signals regardless of glucose availability. This group of genes harbored a basal amount of H3K9ac, compared to growth-promoting genes under glucose starvation (Figure 1F). Altogether, these results present an unexpected refocusing of H3K9ac induced by glucose starvation, when intracellular acetyl-CoA is less abundant.
H3K9ac shifts from growth-promoting genes to genes involved in coping with glucose starvation, in line with transcriptome rewiring
Since histone acetylation on H3 is highly associated with active transcription (Grunstein, 1997; Struhl, 1998), its responsiveness to glucose availability suggests alterations to the transcriptome. To this end, we performed RNA-sequencing under glucose-replete or glucose starvation conditions (Figure 2A). Comparing the results from RNA-seq and ChIP-seq experiments, we found that the majority of genes have a positive correlation between the transcriptome and H3K9ac signals under both conditions (Figure 2B), suggesting H3K9ac plays a role in gene activation even upon glucose starvation.
Figure 2. H3K9ac and transcriptome changes are highly correlated under both glucose-replete and glucose starvation conditions.

(A) Volcano plot of RNA-seq showing differentially expressed genes in WT cells upon glucose starvation (-D/+D). Thresholds of 2-FC and 0.05 FDR were considered significant. We referenced the clusters of genes reported to be associated with growth rate (Brauer et al., 2008). Genes that are positively correlated with growth rate are colored in orange; genes that are negatively correlated with growth rate are in blue.
(B) Scatter plot depicting differential regulation upon glucose starvation from RNA-seq (y-axis) and H3K9ac ChIP-seq (x-axis) data. Orange dots denote genes repressed in both mRNA and H3K9ac; blue dots denote genes induced in both mRNA and H3K9ac. Black dots indicate significant genes that did not have positive correlation between changes in transcript levels and H3K9ac occupancy.
(C) Venn diagram depicting the number of differentially regulated genes with overlap between RNA-seq and H3K9ac ChIP-seq. Arrows depict the transcripts that were independent of H3K9ac. The amount of genes exhibiting changes in H3K9ac is likely an overestimate due to the peak calling algorithm and short intergenic regions in the yeast genome, as reads overlapping multiple genes were not discarded and assigned to multiple genes (see STAR METHODS).
To elucidate the connection between the transcriptome and histone acetylation upon glucose starvation, we examined H3K9ac occupancy at the differentially expressed transcripts: down-regulated genes (specified as growth-promoting genes) or up-regulated genes (specified as starvation-induced genes). As expected, we found H3K9ac marks were attenuated at all growth-promoting genes upon the deprivation of glucose (Figure 3A). Instead, H3K9ac marks were enriched at some starvation-induced genes. Intriguingly, not all starvation-induced genes behaved similarly with respect to accumulation of histone acetylation. While 75% (603/808) of growth-promoting genes exhibited similar changes in mRNA expression and H3K9ac marks, 60% (464/778) of starvation-induced transcripts exhibited this property (Figure 2C). This analysis yielded a subset of starvation-induced transcripts that were independent of H3K9ac (Figure 3D, e.g., HXT7, ATO3). We found no particular pathways enriched in this subset. Nonetheless, these results pointed to alternative transcriptional regulatory mechanisms under glucose starvation.
Figure 3. H3K9ac is enriched at the TSSs of genes required for gluconeogenesis and fat metabolism upon glucose starvation.

(A) ChIP-seq data displaying H3K9ac occupancy at two subsets of genes: growth-promoting genes (transcripts down-regulated upon starvation) and starvation-induced genes (transcripts up-regulated upon starvation). Metagene profile shows the average H3K9ac signal at either subset: growth-promoting genes in orange; starvation-induced genes in blue. Growth-promoting genes in heatmaps were ranked by signal intensity from glucose-replete condition (+D), while starvation-induced genes were ranked by signal intensity from glucose starvation (−D). Genes shown in rows are the same between samples.
(B) Gene ontology (GO) analysis of enriched biological processes for starvation-induced genes with most increased H3K9ac occupancy upon glucose starvation. See also Table S1.
(C) Consolidated enriched biological processes derived from GO analysis presenting major routes of carbon metabolic pathways in yeast under glucose starvation. Genes highlighted in blue were highly induced both in mRNA levels and H3K9ac signals upon glucose starvation.
(D) Genome browser view showing H3K9ac occupancy (in black) and mRNA levels (in pink) at starvation-induced genes under glucose-replete (+D) or glucose starvation (−D) conditions. The divergence of two subsets were differentiated based on the dependence on H3K9ac. H3K9ac-dependent genes involved in gluconeogenic and fat metabolism are shown in blue; H3K9ac-independent genes in black. Arrowheads indicate peaks of H3K9ac that reside at the TSS of genes of interest.
(E) ChIP-PCR analysis of histone acetylation occupancy at TSS of CAT2 under three conditions: glucose-replete (+D), glucose starvation for 30 min (−D), and glucose replenished for 30 min (−D→+D). All signals were normalized to H3. The data are represented as mean ± SD (n = 3).
It seemed counterintuitive for cells to employ histone acetylation for gene activation during a time when the substrate, acetyl-CoA, is scarce. Thus, we categorized such genes by ranking starvation-induced genes by most increased H3K9ac signals and performing PANTHER gene ontology analysis (Figure 3B). Among biological processes, carbon metabolic pathways were significantly enriched: maltose metabolic process, disaccharide catabolic process, glycogen biosynthetic process, carbohydrate transport, and fatty acid β-oxidation. To elucidate the logic of genes induced by H3K9ac in the context of carbon metabolism, we scrutinized our list (Table S1) and discuss them below (Figure 3C).
H3K9ac preferentially activates genes required for gluconeogenesis and fat metabolism under glucose starvation
When yeast cells are deprived of the preferred carbon source, glucose, they reprogram their metabolism to scavenge alternative sources. For instance, cells up-regulate transporters that promote uptake of carbohydrate sugars (GAL2, MAL1, MAL31, HXT5). They also break down trehalose and maltose to generate two equivalents of glucose (ATH1, MAL33, IMA2). In addition, they catabolize alternative carbon sources such as glycerol, acetate, and ethanol (GUT1 and GUT2, glycerol kinases for metabolism of glycerol; ACS1, an enzyme that converts acetate to acetyl-CoA for utilization of acetate and ethanol). Moreover, glycogen biosynthetic processes also supply an additional carbohydrate pool (e.g., GDB1, UGP1, GLG1, GSY1, GSY2, GLC3). Interestingly, the aforementioned genes were all highly modified by H3K9ac upon glucose starvation (Figure 3C). Ultimately, these alternative carbon sources feed into gluconeogenesis in order to synthesize G-6-P to compensate for the loss of glucose. We found that genes encoding rate-limiting enzymes in gluconeogenesis, such as PCK1 (phosphoenolpyruvate carboxykinase) and FBP1 (fructose 1,6-bisphosphatase), also showed significantly increased occupancy of H3K9ac following carbon starvation, which matched a robust increase in their mRNA expression.
In addition, fatty acid oxidation (FAO) scored as one of the enriched pathways on our list (Figure 3B). FAO is one of the major processes producing acetyl-CoA in the absence of glucose. In yeast, fatty acids undergo rounds of oxidation in peroxisomes until they are catabolized to acetyl-CoA (FAA2, POX1, FOX2, POT1, key enzymes for each step of FAO; DCI1, ECI1, SPS19 are auxiliary enzymes) (Figure S3A). Acetyl-CoA is then transported into mitochondria via the carnitine shuttle (CAT2, carnitine acetyl-transferase; CRC1, the carnitine transporter) for further oxidation via the TCA cycle. All the above genes exhibited significant peaks of H3K9ac upon glucose starvation.
By piecing together the functions of genes induced by H3K9ac upon glucose deprivation, we found them to be required for either gluconeogenic processes or producing acetyl-CoA through fat metabolism (Figure 3C and Table S1). Interestingly, by manually validating H3K9ac occupancy at these genes, we also noted some closely related paralogs with strikingly differential regulation by H3K9ac (Figure 3D, HXT5 vs. HXT7 for potentially different roles as glucose transporters). In addition to H3K9ac, we also assessed other histone acetylation marks at a representative gene, CAT2. All the acetylation sites on H3, but not H4, peaked at the TSS of CAT2 (Figure S3D) and appeared to robustly respond to glucose availability (Figures 3E and S3D), consistent with changes in its transcript amounts (Figure S3B). Interestingly, H3K9ac accumulated at CAT2 even up to 2 hr following glucose starvation (Figure S3C). Given that histone acetylation can have short half-times (Waterborg, 2002), it is surprising to observe such sustainability of histone acetylation under glucose starvation. Consistently, the protein levels of these candidate genes increased as a function of glucose starvation time (Figure S3E). Taken together, our data revealed that H3K9ac specifically focuses onto gluconeogenic and fat metabolism genes under glucose starvation, in concert with their transcriptional induction.
The histone acetyltransferase Gcn5p is required for the induction of gluconeogenic and fat metabolism genes
To elucidate whether the accumulation of H3 acetylation at gluconeogenic and fat metabolism genes was required for their transcriptional induction, we next investigated the responsible histone acetyltransferase (HAT). Gcn5p specifically acetylates lysines on H3 (Grant et al., 1997; Kuo et al., 1996; Roth et al., 2001; Sterner and Berger, 2000). We generated a gcn5Δ strain and observed substantial loss of bulk H3 acetylation in all conditions (Figure 4A). Correspondingly, genomic occupancy of H3K9ac appeared to be diminished at all genes in gcn5Δ cells (Figure 4B). Notably, H3K9ac was nearly absent at the gluconeogenic and fat metabolism genes in gcn5Δ cells upon glucose starvation (Figures 4C and S4A).
Figure 4. gcn5Δ cells lose H3 acetylation and exhibit impaired induction of gluconeogenic and fat metabolism genes upon glucose starvation.

(A) Immunoblots of bulk histone acetylation in WT and gcn5Δ cells following glucose starvation. Note that gcn5Δ cells exhibited a delayed loss in H4 acetylation, which could be due to cooperative interactions with other H4 HATs (Li and Shogren-Knaak, 2009).
(B) ChIP-seq data displaying genomic occupancy of H3K9ac in WT and gcn5Δ cells in glucose-replete (+D) or glucose starvation (−D) conditions. For each condition, genes were ranked in the order of decreasing signals in WT cells. Genes shown in rows are the same between WT and gcn5Δ cells.
(C) Volcano plot of ChIP-seq data showing the differential occupancy of H3K9ac in gcn5Δ cells compared to WT cells. Thresholds of 2-FC and 0.05 FDR were considered significant. Gluconeogenic and fat metabolism genes are colored blue. Ribosomal protein genes are colored orange.
(D) Volcano plot of RNA-seq data showing differential gene expression in gcn5Δ cells compared to WT cells in glucose-replete (+D) or glucose starvation (−D) conditions. Thresholds of 2-FC and 0.05 FDR were considered significant. Gluconeogenic and fat metabolism genes are colored in blue.
(E) Venn diagrams showing the numbers of genes induced by glucose starvation in WT cells (starvation-induced transcripts) or repressed in gcn5Δ cells under glucose starvation.
Given this prominent role for Gcn5p in the global H3 acetylome, we tested how the transcriptome was affected in gcn5Δ cells. Despite the reduction in global H3K9ac in gcn5Δ cells, few genes (n=95) were significantly down-regulated under glucose-replete conditions (Figure 4D). Among the genes repressed in gcn5Δ cells, growth-promoting genes, such as RP genes, were most affected (Figure S4B). By contrast, up to 1381 genes showed reduced expression in gcn5Δ cells under glucose starvation conditions (Figure 4D). Pathway analysis further presented peroxisomal genes to be the most significantly enriched in the down-regulated group (Figure S4B), consistent with the observation of gluconeogenic and fat metabolism genes being the most H3K9ac-dependent genes. Moreover, such aberrant regulation in the gcn5Δ mutant further resulted in lower expression and activity of key enzymes for gluconeogenesis and fat metabolism (Figures S7C and S7D), which ultimately led to its failure to grow on non-fermentable carbon sources that require gluconeogenesis and fatty acid oxidation (Figure 7A).
Figure 7. Rpd3p and SAGA are required for proper H3K9ac refocusing onto gluconeogenic and fat metabolism genes following glucose starvation.

(A) Cells of the indicated genotypes were grown in either glucose-replete (+D) or glucose starvation conditions for 2 hr (−D) prior to spotting on plates containing the indicated carbon sources: glucose (SD), ethanol (SE), glycerol (SG), and oleate (STYO). Note that gcn5Δ cells exhibited a severe growth defect on all carbon sources, consistent with its role in activating expression of either growth-promoting genes (glucose) or gluconeogenic/fat metabolism genes (-glucose), while rpd3Δ cells exhibited normal growth on glucose, but slower growth on both ethanol and oleate, consistent with reduced expression of gluconeogenesis and fat metabolism genes in this mutant.
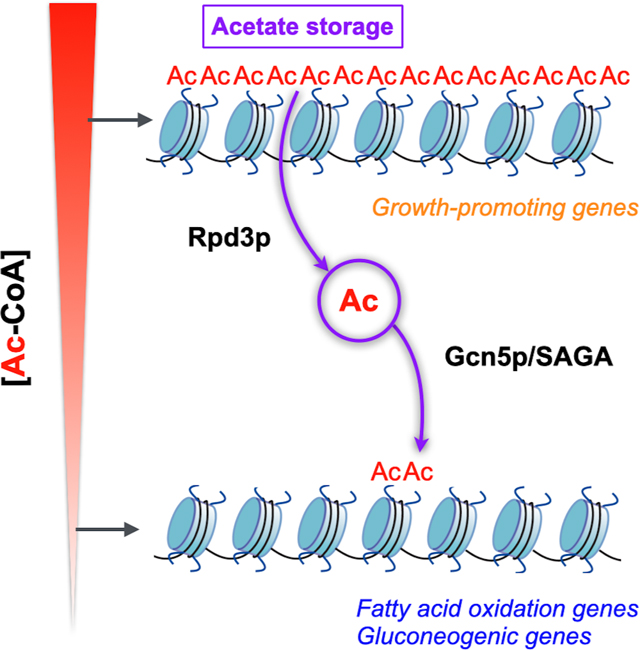
(B) Graphic model depicting the reallocation of histone acetylation marks following glucose starvation. Acetyl groups (red circles) can conjugate with CoA as acetyl-CoA (Ac-CoA), decorate histone tails as histone acetylation, or be released from histone tails as free acetate. In glucose-replete conditions (D), ample amounts of acetyl-CoA enable the Gcn5p-containing SAGA complex to target growth-promoting genes, acetylate histones on H3, and activate gene expression that promotes cell growth. Upon glucose starvation (−D), Rpd3p deacetylates growth-promoting genes, releasing acetate. The free acetate may be recycled in the form of acetyl-CoA for subsequent histone acetylation. Instead of growth-promoting genes, SAGA now switches its targets to genes required for gluconeogenesis and fat metabolism, in coordination with starvation-specific TFs. The expression of these genes promotes peroxisomal activity, fat metabolism and the subsequent production of acetyl-CoA.
Gcn5p is the catalytic subunit of the HAT in the SAGA (Spt-Ada-Gcn5-Acetyltransferase) transcriptional coactivator complex. We found that loss of Gcn5p diminished histone acetylation globally (Figure 4B), consistent with prior studies showing SAGA targets all categories of genes (Baptista et al., 2017; Bonnet et al., 2014). In contrast, SAGA was also reported to regulate stress-related genes (Huisinga and Pugh, 2004). Accordingly, we observed up to 85% (651/651+116) of the starvation-induced genes were repressed in gcn5Δ cells under glucose starvation (Figure 4E). Consequently, we also observed a severe growth defect of gcn5Δ cells on all carbon sources (Figure 7A). Altogether, we demonstrated that Gcn5p was required for the switch in the histone acetylome (Figures S7A and S7B) and proper transcriptome rewiring (Figure S4C) upon glucose starvation. In addition, our findings may reconcile seemingly inconsistent reports that SAGA functions as both a “general” and “stress-responsive” coactivator – it regulates a variety of gene regulons specifically in tune with cellular metabolic state.
SAGA locates to gluconeogenic and fat metabolism genes upon glucose starvation
Having observed differential occupancy of H3K9ac upon glucose starvation, we also investigated if SAGA occupancy tracks accordingly. We confirmed that either the scaffolding subunit Spt7p or Gcn5p was able to capture the intact SAGA complex by immunoprecipitation (Figure S5A). No changes were found in the composition or the amounts of SAGA subunits upon glucose starvation. Thus, we performed ChIP-seq to determine the genome-wide locations of SAGA. In agreement with previous studies, the peak summit of SAGA averaged ~300 bp upstream of TSS (Baptista et al., 2017; Venters et al., 2011) (Figure 5A). SAGA occupancy generally coincided with the reallocation of observed H3K9ac upon glucose starvation (Figures S5B and S5C). By analyzing the differential binding, we observed that SAGA was mostly bound to growth-promoting genes under glucose-replete conditions, but readily relocated to gluconeogenic and fat metabolism genes upon glucose starvation (Figures 5A and 5B). The average binding of SAGA appeared to be much stronger under glucose starvation (Figure 5A), consistent with the trend of H3K9ac occupancy. We further verified at genes of interest that the binding of SAGA nicely corresponded to H3K9ac peaks that were Gcn5p-dependent in response to glucose availability (Figure 5C). Therefore, SAGA binds to either growth-promoting genes or gluconeogenic and fat metabolism genes depending on glucose availability.
Figure 5. SAGA binds to different groups of genes and transcription factors depending on glucose availability.

(A) ChIP-seq data displaying SAGA occupancy (assessed by Gcn5p-HA) at two subsets of genes upon glucose starvation. Metagene profile shows the average signal of SAGA binding at either subset: growth-promoting genes in orange; starvation-induced genes in blue. Growth-promoting genes in heatmaps were ranked by signal intensity from glucose-replete condition (+D), while starvation-induced genes were ranked by signal intensity from glucose starvation (−D).Genes shown in rows are the same between two conditions.
(B) Volcano plot of SAGA ChIP-seq depicting the differential binding of SAGA in cells upon glucose starvation. Thresholds of 2-FC and 0.05 FDR were considered significant. Ribosomal protein genes are colored in orange. Gluconeogenic and fat metabolism genes are colored in blue.
(C) Genome browser view showing co-occupancy of SAGA and H3K9ac at growth-promoting genes (orange) or gluconeogenic and fat metabolism genes (blue). Orange and blue arrowheads indicate the peaks of H3K9ac that reside at the TSS of the genes of interest. Black arrowhead indicates an H3K9ac peak independent of Gcn5p/SAGA.
(D) Interaction of SAGA with different transcription factors (TFs) in glucose-replete (+D) or glucose-starvation conditions (−D). Endogenously Flag-tagged Spt7p was used to immunoprecipitate the SAGA complex. Co-immunoprecipitation of HA-tagged TFs were detected by immunoblotting. Empty arrowheads indicate the interaction between SAGA and growth-specific TFs (orange). Solid arrowheads indicate the interaction between SAGA and starvation-specific TFs (blue).
SAGA cooperatively interacts with distinct sets of transcription factors in response to glucose starvation
Since transcriptional coactivators coordinate with transcription factors (TFs) to promote transcription, we asked if any TFs might associate differentially with SAGA in a glucose-dependent manner. We first examined Ifh1p and Fhl1p since they are TFs known to regulate the ribosomal protein (RP) genes. Ifh1p is also a substrate of Gcn5p, as acetylation activates its recruitment to RP genes (Cai et al., 2013; Downey et al., 2013). We immunoprecipitated SAGA and observed increased interaction with both Ifh1p and Fhl1p in glucose-replete compared to glucose starvation conditions (Figure 5D). These interactions likely accounted for the full expression of the RP genes.
Next, we assessed whether any starvation-specific TFs might differentially associate with SAGA. We first queried the set of H3K9ac up-regulated genes for common upstream activating sequences via CentriMo, a tool for local motif enrichment analysis (Bailey and Machanick, 2012). Using yeast-specific databases, this analysis yielded a handful of transcription factors as potential regulators of H3K9ac-dependent genes (Table S2 and Figure S5D). We then chose TFs from these lists known to regulate either peroxisomal or glucose-repressed genes (Hahn and Young, 2011; Kayikci and Nielsen, 2015).
Adr1p scored as a top hit from our motif enrichment analysis (Figure S5D), and is required for the expression of peroxisomal genes and other targets involved in alternative carbon source utilization (Simon et al., 1991). We observed that Adr1p interacted strongly with SAGA, specifically under glucose starvation (Figure 5D). Moreover, we found a consistent and robust starvation-specific interaction of SAGA with Cat8p, a TF known to be active following the diauxic shift (Young et al., 2003). Despite lower amounts of Adr1p and Cat8p, their interaction with SAGA appeared more pronounced than that of Ifh1p or Fhl1p. Lastly, we examined Oaf1p and Pip2p, which form a heterodimeric complex that binds to promoters of genes involved in FAO and peroxisomal biogenesis (Karpichev and Small, 1998; Luo et al., 1996). Higher amounts of both Oaf1p and Pip2p co-immunoprecipitated with SAGA under glucose starvation (Figure 5D). In addition, we verified that both Adr1p and Oaf1p located to a target gene, POX1, specifically under glucose starvation, consistent with a glucose starvation-specific interaction between SAGA and Adr1p/Oaf1p (Figure S5E). Altogether, we observed an increase in the association of starvation-specific TFs with SAGA, which was sensible given the higher occupancy of H3K9ac and SAGA at gluconeogenic and fat metabolism genes (Figures 3A and 5A). These experiments suggest that SAGA can readily associate with appropriate TFs for transcriptome rewiring in response to glucose availability.
The histone deacetylase Rpd3p is required for starvation-induced switch in the histone acetylomes and transcriptomes
Since the dynamic reallocation of H3K9ac may involve histone deacetylation, we assessed a possible role for histone deacetylases (HDACs). We found Rpd3p of interest not only because it is the major HDAC for H3 in yeast (Yang and Seto, 2008), but also because it regulates quiescence entry through the deacetylation of growth-promoting genes (McKnight et al., 2015). Cells lacking Rpd3p showed an increase in the amount of bulk H3 acetylation especially following glucose starvation (Figure 6A). Consistent with the specificity of Rpd3p for H3, the abundance of H4 acetylation remained unchanged in rpd3Δ cells.
Figure 6. rpd3Δ cells exhibit a retention of H3K9ac at growth-promoting genes and a reduction of H3K9ac at gluconeogenic and fat metabolism genes during glucose starvation.

(A) Immunoblots of bulk histone acetylation in WT and rpd3Δ cells upon glucose starvation.
(B) ChIP-seq data displaying genomic occupancy of H3K9ac in WT and rpd3Δ cells under glucose-replete (+D) or glucose starvation (−D) conditions. For each condition, genes were ranked in the order of decreasing signals in WT cells. Genes shown in rows are the same between WT and rpd3Δ cells.
(C) ChIP-seq data displaying H3K9ac occupancy at two subsets of genes in WT and rpd3Δ cells under glucose starvation condition. Metagene profile shows the average H3K9ac signal from each subset of genes: orange line denotes growth-promoting genes; blue line denotes starvation-induced genes. Growth-promoting genes in heatmaps were ranked by signal intensity from glucose-replete condition (+D), while starvation-induced genes were ranked by signal intensity from glucose starvation (−D). Genes shown in rows are the same among all samples.
(D) Volcano plot of ChIP-seq data showing differential occupancy of H3K9ac in rpd3Δ cells compared with WT cells. Thresholds of 2-FC and 0.05 FDR were considered significant. Ribosomal protein genes are colored orange. Gluconeogenic and fat metabolism genes are colored blue.
Next, we assessed the genomic distribution of H3K9ac in rpd3Δ cells (Figure 6B). No significant differences were observed under glucose-replete conditions. However, cells lacking Rpd3p failed to reallocate H3K9ac genome-wide under glucose starvation conditions. We then examined possible Rpd3p target genes, such as the growth-promoting genes, in rpd3Δ cells. We found an abnormal retention of H3K9ac at these genes particularly under glucose depletion (Figures 6C and 6D), leading to their transcriptional de-repression (Figures S6A–C). Surprisingly, the accumulation of H3K9ac at gluconeogenic and fat metabolism genes was decreased in rpd3Δ cells under glucose starvation (Figures 6C and 6D), resulting in impeded transcriptional induction (Figures S6A–C). Consistent with these findings, we also observed growth defects of rpd3Δ cells on ethanol and oleate, which are carbon sources that require gluconeogenesis and fat metabolism (Figure 7A).
Collectively, rpd3Δ cells appear to lose responsiveness to glucose availability in both bulk amounts and genomic distribution of H3K9ac (Figures S7A and S7B), leading to compromised transcriptome rewiring (Figure S6D). There appear to be two major roles for Rpd3p upon glucose starvation. Rpd3p preferentially deacetylates the histones at growth-promoting genes for transcriptional repression, but also indirectly facilitates the installation of H3K9ac at gluconeogenic and fat metabolism genes. Our findings suggest an unexpected function of histone deacetylation beyond repression per se: they reveal an interplay between the removal of particular acetyl marks and their subsequent re-deposition.
DISCUSSION
A long-standing question in gene regulation pertains to how yeast cells coordinate massive transcriptome rewiring in response to environmental stresses (Causton et al., 2001; Gasch et al., 2000). The expression of two major clusters of genes are known to be associated with growth rate (Brauer et al., 2008): growth-promoting genes are correlated with high growth rate, while stress response genes are correlated with low growth rate (Figure 2A). To date, the induction of growth-promoting genes through abundant histone acetylation has been illustrated (Cai et al., 2011). However, the mechanism of activation of stress response genes required for cell survival has remained incompletely understood. In this study, we decipher how changes in carbon metabolism are relayed to gene expression through histone acetylation (Figure 7B). By studying glucose starvation conditions, we find that a special subset of stress response genes are preferentially regulated by histone acetylation particularly when acetyl-CoA is limiting. We have elucidated a specific mechanism of transcriptome rewiring driven by reallocation of a key epigenetic mark−H3K9ac.
The metabolic function of histone acetylation under glucose starvation
Glucose starvation induces a shift to respiratory metabolism and the mitochondrial oxidation of acetyl-CoA for ATP synthesis. However, since acetyl-CoA is also required for histone acetylation, cells must coordinate a competing need from both processes. Our findings suggest that cells direct fading amounts of nuclear acetyl-CoA to histones at genes required for gluconeogenic and fat metabolism, setting up the subsequent direction of acetyl-CoA to the mitochondria. It follows that the uncharacterized genes that acquire histone acetylation on our list are likely to have important functions in providing energy under glucose starvation.
A metabolic SAGA
The induction of transcription is known to be regulated by transcription factors and coactivators. However, both our bioinformatics analyses (Figure S5D) and experimental results (Figure 5D) indicated that no particular transcription factor alone can account for the global transcriptome changes following glucose starvation. Importantly, we observe that Gcn5p-containing SAGA differentially targets both growth-promoting genes and stress response genes for their activation, during either glucose-replete or glucose starvation conditions (Figure 4C). Our study implies that it is the coactivator SAGA, together with a variety of transcription factors (Figure 5D), which orchestrates transcriptome rewiring in response to glucose starvation, especially at H3K9ac-dependent genes. It remains unclear what triggers SAGA to locate to these different gene groups. A possibility is that SAGA subunits are regulated by nutrient-responsive posttranslational modifications (PTMs) (Cai et al., 2011), which may confer additional specificity in gene-targeting.
Role of histone deacetylation
Besides de-repression of growth-promoting genes, we observe an unanticipated loss of H3K9ac at gluconeogenic and fat metabolism genes in rpd3Δ cells upon glucose starvation (Figure 6C). One plausible explanation is that Rpd3p could deacetylate non-histone proteins, such as a relevant TF or coactivator (Yang and Seto, 2008). An alternative hypothesis is that the action of deacetylation releases acetyl groups from histones as acetate, thereby enabling the retrieval of acetyl groups for subsequent acetylation. Several studies have suggested the ability of acetate to influence histone acetylation through such a mechanism in both mammalian and yeast cells (Huang et al., 2018; Li et al., 2017; Mews et al., 2017; Takahashi et al., 2006). This could explain why rpd3Δ cells exhibit a reduction, instead of an increase, in histone acetylation at gluconeogenic and fat metabolism genes following glucose starvation. It follows that the genetic or pharmacologic inhibition of HDACs could likewise compromise the induction of fat metabolism genes (Lee et al., 2020; Li et al., 2016).
Conserved regulatory mechanism in mammalian cells?
We recently showed that the expression of fat metabolism genes in the liver is compromised in mice lacking the ACSS2 enzyme, which converts acetate to acetyl-CoA in the nucleus (Huang et al., 2018). These findings would be consistent with a role for acetate released from HDAC-mediated deacetylation in the fasting-induced activation of fatty acid oxidation genes through histone acetylation. More broadly, dysregulation of either acetylation or deacetylation can disrupt the balance of the histone acetylome and impede cell proliferation or survival (Ropero and Esteller, 2007). Although HDAC inhibitors have shown promise in clinical trials against particular cancers (Eckschlager et al., 2017; Li and Seto, 2016; Suraweera et al., 2018; West and Johnstone, 2014), the mechanism of action of HDAC inhibitors in cancer remains unclear. Our findings suggest HDAC inhibitors could also block the release of free acetate that is normally recaptured to acetyl-CoA for proper transcriptome rewiring.
In summary, our findings demonstrate how glucose starvation induces a dynamic transfer of acetyl marks from growth-promoting genes to those involved in coping with carbon starvation. By noting the function of these genes, they are suggestive of a fundamental mechanism whereby the remaining nuclear acetylation potential is used specifically for activation of those genes enabling the subsequent production of acetyl-CoA for oxidation. In fact, carefully examining the location of histone acetylation shows how this epigenetic mark can specify the expression of metabolic regulons needed when acetyl-CoA is either high or low. Lastly, our findings may provide a rationale for targeting the epigenetic reallocation of acetylation marks for malignancies reliant on fat metabolism.
Limitations of the study
We have provided evidence suggesting the refocusing of H3K9ac to specific genes during glucose starvation is concomitant with a reduction in bulk histone acetylation. Since our ChIP-seq experiments did not utilize spike-ins for normalization, we are unable to quantitatively capture differences in global H3K9ac signals in the ChIP-seq data. Most of the histone antibodies used in this study have been extensively evaluated (Rothbart et al., 2015). However, the H3K9ac antibody (Millipore Cat# 06–942) has not been evaluated for cross-reactivity against other marks, despite its widespread use in many published studies. Nonetheless, we observed a significant decrease in H3K9ac in gcn5Δ cells using this antibody, and ChIP-seq experiments yielded selective and sensible increases or decreases in reads mapping to genes known to be regulated by Gcn5p. This antibody also did not detect any signal by Western blot in yeast cells expressing a H3K9R histone point mutant (Figure S7E). Therefore, we believe this H3K9ac antibody is highly specific for H3K9ac.
STAR METHODS
Resource Availability
Lead contact
Further information and requests for resources and reagents should be directed to and will be fulfilled by the lead contact, Benjamin P. Tu (benjamin.tu@utsouthwestern.edu).
Materials availability
Newly generated items are listed in the Key Resources Table in this manuscript. Reagents are available upon request from the lead contact.
Key resources table
| REAGENT or RESOURCE | SOURCE | IDENTIFIER |
|---|---|---|
| Antibodies | ||
| Mouse anti-FLAG M2 antibody | Sigma | Cat#F3165, RRID: AB_259529 |
| Mouse anti-HA(12CA5) | Roche | Cat#11583816001, RRID:AB_514505 |
| Rabbit anti-panH3ac | Millipore | Cat#06–599, RRID:AB_2115283 |
| Rabbit anti-H3K9ac | Millipore | Cat#06–942, RRID:AB_310308 |
| Rabbit anti-H3K18ac | Millipore | Cat#07–354, RRID:AB_441945 |
| Rabbit anti-H3K23ac | Millipore | Cat#07–355, RRID:AB_310546 |
| Rabbit anti-H3K27ac | Millipore | Cat#07–360, RRID:AB_310550 |
| Rabbit anti-H4K5ac | Millipore | Cat#07–327, RRID:AB_11210470 |
| Rabbit anti-H4K8ac | Millipore | Cat#07–328, RRID:AB_11213282 |
| Rabbit anti-H3 | Millipore | Cat#06–755, RRID:AB_2118461 |
| Rabbit anti-G6PDH | Sigma | Cat#A9521, RRID:AB_258454 |
| Rabbit polyclonal anti-Rpn10 antibody | Abcam | Cat#ab98843, RRID:AB_10672806 |
| Bacterial and virus strains | ||
| N/A | ||
| Biological samples | ||
| N/A | ||
| Chemicals, peptides, and recombinant proteins | ||
| N/A | ||
| Critical commercial assays | ||
| cOmplete EDTA-free protease inhibitor cocktail tablets | Roche | Cat#11873580001 |
| Trichostatin A | Sigma | Cat#T1952 |
| NuPAGE 4–12% polyacrylamide Bis-Tris Gels | Life Technologies | Cat#WG1403BX10 |
| NuPAGE 10% polyacrylamide Bis-Tris Gels | Life Technologies | Cat#WG1202BX10 |
| Pierce BCA protein assay | Invitrogen | Cat#23225 |
| Bradford assay | BioRad | Cat#5000006 |
| Dynabeads Protein G | Thermo Fisher Scientific | Cat#1003D |
| QIAquick PCR Purification Kit | Qiagen | Cat#28104 |
| MasterPure yeast RNA purification kit | Epicenter | Cat# MPY03100 |
| Superscript III Reverse Transcriptase | Thermo Fisher Scientific | Cat#18080093 |
| iQ SYBR Green Supermix | BioRad | Cat#1708886 |
| TruSeq RNA Library Preparation Kit v2, Set A | Illumina | RS-122–2001 |
| TruSeq RNA Library Preparation Kit v2, Set B | Illumina | RS-122–2002 |
| KAPA HyperPrep Kit (PCR-free) | Roche | Cat#07962371001 |
| Y-per Yeast Protein Extraction Reagent | Thermo Fisher Scientific | Cat#78991 |
| Fructose-1,6-Bisphosphatase Activity Assay Kit (Colorimetric) | Biovision | Cat#K590 |
| Deposited data | ||
| RNA sequencing data | This paper | GEO: GSE121635 |
| ChIP sequencing data | This paper | GEO: GSE121635 |
| Experimental models: Cell lines | ||
| N/A | ||
| Experimental models: Organisms/strains | ||
| S. cerevisiae: Name = CEN.PK; Genotype = MATa | (van Dijken et al., 2000b) | N/A |
| S. cerevisiae: Name = CEN.PK; Genotype = MATa; gcn5Δ::KanMX | This paper | N/A |
| S. cerevisiae: Name = CEN.PK; Genotype = MATa; rpd3Δ::KanMX | This paper | N/A |
| S. cerevisiae: Name = CEN.PK; Genotype = MATa; GCN5-FLAG::KanMX | This paper | N/A |
| S. cerevisiae: Name = CEN.PK; Genotype = MATa; GCN5-HA::KanMX | This paper | N/A |
| S. cerevisiae: Name = CEN.PK; Genotype = MATa; SPT7-FLAG::KanMX | This paper | N/A |
| S. cerevisiae: Name = CEN.PK; Genotype = MATa; SPT7-HA::KanMX | This paper | N/A |
| S. cerevisiae: Name = CEN.PK; Genotype = MATa; SPT7-FLAG::KanMX IFH1-HA::HYG | This paper | N/A |
| S. cerevisiae: Name = CEN.PK; Genotype = MATa; SPT7-FLAG::KanMX FHL1-HA::HYG | This paper | N/A |
| S. cerevisiae: Name = CEN.PK; Genotype = MATa; SPT7-FLAG::KanMX ADR1-HA::HYG | This paper | N/A |
| S. cerevisiae: Name = CEN.PK; Genotype = MATa; SPT7-FLAG::KanMX CAT8-HA::HYG | This paper | N/A |
| S. cerevisiae: Name = CEN.PK; Genotype = MATa; SPT7-FLAG::KanMX OAF1-HA::HYG | This paper | N/A |
| S. cerevisiae: Name = CEN.PK; Genotype = MATa; SPT7-FLAG::KanMX PIP2-HA::HYG | This paper | N/A |
| S. cerevisiae: Name = CEN.PK; Genotype = MATa; SPT7-FLAG::KanMX rpd3Δ:: HYG | This paper | N/A |
| S. cerevisiae: Name = CEN.PK; Genotype = MATa; SPT7-FLAG::KanMX gcn5Δ:: HYG | This paper | N/A |
| S. cerevisiae: Name = CEN.PK; Genotype = MATa; POX1-FLAG::KanMX | This paper | N/A |
| S. cerevisiae: Name = CEN.PK; Genotype = MATa; POT1-FLAG::KanMX | This paper | N/A |
| S. cerevisiae: Name = CEN.PK; Genotype = MATa; FBP1-FLAG::KanMX | This paper | N/A |
| S. cerevisiae: Name = CEN.PK; Genotype = MATa; POX1-FLAG::KanMX rpd3Δ:: HYG | This paper | N/A |
| S. cerevisiae: Name = CEN.PK; Genotype = MATa; POX1-FLAG::KanMX gcn5Δ:: HYG | This paper | N/A |
| S. cerevisiae: Name = CEN.PK; Genotype = MATa; FBP1-FLAG::KanMX rpd3Δ:: HYG | This paper | N/A |
| S. cerevisiae: Name = CEN.PK; Genotype = MATa; FBP1-FLAG::KanMX gcn5Δ:: HYG | This paper | N/A |
| S. cerevisiae: Name = CEN.PK; Genotype = MATa; fbp1Δ:: KanMX | This paper | N/A |
| S. cerevisiae: Name = CEN.PK; Genotype = MATa; HHT1-HHF1-H3K9R:: HYG, HHT2-HHF2-H3K9R::NatMX | Zheng et al, 2014 | N/A |
| Oligonucleotides | ||
| Primers for qPCR, see Table S2 | This paper | N/A |
| Recombinant DNA | ||
| N/A | ||
| Software and algorithms | ||
| Analyst software package | AB SCIEX | Versions 1.6.2 |
| Image Lab | Bio-Rad | Version 6.0 |
| GraphPad Prism | GraphPad Software | Versions 7 and 9 |
| Integrative Genomics Viewer | Broad Institute | 2.8.0 |
| Other | ||
| N/A | ||
| Antibodies | ||
| Rabbit monoclonal anti-Snail | Cell Signaling Technology | Cat#3879S; RRID: AB_2255011 |
| Mouse monoclonal anti-Tubulin (clone DM1A) | Sigma-Aldrich | Cat#T9026; RRID: AB_477593 |
| Rabbit polyclonal anti-BMAL1 | This paper | N/A |
| Bacterial and virus strains | ||
| pAAV-hSyn-DIO-hM3D(Gq)-mCherry | Krashes et al., 2011 | Addgene AAV5; 44361-AAV5 |
| AAV5-EF1a-DIO-hChR2(H134R)-EYFP | Hope Center Viral Vectors Core | N/A |
| Cowpox virus Brighton Red | BEI Resources | NR-88 |
| Zika-SMGC-1, GENBANK: KX266255 | Isolated from patient (Wang et al., 2016) | N/A |
| Staphylococcus aureus | ATCC | ATCC 29213 |
| Streptococcus pyogenes: M1 serotype strain: strain SF370; M1 GAS | ATCC | ATCC 700294 |
| Biological samples | ||
| Healthy adult BA9 brain tissue | University of Maryland Brain & Tissue Bank; http://medschool.umaryland.edu/btbank/ | Cat#UMB1455 |
| Human hippocampal brain blocks | New York Brain Bank | http://nybb.hs.columbia.edu/ |
| Patient-derived xenografts (PDX) | Children’s Oncology Group Cell Culture and Xenograft Repository | http://cogcell.org/ |
| Chemicals, peptides, and recombinant proteins | ||
| MK-2206 AKT inhibitor | Selleck Chemicals | S1078; CAS: 1032350–13-2 |
| SB-505124 | Sigma-Aldrich | S4696; CAS: 694433–59-5 (free base) |
| Picrotoxin | Sigma-Aldrich | P1675; CAS: 124–87-8 |
| Human TGF-β | R&D | 240-B; GenPept: P01137 |
| Activated S6K1 | Millipore | Cat#14–486 |
| GST-BMAL1 | Novus | Cat#H00000406-P01 |
| Critical commercial assays | ||
| EasyTag EXPRESS 35S Protein Labeling Kit | PerkinElmer | NEG772014MC |
| CaspaseGlo 3/7 | Promega | G8090 |
| TruSeq ChIP Sample Prep Kit | Illumina | IP-202–1012 |
| Deposited data | ||
| Raw and analyzed data | This paper | GEO: GSE63473 |
| B-RAF RBD (apo) structure | This paper | PDB: 5J17 |
| Human reference genome NCBI build 37, GRCh37 | Genome Reference Consortium | http://www.ncbi.nlm.nih.gov/projects/genome/assembly/grc/human/ |
| Nanog STILT inference | This paper; Mendeley Data | http://dx.doi.org/10.17632/wx6s4mj7s8.2 |
| Affinity-based mass spectrometry performed with 57 genes | This paper; Mendeley Data | Table S8; http://dx.doi.org/10.17632/5hvpvspw82.1 |
| Experimental models: Cell lines | ||
| Hamster: CHO cells | ATCC | CRL-11268 |
| D. melanogaster: Cell line S2: S2-DRSC | Laboratory of Norbert Perrimon | FlyBase: FBtc0000181 |
| Human: Passage 40 H9 ES cells | MSKCC stem cell core facility | N/A |
| Human: HUES 8 hESC line (NIH approval number NIHhESC-09–0021) | HSCI iPS Core | hES Cell Line: HUES-8 |
| Experimental models: Organisms/strains | ||
| C. elegans: Strain BC4011: srl-1(s2500) II; dpy-18(e364) III; unc-46(e177)rol-3(s1040) V. | Caenorhabditis Genetics Center | WB Strain: BC4011; WormBase: WBVar00241916 |
| D. melanogaster: RNAi of Sxl: y[1] sc[*] v[1]; P{TRiP.HMS00609}attP2 | Bloomington Drosophila Stock Center | BDSC:34393; FlyBase: FBtp0064874 |
| S. cerevisiae: Strain background: W303 | ATCC | ATTC: 208353 |
| Mouse: R6/2: B6CBA-Tg(HDexon1)62Gpb/3J | The Jackson Laboratory | JAX: 006494 |
| Mouse: OXTRfl/fl: B6.129(SJL)-Oxtrtm1.1Wsy/J | The Jackson Laboratory | RRID: IMSR_JAX:008471 |
| Zebrafish: Tg(Shha:GFP)t10: t10Tg | Neumann and Nuesslein-Volhard, 2000 | ZFIN: ZDB-GENO-060207–1 |
| Arabidopsis: 35S::PIF4-YFP, BZR1-CFP | Wang et al., 2012 | N/A |
| Arabidopsis: JYB1021.2: pS24(AT5G58010)::cS24:GFP(-G):NOS #1 | NASC | NASC ID: N70450 |
| Oligonucleotides | ||
| siRNA targeting sequence: PIP5K I alpha #1: ACACAGUACUCAGUUGAUA | This paper | N/A |
| Primers for XX, see Table SX | This paper | N/A |
| Primer: GFP/YFP/CFP Forward: GCACGACTTCTTCAAGTCCGCCATGCC | This paper | N/A |
| Morpholino: MO-pax2a GGTCTGCTTTGCAGTGAATATCCAT | Gene Tools | ZFIN: ZDB-MRPHLNO-061106–5 |
| ACTB (hs01060665_g1) | Life Technologies | Cat#4331182 |
| RNA sequence: hnRNPA1_ligand: UAGGGACUUAGGGUUCUCUCUAGGGACUUAGGGUUCUCUCUAGGGA | This paper | N/A |
| Recombinant DNA | ||
| pLVX-Tight-Puro (TetOn) | Clonetech | Cat#632162 |
| Plasmid: GFP-Nito | This paper | N/A |
| cDNA GH111110 | Drosophila Genomics Resource Center | DGRC:5666; FlyBase:FBcl0130415 |
| AAV2/1-hsyn-GCaMP6- WPRE | Chen et al., 2013 | N/A |
| Mouse raptor: pLKO mouse shRNA 1 raptor | Thoreen et al., 2009 | Addgene Plasmid #21339 |
| Software and algorithms | ||
| ImageJ | Schneider et al., 2012 | https://imagej.nih.gov/ij/ |
| Bowtie2 | Langmead and Salzberg, 2012 | http://bowtie-bio.sourceforge.net/bowtie2/index.shtml |
| Samtools | Li et al., 2009 | http://samtools.sourceforge.net/ |
| Weighted Maximal Information Component Analysis v0.9 | Rau et al., 2013 | https://github.com/ChristophRau/wMICA |
| ICS algorithm | This paper; Mendeley Data | http://dx.doi.org/10.17632/5hvpvspw82.1 |
| Other | ||
| Sequence data, analyses, and resources related to the ultra-deep sequencing of the AML31 tumor, relapse, and matched normal | This paper | http://aml31.genome.wustl.edu |
| Resource website for the AML31 publication | This paper | https://github.com/chrisamiller/aml31SuppSite |
| Chemicals, peptides, and recombinant proteins | ||
| QD605 streptavidin conjugated quantum dot | Thermo Fisher Scientific | Cat#Q10101MP |
| Platinum black | Sigma-Aldrich | Cat#205915 |
| Sodium formate BioUltra, ≥99.0% (NT) | Sigma-Aldrich | Cat#71359 |
| Chloramphenicol | Sigma-Aldrich | Cat#C0378 |
| Carbon dioxide (13C, 99%) (<2% 18O) | Cambridge Isotope Laboratories | CLM-185–5 |
| Poly(vinylidene fluoride-co-hexafluoropropylene) | Sigma-Aldrich | 427179 |
| PTFE Hydrophilic Membrane Filters, 0.22 μm, 90 mm | Scientificfilters.com/Tisch Scientific | SF13842 |
| Critical commercial assays | ||
| Folic Acid (FA) ELISA kit | Alpha Diagnostic International | Cat# 0365–0B9 |
| TMT10plex Isobaric Label Reagent Set | Thermo Fisher | A37725 |
| Surface Plasmon Resonance CM5 kit | GE Healthcare | Cat#29104988 |
| NanoBRET Target Engagement K-5 kit | Promega | Cat#N2500 |
| Deposited data | ||
| B-RAF RBD (apo) structure | This paper | PDB: 5J17 |
| Structure of compound 5 | This paper; Cambridge Crystallographic Data Center | CCDC: 2016466 |
| Code for constraints-based modeling and analysis of autotrophic E. coli | This paper | https://gitlab.com/elad.noor/sloppy/tree/master/rubisco |
| Software and algorithms | ||
| Gaussian09 | Frish et al., 2013 | https://gaussian.com |
| Python version 2.7 | Python Software Foundation | https://www.python.org |
| ChemDraw Professional 18.0 | PerkinElmer | https://www.perkinelmer.com/category/chemdraw |
| Weighted Maximal Information Component Analysis v0.9 | Rau et al., 2013 | https://github.com/ChristophRau/wMICA |
| Other | ||
| DASGIP MX4/4 Gas Mixing Module for 4 Vessels with a Mass Flow Controller | Eppendorf | Cat#76DGMX44 |
| Agilent 1200 series HPLC | Agilent Technologies | https://www.agilent.com/en/products/liquid-chromatography |
| PHI Quantera II XPS | ULVAC-PHI, Inc. | https://www.ulvac-phi.com/en/products/xps/phi-quantera-ii/ |
Data and code availability
The RNA-seq and ChIP-seq datasets generated during this study are deposited at Gene Expression Omnibus (GEO) and are publicly available as the date of publication. Accession numbers are listed in Key Resources table. Original Western blot images have been deposited at Mendeley and are available from lead contact upon request.
This paper does not report original code.
Any additional information required to reanalyze the data reported in this paper is available from the lead contact upon request.
Experiment Model and Subject Details
Yeast strains and media
The prototrophic CEN.PK strain of Saccharomyces cerevisiae (van Dijken et al., 2000) was used in all experiments. Gene deletions were carried out using standard PCR-based strategies to amplify resistance cassettes with appropriate flanking sequences and replace the target gene by homologous recombination (Longtine et al., 1998). C-terminal tags were similarly made using PCR to amplify resistance cassettes with flanking sequences. All strains and genetic manipulations were verified by sequencing and phenotype. All strains used in this study are listed in Key Resources Table. Media used in this study were S (0.67% yeast nitrogen base without amino acids (BD Difco)) with or without 2% glucose. Yeast strains were also grown on various solid agar S media with either 2% glucose (D), 2% glycerol (G), 2% ethanol (E), or YTO (0.05% yeast extract, 1% tergitol, 0.1% oleate).
Glucose starvation assay
Strains of interest were grown in SD medium overnight. Cells from overnight cultures were inoculated into fresh SD to 0.2 optical density (OD)/ml and grown at least two generations to log phase (OD600 ~1). To perform glucose starvation, we quickly replaced the media by spinning down the cells, washing the pellets with pre-warmed S media, and then resuspending cells in the same volume of warmed S media. Samples were collected at indicated times. Glucose replenishment was carried out at a final concentration of 2% glucose. All centrifugations were performed at 3000 rpm, 2 min at room temperature.
Method Details
Metabolite analysis
Intracellular metabolites were extracted as described previously (Tu et al., 2007). Acetyl-CoA was detected by LC-MS/MS with a triple quadrupole mass spectrometer (3200 QTRAP, ABSCIEX) using previously established methods. Quantification was carried out using the Analyst software package 1.6.2 by calculating the total peak area.
Cell extracts preparation and Western blot
Cells were first quenched in TCA (10% final) and washed with acetone. Cell lysis was performed by bead-beating in urea buffer containing 6 M urea, 1% SDS, 50 mM Tris-HCl pH 7.5, 50 mM NaF, 5 mM EDTA, 1 mM PMSF, and protease inhibitor cocktail (Roche). Supernatants of the lysates were collected after heating for 10 min at 75°C. Protein concentration was determined using the Pierce BCA protein assay and equal amounts of proteins were separated by electrophoresis using NuPAGE gels. Blocking was performed in 5% dry milk. Antibodies used are listed in the Key Resources Table.
Immunoprecipitation
Immunoprecipitation was performed as described previously (Cai et al., 2011). Briefly, cells were lysed in lysis buffer (100 mM Tris-Cl pH 7.5, 100 mM NaCl, 50 mM NaF, 1 mM EDTA, 1 mM EGTA, 0.1% Tween-20, 10% glycerol, 50 mM sodium butyrate, 50 mM nicotinamide, 5 μM trichostatin A, 1 mM PMSF, 10 μM leupeptin, 5 μM pepstatin A, Roche protease inhibitor cocktail, 14 mM β-mercaptoethanol) by bead beating. The protein concentration of the cleared lysates was then measured using Bradford assay (Bio-Rad) and adjusted to be equal among all samples. Immunoprecipitation was performed by incubating the lysate with 25 μl magnetic beads (Invitrogen) conjugated to 2 μg Flag M2 antibody (Sigma) at 4°C for 4 h. After washing 3 times in the same buffer, the proteins were boiled off the beads.
FBP activity
FBP activity was assayed using a Fructose-1,6-Bisphosphatase activity assay kit (Biovision), with modifications. In short, cells were first lysed in Y-PER (Thermo Fisher, Yeast Protein Extraction Reagent) and vortexed at room temperature for 20 min. Supernatants of the lysates were collected and subjected to the addition of 2 volumes of 4.1 M ammonium sulfate on ice for 30 min. Precipitates were then spun down and resuspended in FBP buffer provided by the kit for assay. The signals were normalized by subtracting the background signal without substrate. The activity was quantified from linear range of the curves in duplicates.
RNA extraction and quantitative RT-PCR
RNA isolation of one OD600 unit of cells was performed using MasterPure yeast RNA purification kit (Epicenter) following the manufacturer’s protocol. RNA concentration was determined by A260. 1 μg RNA was reverse transcribed to cDNA using Superscript III Reverse Transcriptase from Invitrogen. Real-time PCR was performed in triplicate with SYBR GreenSuper mix from BioRad. Transcripts levels of genes were normalized to ACT1. Primers are listed in Table S3.
Chromatin immunoprecipitation (ChIP)
ChIP was performed as described previously (Cai et al., 2011). Briefly, 100 OD600 units of cells were fixed in 1% formaldehyde for 15 min and then quenched in 125 mM glycine for 10 min. Cell pellets were washed twice with a buffer containing 100 mM NaCl, 10 mM Tris-HCl pH 8.0, 1 mM PMSF, and 1 mM benzamide-HCl, and snap-frozen in liquid nitrogen. Frozen pellets were lysed in 0.45 mL ChIP lysis buffer (50 mM HEPES-KOH pH 7.5, 500 mM NaCl, 1 mM EDTA, 1% Triton X-100, 0.1% deoxycholate, 0.1% SDS,1 mM PMSF, 10 μM leupeptin, 5 μM pepstatin A, and Roche protease inhibitor cocktail) and lysed by bead-beating. Lysates were split to two tubes and sonicated for 16 cycles (30 sec on, 1 min off, high output) using the Bioruptor (Diagenode). The lysates were then cleared by two consecutive spins at 15,000 rpm for 10 min. For HA ChIP, lysate was incubated overnight with 10 μg antibody. For histone ChIP, lysate was diluted at 1:10 and incubated overnight with 2 μg antibody. 25 μl magnetic beads were added and incubated for an additional 1.5 h. Beads were then washed twice with ChIP lysis buffer, once with deoxycholate buffer (10 mM Tris-HCl, 0.25 M LiCl, 0.5% deoxycholate, 1 mM EDTA), and once with TE buffer (50 mM Tris-HCl pH 8.0, 10 mM EDTA). Elution was performed using TES buffer (50 mM Tris-HCl pH 8.0, 10 mM EDTA, and 1% SDS). Reverse crosslinking was performed at 65°C. An equal volume of TE containing 1.25 mg/mL proteinase K and 0.4 mg/mL RNase A was then added and incubated for 2 h at 37°C. DNA was then purified using the Qiagen PCR purification kit.
RNA-seq
RNA samples were prepared as described above in two biological replicates. RNA quality was examined by an Agilent 2100 Bioanalyzer. Libraries for WT and rpd3Δ cells were prepared using a TruSeq RNA sample preparation kit v2 (Illumina) and sequencd on Illumina NextSeq 500 System. Libraries for WT and gcn5Δ were prepared by Novogene and sequenced on Illumina NovaSeq 6000.
ChIP-seq
ChIP samples were prepared as described above in two biological replicates. We constructed sequencing libraries using KAPA Hyper Prep Kit from Kapa Biosystems. The quality and quantity of constructed libraries were determined using Agilent D1000 ScreenTape System and Invitrogen Qubit Fluorometer. The sequencing was performed by the UTSW Next Generation Sequencing Core Facility using the Illumina NextSeq 500 System.
Quantification and Statistical Analysis
Analysis of RNA-seq data
Reads with phred quality scores less than 20 and less than 35 bp after trimming were removed from further analysis using trimgalore version 0.4.1. Quality-filtered reads were then aligned to the yeast reference genome (S288C) using the HISAT (v 2.0.1) (Pertea et al., 2016) aligner using default settings and marked duplicates using Sambamba version 0.6.6 (Tarasov et al., 2015). Aligned reads were quantified using ‘featurecount’ (v1.4.6) (Liao et al., 2014) per ID against reference annotations (R64–1-1). Log fold changes were used to calculate KEGG pathway enrichment using clusterProfiler (Yu et al., 2012). All RNA-seq data have been deposited in the Sequence Read Archive (SRA) with the accession numbers GSE178159.
Analysis of ChIP-Seq data
We used the BICF ChIP-seq analysis Workflow version 1.1.3 (Barnes et al., 2020). The workflow used trimgalore version 0.4.1 (Martin et al., 2011) on the raw reads to remove adapter sequences and to remove reads shorter than 35bp or with phred quality scores less than 20. Trimmed reads were then aligned to the yeast reference genome (S288C) using default parameters in BWA version 0.7.12 (Li and Durbin, 2009). The aligned reads were subsequently filtered for quality and uniquely mappable reads were retained for further analysis using Samtools version 1.3 (Li and Durbin, 2009) and Sambamba version 0.6.6 (Tarasov et al., 2015). Library complexity was measured using BEDTools version 2.26.0 (Quinlan and Hall, 2010) and meets ENCODE data quality standards (Landt et al., 2012). We determined ChIP enrichment compared to background using ‘plotFingerprint’ in deepTools version 2.5.0 (Ramirez et al., 2016). Relaxed peaks were called using MACS version 2.1.0 (Feng et al., 2012) with a p-value of 1×10⁻² for each replicate, pooled replicates’ reads and pseudoreplicates. Peak calls from the pooled replicates that are observed either in all replicates, or in both pseudoreplicates were kept. Reads were counted at promoter regions using subread ‘featurecount’ (v1.4.6) (Liao et al., 2014) per gene ID against the same genome as above and used for subsequent analysis. Reads overlapping multiple genes were not discarded. Small-RNAs and genes with logcpm of < 10 were filtered out. All ChIP-seq data have been deposited in the Sequence Read Archive (SRA) with the accession numbers GSE178160.
Principal Component Analysis
To access sample variability across all datasets, we ran a principal component analysis using deepTools version 2.5.0 (Ramirez et al., 2016) using ‘plotPCA’ and ‘multiBamSummmary`.
Differential Binding Analysis
To detect differentially bound sites we use the R package DEseq2 (v 1.2.0) (Love et al., 2014). Cutoff values of absolute log fold change greater than 1.0 and FDR <= 0.05 were then used to select for differential genes between sample group comparisons.
Determining ChIP Enrichment
To determine how well the signal in the ChIP-seq sample can be differentiated from the background distribution of reads in the control input sample, we used deepTools version 2.5.0 (Ramirez et al., 2016) using ‘plotFingerprint’. Specifically, we focused on quality on AUC, area under the curve, to determine level of enrichment; lower values indicating higher and more focal enrichment.
Generating Density Heatmaps and Metagenes
For heatmaps and profiles of ChIP-seq intensities, we used deepTools version 2.5.0 (Ramirez et al., 2016) to generate read abundance from all ChIP-seq datasets around peak TSS (±2.0 kb) using ‘computeMatrix’. These matrices were then used to create heatmaps and profiles, using deepTools commands ‘plotHeatmap’ and ‘plotProfile’ respectively.
Motif Analysis
Meme software, version 5.3.3, was used to calculate motif enrichment in differentially bound Chip-seq sites (Bailey et al., 2015). Meme’s ‘centrimo’ tool was run on 500 bp window around promotor regions (−400 to 100 bp for H3K9ac), with default parameters against known motifs (Pachkov et al., 2007; Teixeira et al., 2006). Motifs with adjusted p-values <0.05 were considered to be enriched.
Supplementary Material
Lists of growth-promoting genes (tab 1) and starvation-induced genes (tab 2) with the fold changes shown in mRNA or H3K9ac occupancy comparing glucose starvation and glucose-replete conditions in WT cells (+D/-D).
Lists of enriched motifs for transcription factors under glucose starvation condition analyzed through two yeast-specific databases: SwissRegulon (tab 1) and Yeastract2 (tab 2).
HIGHLIGHTS.
Histone acetylation is redistributed following glucose and carbon starvation
Fat oxidation and gluconeogenesis genes acquire acetylated histones during this time
Switch in the histone acetylome is mediated by Rpd3p and Gcn5p-containing SAGA
Inhibition of histone deacetylation could hinder induction of fat metabolism genes
ACKNOWLEDGEMENTS
We thank the Tu lab, KQ Liu, M. Acoba, G. Liszczak and JP Selfa for helpful discussions, S.-L. Chen for help with illustration, and V. Lopez for suggestions on the manuscript. This work was supported by NIH grants R01CA185169, R35GM136370, and HHMI to B.P.T. H.R., S.D.B, V.S.M are supported by the Cancer Prevention and Research Institute of Texas (RP150596).
Footnotes
DECLARATION OF INTERESTS
B.P.T. is a member of the advisory board for Molecular Cell.
Publisher's Disclaimer: This is a PDF file of an unedited manuscript that has been accepted for publication. As a service to our customers we are providing this early version of the manuscript. The manuscript will undergo copyediting, typesetting, and review of the resulting proof before it is published in its final form. Please note that during the production process errors may be discovered which could affect the content, and all legal disclaimers that apply to the journal pertain.
REFERENCES
- Bailey TL, Johnson J, Grant CE, and Noble WS (2015). The MEME Suite. Nucleic Acids Res 43, W39–49. [DOI] [PMC free article] [PubMed] [Google Scholar]
- Bailey TL, and Machanick P. (2012). Inferring direct DNA binding from ChIP-seq. Nucleic Acids Research 40, e128-e128. [DOI] [PMC free article] [PubMed] [Google Scholar]
- Baptista T, Grünberg S, Minoungou N, Koster MJE, Timmers HTM, Hahn S, Devys D, and Tora L. (2017). SAGA Is a General Cofactor for RNA Polymerase II Transcription. Mol Cell 68, 130–143.e135. [DOI] [PMC free article] [PubMed] [Google Scholar]
- Barnes SD, Ruess H, Mathews JA, Chen B, and Malladi VS (2020). BICF ChIP-seq Analysis Workflow. Zenodo. [Google Scholar]
- Bonnet J, Wang CY, Baptista T, Vincent SD, Hsiao WC, Stierle M, Kao CF, Tora L, and Devys D. (2014). The SAGA coactivator complex acts on the whole transcribed genome and is required for RNA polymerase II transcription. Genes Dev 28, 1999–2012. [DOI] [PMC free article] [PubMed] [Google Scholar]
- Brauer MJ, Huttenhower C, Airoldi EM, Rosenstein R, Matese JC, Gresham D, Boer VM, Troyanskaya OG, and Botstein D. (2008). Coordination of growth rate, cell cycle, stress response, and metabolic activity in yeast. Molecular biology of the cell 19, 352–367. [DOI] [PMC free article] [PubMed] [Google Scholar]
- Cai L, McCormick MA, Kennedy BK, and Tu BP (2013). Integration of multiple nutrient cues and regulation of lifespan by ribosomal transcription factor Ifh1. Cell Rep 4, 1063–1071. [DOI] [PMC free article] [PubMed] [Google Scholar]
- Cai L, Sutter BM, Li B, and Tu BP (2011). Acetyl-CoA induces cell growth and proliferation by promoting the acetylation of histones at growth genes. Molecular cell 42, 426–437. [DOI] [PMC free article] [PubMed] [Google Scholar]
- Causton HC, Ren B, Koh SS, Harbison CT, Kanin E, Jennings EG, Lee TI, True HL, Lander ES, and Young RA (2001). Remodeling of yeast genome expression in response to environmental changes. Molecular biology of the cell 12, 323–337. [DOI] [PMC free article] [PubMed] [Google Scholar]
- Downey M, Knight B, Vashisht AA, Seller CA, Wohlschlegel JA, Shore D, and Toczyski DP (2013). Gcn5 and sirtuins regulate acetylation of the ribosomal protein transcription factor Ifh1. Curr Biol 23, 1638–1648. [DOI] [PMC free article] [PubMed] [Google Scholar]
- Eckschlager T, Plch J, Stiborova M, and Hrabeta J. (2017). Histone Deacetylase Inhibitors as Anticancer Drugs. Int J Mol Sci 18, 1414. [DOI] [PMC free article] [PubMed] [Google Scholar]
- Feng J, Liu T, Qin B, Zhang Y, and Liu XS (2012). Identifying ChIP-seq enrichment using MACS. Nat Protoc 7, 1728–1740. [DOI] [PMC free article] [PubMed] [Google Scholar]
- Gasch AP, Spellman PT, Kao CM, Carmel-Harel O, Eisen MB, Storz G, Botstein D, and Brown PO (2000). Genomic Expression Programs in the Response of Yeast Cells to Environmental Changes. Molecular Biology of the Cell 11, 4241–4257. [DOI] [PMC free article] [PubMed] [Google Scholar]
- Grant PA, Duggan L, Cote J, Roberts SM, Brownell JE, Candau R, Ohba R, Owen-Hughes T, Allis CD, Winston F, et al. (1997). Yeast Gcn5 functions in two multisubunit complexes to acetylate nucleosomal histones: characterization of an Ada complex and the SAGA (Spt/Ada) complex. Genes Dev 11, 1640–1650. [DOI] [PubMed] [Google Scholar]
- Grunstein M. (1990). Histone function in transcription. Annu Rev Cell Biol 6, 643–678. [DOI] [PubMed] [Google Scholar]
- Grunstein M. (1997). Histone acetylation in chromatin structure and transcription. Nature 389, 349–352. [DOI] [PubMed] [Google Scholar]
- Hahn S, and Young ET (2011). Transcriptional regulation in Saccharomyces cerevisiae: transcription factor regulation and function, mechanisms of initiation, and roles of activators and coactivators. Genetics 189, 705–736. [DOI] [PMC free article] [PubMed] [Google Scholar]
- Huang Z, Zhang M, Plec AA, Estill SJ, Cai L, Repa JJ, McKnight SL, and Tu BP (2018). ACSS2 promotes systemic fat storage and utilization through selective regulation of genes involved in lipid metabolism. Proc Natl Acad Sci U S A 115, E9499–E9506. [DOI] [PMC free article] [PubMed] [Google Scholar]
- Huisinga KL, and Pugh BF (2004). A genome-wide housekeeping role for TFIID and a highly regulated stress-related role for SAGA in Saccharomyces cerevisiae. Mol Cell 13, 573–585. [DOI] [PubMed] [Google Scholar]
- Jenuwein T, and Allis CD (2001). Translating the histone code. Science 293, 1074–1080. [DOI] [PubMed] [Google Scholar]
- Kaochar S, and Tu BP (2012). Gatekeepers of chromatin: Small metabolites elicit big changes in gene expression. Trends Biochem Sci 37, 477–483. [DOI] [PMC free article] [PubMed] [Google Scholar]
- Karpichev IV, and Small GM (1998). Global regulatory functions of Oaf1p and Pip2p (Oaf2p), transcription factors that regulate genes encoding peroxisomal proteins in Saccharomyces cerevisiae. Molecular and cellular biology 18, 6560–6570. [DOI] [PMC free article] [PubMed] [Google Scholar]
- Kayikci Ö, and Nielsen J. (2015). Glucose repression in Saccharomyces cerevisiae. FEMS Yeast Research 15. [DOI] [PMC free article] [PubMed] [Google Scholar]
- Kuang Z, Cai L, Zhang X, Ji H, Tu BP, and Boeke JD (2014). High-temporal-resolution view of transcription and chromatin states across distinct metabolic states in budding yeast. Nat Struct Mol Biol 21, 854–863. [DOI] [PMC free article] [PubMed] [Google Scholar]
- Kuo M-H, Brownell JE, Sobel RE, Ranalli TA, Cook RG, Edmondson DG, Roth SY, and Allis CD (1996). Transcription-linked acetylation by Gcn5p of histones H3 and H4 at specific lysines. Nature 383, 269–272. [DOI] [PubMed] [Google Scholar]
- Kurdistani SK (2007). Histone modifications as markers of cancer prognosis: a cellular view. Br J Cancer 97, 1–5. [DOI] [PMC free article] [PubMed] [Google Scholar]
- Kurdistani SK (2011). Histone modifications in cancer biology and prognosis. Prog Drug Res 67, 91–106. [DOI] [PubMed] [Google Scholar]
- Landt SG, Marinov GK, Kundaje A, Kheradpour P, Pauli F, Batzoglou S, Bernstein BE, Bickel P, Brown JB, Cayting P, et al. (2012). ChIP-seq guidelines and practices of the ENCODE and modENCODE consortia. Genome Res 22, 1813–1831. [DOI] [PMC free article] [PubMed] [Google Scholar]
- Lee SJ, Choi SE, Lee HB, Song MW, Kim YH, Jeong JY, Kang Y, Kim HJ, Kim TH, Jeon JY, et al. (2020). A Class I Histone Deacetylase Inhibitor Attenuates Insulin Resistance and Inflammation in Palmitate-Treated C2C12 Myotubes and Muscle of HF/HFr Diet Mice. Front Pharmacol 11, 601448. [DOI] [PMC free article] [PubMed] [Google Scholar]
- Li F, Wu R, Cui X, Zha L, Yu L, Shi H, and Xue B. (2016). Histone Deacetylase 1 (HDAC1) Negatively Regulates Thermogenic Program in Brown Adipocytes via Coordinated Regulation of Histone H3 Lysine 27 (H3K27) Deacetylation and Methylation. J Biol Chem 291, 4523–4536. [DOI] [PMC free article] [PubMed] [Google Scholar]
- Li H, and Durbin R. (2009). Fast and accurate short read alignment with Burrows-Wheeler transform. Bioinformatics 25, 1754–1760. [DOI] [PMC free article] [PubMed] [Google Scholar]
- Li S, and Shogren-Knaak MA (2009). The Gcn5 bromodomain of the SAGA complex facilitates cooperative and cross-tail acetylation of nucleosomes. The Journal of biological chemistry 284, 9411–9417. [DOI] [PMC free article] [PubMed] [Google Scholar]
- Li X, Yu W, Qian X, Xia Y, Zheng Y, Lee JH, Li W, Lyu J, Rao G, Zhang X, et al. (2017). Nucleus-Translocated ACSS2 Promotes Gene Transcription for Lysosomal Biogenesis and Autophagy. Mol Cell 66, 684–697 e689. [DOI] [PMC free article] [PubMed] [Google Scholar]
- Li Y, and Seto E. (2016). HDACs and HDAC Inhibitors in Cancer Development and Therapy. Cold Spring Harb Perspect Med 6. [DOI] [PMC free article] [PubMed] [Google Scholar]
- Liao Y, Smyth GK, and Shi W. (2014). featureCounts: an efficient general purpose program for assigning sequence reads to genomic features. Bioinformatics 30, 923–930. [DOI] [PubMed] [Google Scholar]
- Longtine MS, McKenzie A 3rd, Demarini DJ, Shah NG, Wach A, Brachat A, Philippsen P, and Pringle JR (1998). Additional modules for versatile and economical PCR-based gene deletion and modification in Saccharomyces cerevisiae. Yeast 14, 953–961. [DOI] [PubMed] [Google Scholar]
- Love MI, Huber W, and Anders S. (2014). Moderated estimation of fold change and dispersion for RNA-seq data with DESeq2. Genome Biol 15, 550. [DOI] [PMC free article] [PubMed] [Google Scholar]
- Luo Y, Karpichev IV, Kohanski RA, and Small GM (1996). Purification, identification, and properties of a Saccharomyces cerevisiae oleate-activated upstream activating sequence-binding protein that is involved in the activation of POX1. J Biol Chem 271, 12068–12075. [DOI] [PubMed] [Google Scholar]
- Mariño G, Pietrocola F, Eisenberg T, Kong Y, Malik Shoaib A., Andryushkova A, Schroeder S, Pendl T, Harger A, Niso-Santano M, et al. (2014). Regulation of Autophagy by Cytosolic Acetyl-Coenzyme A. Molecular Cell 53, 710–725. [DOI] [PubMed] [Google Scholar]
- Martin DP, Lemey P, and Posada D. (2011). Analysing recombination in nucleotide sequences. Mol Ecol Resour 11, 943–955. [DOI] [PubMed] [Google Scholar]
- McKnight Jeffrey N., Boerma Joseph W., Breeden Linda L., and Tsukiyama T. (2015). Global Promoter Targeting of a Conserved Lysine Deacetylase for Transcriptional Shutoff during Quiescence Entry. Molecular Cell 59, 732–743. [DOI] [PMC free article] [PubMed] [Google Scholar]
- Mews P, Donahue G, Drake AM, Luczak V, Abel T, and Berger SL (2017). Acetyl-CoA synthetase regulates histone acetylation and hippocampal memory. Nature 546, 381–386. [DOI] [PMC free article] [PubMed] [Google Scholar]
- Pachkov M, Erb I, Molina N, and van Nimwegen E. (2007). SwissRegulon: a database of genome-wide annotations of regulatory sites. Nucleic acids research 35, D127–D131. [DOI] [PMC free article] [PubMed] [Google Scholar]
- Pertea M, Kim D, Pertea GM, Leek JT, and Salzberg SL (2016). Transcript-level expression analysis of RNA-seq experiments with HISAT, StringTie and Ballgown. Nat Protoc 11, 1650–1667. [DOI] [PMC free article] [PubMed] [Google Scholar]
- Quinlan AR, and Hall IM (2010). BEDTools: a flexible suite of utilities for comparing genomic features. Bioinformatics 26, 841–842. [DOI] [PMC free article] [PubMed] [Google Scholar]
- Ramirez F, Ryan DP, Gruning B, Bhardwaj V, Kilpert F, Richter AS, Heyne S, Dundar F, and Manke T. (2016). deepTools2: a next generation web server for deep-sequencing data analysis. Nucleic Acids Res 44, W160–165. [DOI] [PMC free article] [PubMed] [Google Scholar]
- Reid MA, Dai Z, and Locasale JW (2017). The impact of cellular metabolism on chromatin dynamics and epigenetics. Nature Cell Biology 19, 1298–1306. [DOI] [PMC free article] [PubMed] [Google Scholar]
- Ropero S, and Esteller M. (2007). The role of histone deacetylases (HDACs) in human cancer. Mol Oncol 1, 19–25. [DOI] [PMC free article] [PubMed] [Google Scholar]
- Roth SY, Denu JM, and Allis CD (2001). Histone Acetyltransferases. Annual Review of Biochemistry 70, 81–120. [DOI] [PubMed] [Google Scholar]
- Rothbart SB, Dickson BM, Raab JR, Grzybowski AT, Krajewski K, Guo AH, Shanle EK, Josefowicz SZ, Fuchs SM, Allis CD, et al. (2015). An Interactive Database for the Assessment of Histone Antibody Specificity. Molecular cell 59, 502–511. [DOI] [PMC free article] [PubMed] [Google Scholar]
- Seligson DB, Horvath S, Shi T, Yu H, Tze S, Grunstein M, and Kurdistani SK (2005). Global histone modification patterns predict risk of prostate cancer recurrence. Nature 435, 1262–1266. [DOI] [PubMed] [Google Scholar]
- Shi L, and Tu BP (2015). Acetyl-CoA and the regulation of metabolism: mechanisms and consequences. Curr Opin Cell Biol 33, 125–131. [DOI] [PMC free article] [PubMed] [Google Scholar]
- Simon M, Adam G, Rapatz W, Spevak W, and Ruis H. (1991). The Saccharomyces cerevisiae ADR1 gene is a positive regulator of transcription of genes encoding peroxisomal proteins. Mol Cell Biol 11, 699–704. [DOI] [PMC free article] [PubMed] [Google Scholar]
- Sterner DE, and Berger SL (2000). Acetylation of histones and transcription-related factors. Microbiol Mol Biol Rev 64, 435–459. [DOI] [PMC free article] [PubMed] [Google Scholar]
- Strahl BD, and Allis CD (2000). The language of covalent histone modifications. Nature 403, 41–45. [DOI] [PubMed] [Google Scholar]
- Struhl K. (1998). Histone acetylation and transcriptional regulatory mechanisms. Genes Dev 12, 599–606. [DOI] [PubMed] [Google Scholar]
- Su X, Wellen KE, and Rabinowitz JD (2016). Metabolic control of methylation and acetylation. Curr Opin Chem Biol 30, 52–60. [DOI] [PMC free article] [PubMed] [Google Scholar]
- Suraweera A, O’Byrne KJ, and Richard DJ (2018). Combination Therapy With Histone Deacetylase Inhibitors (HDACi) for the Treatment of Cancer: Achieving the Full Therapeutic Potential of HDACi. Front Oncol 8, 92. [DOI] [PMC free article] [PubMed] [Google Scholar]
- Takahashi H, McCaffery JM, Irizarry RA, and Boeke JD (2006). Nucleocytosolic Acetyl-Coenzyme A Synthetase Is Required for Histone Acetylation and Global Transcription. Molecular Cell 23, 207–217. [DOI] [PubMed] [Google Scholar]
- Tarasov A, Vilella AJ, Cuppen E, Nijman IJ, and Prins P. (2015). Sambamba: fast processing of NGS alignment formats. Bioinformatics 31, 2032–2034. [DOI] [PMC free article] [PubMed] [Google Scholar]
- Teixeira MC, Monteiro P, Jain P, Tenreiro S, Fernandes AR, Mira NP, Alenquer M, Freitas AT, Oliveira AL, and Sá-Correia I. (2006). The YEASTRACT database: a tool for the analysis of transcription regulatory associations in Saccharomyces cerevisiae. Nucleic Acids Res 34, D446–451. [DOI] [PMC free article] [PubMed] [Google Scholar]
- Tu BP, Mohler RE, Liu JC, Dombek KM, Young ET, Synovec RE, and McKnight SL (2007). Cyclic changes in metabolic state during the life of a yeast cell. Proceedings of the National Academy of Sciences 104, 16886. [DOI] [PMC free article] [PubMed] [Google Scholar]
- van Dijken JP, Bauer J, Brambilla L, Duboc P, Francois JM, Gancedo C, Giuseppin ML, Heijnen JJ, Hoare M, Lange HC, et al. (2000). An interlaboratory comparison of physiological and genetic properties of four Saccharomyces cerevisiae strains. Enzyme Microb. Technol 26, 706–714. [DOI] [PubMed] [Google Scholar]
- Venters BJ, Wachi S, Mavrich TN, Andersen BE, Jena P, Sinnamon AJ, Jain P, Rolleri NS, Jiang C, Hemeryck-Walsh C, et al. (2011). A comprehensive genomic binding map of gene and chromatin regulatory proteins in Saccharomyces. Mol Cell 41, 480–492. [DOI] [PMC free article] [PubMed] [Google Scholar]
- Waterborg JH (2002). Dynamics of histone acetylation in vivo. A function for acetylation turnover? Biochem Cell Biol 80, 363–378. [DOI] [PubMed] [Google Scholar]
- Wellen KE, Hatzivassiliou G, Sachdeva UM, Bui TV, Cross JR, and Thompson CB (2009). ATP-citrate lyase links cellular metabolism to histone acetylation. Science 324, 1076–1080. [DOI] [PMC free article] [PubMed] [Google Scholar]
- West AC, and Johnstone RW (2014). New and emerging HDAC inhibitors for cancer treatment. J Clin Invest 124, 30–39. [DOI] [PMC free article] [PubMed] [Google Scholar]
- Yang X-J, and Seto E. (2008). The Rpd3/Hda1 family of lysine deacetylases: from bacteria and yeast to mice and men. Nature Reviews Molecular Cell Biology 9, 206–218. [DOI] [PMC free article] [PubMed] [Google Scholar]
- Ye C, and Tu BP (2018). Sink into the Epigenome: Histones as Repositories That Influence Cellular Metabolism. Trends Endocrinol Metab 29, 626–637. [DOI] [PMC free article] [PubMed] [Google Scholar]
- Young ET, Dombek KM, Tachibana C, and Ideker T. (2003). Multiple Pathways Are Co-regulated by the Protein Kinase Snf1 and the Transcription Factors Adr1 and Cat8 *. Journal of Biological Chemistry 278, 26146–26158. [DOI] [PubMed] [Google Scholar]
- Yu G, Wang LG, Han Y, and He QY (2012). clusterProfiler: an R package for comparing biological themes among gene clusters. OMICS 16, 284–287. [DOI] [PMC free article] [PubMed] [Google Scholar]
Associated Data
This section collects any data citations, data availability statements, or supplementary materials included in this article.
Supplementary Materials
Lists of growth-promoting genes (tab 1) and starvation-induced genes (tab 2) with the fold changes shown in mRNA or H3K9ac occupancy comparing glucose starvation and glucose-replete conditions in WT cells (+D/-D).
Lists of enriched motifs for transcription factors under glucose starvation condition analyzed through two yeast-specific databases: SwissRegulon (tab 1) and Yeastract2 (tab 2).
Data Availability Statement
The RNA-seq and ChIP-seq datasets generated during this study are deposited at Gene Expression Omnibus (GEO) and are publicly available as the date of publication. Accession numbers are listed in Key Resources table. Original Western blot images have been deposited at Mendeley and are available from lead contact upon request.
This paper does not report original code.
Any additional information required to reanalyze the data reported in this paper is available from the lead contact upon request.