

Keywords: autism spectrum disorder (ASD), CNV, EEG, phase locking, predictive processing
Abstract
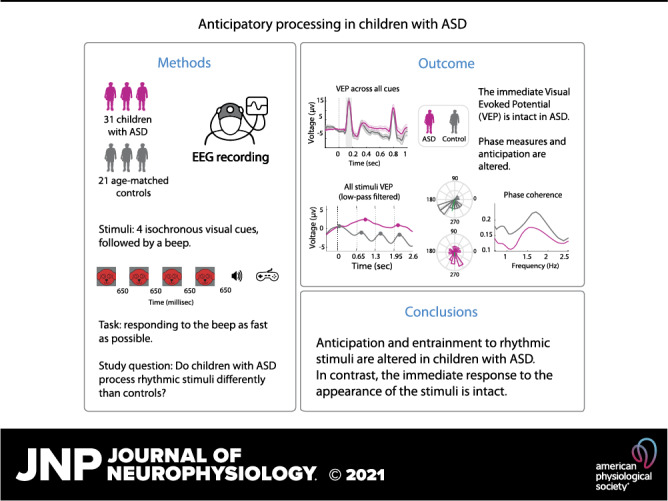
Anticipating near-future events is fundamental to adaptive behavior, whereby neural processing of predictable stimuli is significantly facilitated relative to nonpredictable events. Neural oscillations appear to be a key anticipatory mechanism by which processing of upcoming stimuli is modified, and they often entrain to rhythmic environmental sequences. Clinical and anecdotal observations have led to the hypothesis that people with autism spectrum disorder (ASD) may have deficits in generating predictions, and as such, a candidate neural mechanism may be failure to adequately entrain neural activity to repetitive environmental patterns, to facilitate temporal predictions. We tested this hypothesis by interrogating temporal predictions and rhythmic entrainment using behavioral and electrophysiological approaches. We recorded high-density electroencephalography in children with ASD and typically developing (TD) age- and IQ-matched controls, while they reacted to an auditory target as quickly as possible. This auditory event was either preceded by predictive rhythmic visual cues or was not preceded by any cue. Both ASD and control groups presented comparable behavioral facilitation in response to the Cue versus No-Cue condition, challenging the hypothesis that children with ASD have deficits in generating temporal predictions. Analyses of the electrophysiological data, in contrast, revealed significantly reduced neural entrainment to the visual cues and altered anticipatory processes in the ASD group. This was the case despite intact stimulus-evoked visual responses. These results support intact behavioral temporal prediction in response to a cue in ASD, in the face of altered neural entrainment and anticipatory processes.
NEW & NOTEWORTHY We examined behavioral and EEG indices of predictive processing in children with ASD to rhythmically predictable stimuli. Although behavioral measures of predictive processing and evoked neural responses were intact in the ASD group, neurophysiological measures of preparatory activity and entrainment were impaired. When sensory events are presented in a predictable temporal pattern, performance and neuronal responses in ASD may be governed more by the occurrence of the events themselves and less by their anticipated timing.
INTRODUCTION
The sensory environment provides us with context that both constrains and predicts near-future events, allowing for anticipatory planning and decision-making (1, 2). The ability to anticipate relevant events is highly advantageous for adaptive behavior (3), leading to facilitated sensory processing of predictable inputs (4–8). A recently forwarded hypothesis in autism research is that individuals with autism spectrum disorder (ASD) are impaired in their ability to use contextual information to modulate current processing (9, 10), but see Ref. 11. This impairment stems from their altered use of prior experience to generate expectations about the environment (10, 12, 13) and is associated with compromised adaptation processes (14). Indeed, in studies that involve perceptual judgments, individuals with ASD often do not calibrate neural sensitivity on the basis of the recent past, as is typically seen in controls (15–18). Although a common argument is that perceptual decisions follow Bayesian rules, in the sense that they are based on the prior likelihood of the events (19, 20), people with ASD have altered perceptual judgment, where processing of priors may be underweighted. This underweighting of priors has been linked to impaired updating of events and impaired predictive processing in ASD (10) and could explain prominent symptoms of the clinical phenotype of autism, such as reduced behavioral flexibility, insistence on sameness, and rigidity of routines (21–23). Despite evidence for an imbalance in the influence of prior information versus sensory input on perception, the underlying neuronal processes remain poorly understood.
A wealth of research makes clear that neural entrainment, the phase-locking of brain oscillatory processes to rhythmic sensory inputs, is one prominent mechanism by which the brain encodes contextual cues to predict near-future events (24–30). According to this account, during entrainment to a predictable stimulus, the phase of slow oscillations aligns such that the stimulus presentation falls within an “optimal” phase, which reflects the network excitability at that moment (31). These “excitability phases” are thought to act as a sensory selection mechanism when oscillations are in the lower frequency, such as δ and θ (29). Given mounting evidence for impaired updating of priors in the face of changing environments in ASD, we considered that instantaneous tracking of information might be impaired. We hypothesized that impaired entrainment in individuals with ASD would lead to altered tracking of temporal regularities in the environment, and in turn, this would negatively impact anticipation of, and response to, temporally predictable events. Natural rhythmic sensory inputs often include some degree of noise such that they are nonstrictly rhythmic (32, 33) and indeed entrainment occurs to quasi-rhythmic scenarios (34, 35). Still, strictly rhythmic stimulation is more suitable for inducing anticipation based on timing (4, 36, 37). Using a child-friendly paradigm, we aimed to generate temporal expectation through isochronous rhythmic visual stimulation that was informative of the timing of an upcoming auditory target event. Specifically, four visual cues were followed by an auditory target, with the intervals between stimulus events at a constant stimulus onset asynchrony (SOA) of 650 ms. We focused our analyses on behavioral responses and on physiological activity through coherence of neural oscillations to the rhythmic visual cues, as measured by intertrial phase coherence (ITPC; 1, 29), and on participants’ anticipation of the target, as indexed by the contingent negative variation (CNV) response, a negative deflecting EEG component indicating preparation for an anticipated target (38–40). We expected that the extent of impairment of these neural processes would be related to target detection performance, since detection threshold and ongoing EEG phase have been shown to fluctuate together (24, 41, 42). In addition, we tested whether the evoked responses to the auditory and visual sensory events were altered for the ASD group. Altered entrainment and anticipation, in conjunction with comparable evoked sensory potentials between ASD and controls, would indicate dissociation between early stimulus-evoked processing and stimulus tracking and anticipation. Alternatively, if both processes are impaired, this would suggest a more general impairment in neuronal functioning in response to sensory stimuli.
MATERIALS AND METHODS
Participants
The data used for this study were collected in the context of a study on the efficacy of different behavioral interventions, in which children diagnosed with ASD were tested in three different sessions. Data presented here were recorded at the preintervention visit. Data from 36 children with ASD and 27 Intelligence Quotient (IQ)- and age-matched typically developing (TD) children were originally included in the study. Among the initial participants, five participants with ASD and six TD participants were excluded from analysis due to the lack of sufficient responses or insufficient data as follows: three TD participants and five participants with ASD were excluded because of an insufficient number of EEG trials (less than 50 trials for each condition) and three TD participants were excluded on the basis of insufficient behavioral data. Eventually, 31 children diagnosed with ASD and 21 IQ- and age-matched TD controls were analyzed across all pipelines and analyses in the study [see Table 1; all noncategorical comparisons were performed with independent-samples t test and all categorical comparisons (sex, handedness) were compared with Fisher Exact test]. Participants ranged in age from 6 to 9 yr old and were recruited without regard to sex, race, or ethnicity; TD participants were recruited to match the ASD group on age. IQ quotients for performance (PIQ), verbal (VIQ), and full-scale (FSIQ) intelligence were assessed for the participants, using the Wechsler abbreviated scales of intelligence (WASI; 43) (all participants with ASD and 2/3 of the TD participants were assessed; see limitations in discussion). Comparison of IQ shows no significant differences between the groups on nonverbal IQ and on full-scale IQ. Verbal IQ was significantly higher for the TD group. To be considered for the ASD group, participants had to meet diagnostic criteria for ASD on the basis of the following measures: 1) autism diagnostic observation schedule 2 (ADOS-2) (44); 2) diagnostic criteria for autistic disorder from the Diagnostic and Statistical Manual of Mental Disorders (DSM-5); 3) clinical impression of a licensed clinician with extensive experience in diagnosis and evaluation of children with ASD. The Repetitive Behavior Scale-Revised (RBS-R) (45) questionnaire was collected to obtain continuous measures of ASD characteristics related to insistence on sameness such as ritualistic/sameness behavior, stereotypic behavior, and restricted interests. To be included in the TD group, participants had to have no history of neurological, developmental, or psychiatric disorders or first degree relatives with a diagnosis of ASD and had to be in an age-appropriate grade at school. All participants’ caregivers signed an informed consent approved by the institutional Review Board of the Albert Einstein College of Medicine. Participants received nominal recompense for their participation (at $15 per hour for the TD participants and a total of $250 for participation in the treatment study for participants with ASD). Exclusionary criteria for both groups included epilepsy or premature birth (<35 wk). Participants from both groups scored nonverbal IQ > 80 (except for one participant; see limitations in discussion). Two exceptions were made on a case-by-case basis, for children with ASD: one child with ASD born preterm (32 wk) was included in the experiment and another child who scored 64 for nonverbal IQ was included. Both children scored as their peers on other measurements and thus including them was not anticipated to skew the data of their group.
Table 1.
Means ± SD of age, sex, and IQ of the two groups
| Age | Sex | Handedness | IQ (Full Scale) | IQ (Verbal) | IQ (Nonverbal) | ADOS Severity | |
|---|---|---|---|---|---|---|---|
| ASD (31) | 7.88 ± 2.5 | 24 (M) 7 (F) | 24 (R) 7 (L) | 94.2 ± 16 | 91.8 ± 18 | 97.8 ± 15 | 7.9 ± 1.8 |
| TD (21) | 7.77 ± 1.45 | 9 (M) 12 (F) | 18 (R) 3 (L) | 102.23 ± 9 | 111 ± 11 | 93.6 ± 13 | NA |
| t/OR value; P value (df = 48) | 0.21; 0.83 | 4.5; 0.012 | 0.57; 0.86 | 1.63; 0.1 | −3.2; 0.002 | 0.72; 0.4 | NA |
Statistics are given in t or odds ratio (OR) and P values. ADOS, autism diagnostic observation schedule; ASD, autism spectrum disorder; F, female; L, left; M, male; NA, not applicable; R, right; TD, typically developing.
All participants passed a screen for normal or corrected-to-normal vision and normal hearing on the day of testing. Parents and/or guardians of all participants provided written informed consent. All procedures were approved by the Institutional Review Board of the Albert Einstein College of Medicine.
Stimuli and Task
The paradigm was designed like a computer game, with stimuli that consisted of a cartoon dog’s face as the visual stimulus, and cartoons of a running, happy, or sleeping dog as feedback for too fast, right on time, or too slow responses, respectively, that were accompanied with uplifting sound (slot machine sound) or a neutral sound (two tones in high-low pitch sequence) for responding in/outside the window, respectively. The visual cue stimuli were presented centrally on a 25 in. ViewSonic screen (refresh rate: 60 Hz, pixel resolution: 1,280 × 1,024 × 32) of a Dell computer using Presentation software (Version 20.0, Neurobehavioral Systems, Inc., Berkeley, CA) and subtending ∼4.4° of visual angle. The auditory target stimulus was a 1,000 Hz tone 80 ms in duration that was delivered at an intensity of 75 dB via a single, from a centrally located loudspeaker (JBL Duet Speaker System, Harman Multimedia) (See Fig. 1 for paradigm schematic).
Figure 1.

Schematic of experimental paradigm. A: Cue condition; B: No-Cue condition (identical in timing to Cue condition except that visual cues were not presented). C: feedback screens.
During the paradigm, participants had to respond to a (cued or not cued) auditory target as quickly as possible, and then they received feedback to indicate if their response was too fast (e.g., an anticipatory response), right on time, or too slow. The experiment included two conditions: for the “Cue” condition, participants were presented with a sequence of four isochronously presented visual stimuli for a duration of 80 ms each, presented at a stimulus onset asynchrony (SOA) of 650 ms, followed by an 80 ms 1,000-Hz auditory stimulus, presented 650 ms after the last visual cue. This setup of four isochronous visual cues followed by an auditory target was designed to create a highly temporally predictable situation, which in turn was expected to lead to the engagement of neural preparatory processes (i.e., the CNV) and to the entrainment to the stimulation rhythm. This rhythm of presentation was previously found to create phase entrainment to the ∼1.5 Hz stimulation rate, during the stimuli presentation (27, 30). For the “No-Cue” control condition, the auditory target was not preceded by a sequence of visual cue stimuli. Instead, a central focus “+” sign appeared at the beginning of the trial, and the interval between trial onset (either the central fixation cross or the first of the 4 visual cues) was maintained such that the auditory target appeared 2,600 ms after the beginning of trial. In all other respects, the paradigm, including the timing of presentation of the stimuli, was identical between the conditions (see Fig. 1 for paradigm illustration). Both conditions included 15% catch trials on which the auditory target was not presented.
Cue and No-Cue conditions were blocked and presented in runs of 25 trials per block, over a total of 20 blocks. The order of blocks within the experiment for a given participant was chosen randomly before each experimental session. Each block lasted 3.5 min. Participants were encouraged to take short breaks between the blocks as needed. The whole experiment, including preparation and clean up, lunch, and frequent short breaks, lasted around 3 h. Participants were seated at a fixed distance of 65 cm from the screen and responded with their preferred hand. In all trials, they were instructed to press a button on a response pad (Logitech Wingman Precision Gamepad) as soon as they heard the auditory tone. Instructions were worded as following: “There will be a cross in the middle of the screen. Try to keep looking at it. Every time you hear a beep, press this button. Press only when you hear the beep, and try to avoid pressing when a beep does not occur.” Responses occurring between 150 and 1,500 ms following the auditory tone were considered correct, and positive feedback was provided via presentation of a cartoon dog image and an uplifting sound. If the response was outside this time window, a running dog cartoon with a sad sound was presented to indicate that the response was too fast, and a sitting dog image with the sad sound was presented to indicate that the response was too slow (Fig. 1).
Data Acquisition
Response times were recorded with the Presentation software. EEG recordings were collected from 70 active channels (10–20 system; 64 scalp channels and 6 external electrodes: 2 upper mastoids; 2 lower mastoids; 2 vertical Electrooculography (EOG) at a digitization rate of 512 Hz, using Active Two (BioSemi, Amsterdam, The Netherlands) with an anti-aliasing filter (−3 dB at 3.6 kHz). Analog triggers indicating the latencies of stimulus onsets and button presses were sent to the acquisition PC via Presentation and stored digitally at a sampling rate of 512 Hz in a separate channel of the EEG data file.
Eye Tracking
To ensure that participants adhered to our instruction to fixate centrally, we monitored the eye position throughout the experiment using the Eyelink100 eye-tracking system (sampling rate: 1,000 Hz) and a video camera. If the experimenter either noticed through video monitoring that the child was looking away, or the eye-link system indicated that gaze moved away from the screen, the experimenter reminded the participant to look at the centrally placed fixation cross. We compared the ratio between gaze outside/inside window of eight visual angels centered at the fixation point. We found no evidence for between-groups differences in gaze pattern (mean ± SD: TD = 1.4% + 1.2%; ASD = 2.1% + 1.5%; t = 1.6; df = 49; P = 0.11).
Data Processing
Data were processed and analyzed using custom MATLAB scripts (MATLAB r2017a, MathWorks, Natick, MA) and the FieldTrip toolbox (46; Donders Institute for Brain, Cognition and Behavior, Radboud University, The Netherlands). A criterion of at least 50 trials per participant per condition for use in each analytic pipeline was set for inclusion in the study. Most participants had more than 100 trials in each condition (means ± SE: ASD = 136 ± 24; TD = 168 ± 37). For reaction time (RT) analysis, the tails of the RT distributions of each participant (2.5% at each end) were excluded from further analysis.
Behavior
D-Prime (d′) and reaction times were calculated from the behavioral data. Hits were defined as responses to the auditory target and false alarms as a response to a catch trial. Proportion of hits was defined as the ratio between the number of hits and the number of all trials presented to the participant. False alarms were defined as a response to a catch trial, that is, pushing the button even though no auditory target stimulus occurred. The proportion of false alarms was defined as the ratio between the number of false alarms and the number of all trials presented to the participant. For each participant, d′ was calculated as the difference between the proportions of the hits and false alarms of the values, after they were transformed to Z-scores: d′ = Z(p(Hit)) − Z(p(False Alarm)). All behavioral results (Fig. 2) are plotted with Matplotlib package for Python (47).
Figure 2.

Behavioral results. A: violin plots showing reaction times (RTs) of participants per group and condition shown in split violin plots. RTs of the autism spectrum disorder (ASD) group were slower than those of typically developing (TD) group and faster for the Cue compared with the No-Cue condition. Each stroke represents a participants’ averaged RT. B: d′ values per group and condition. C: standard deviations (SD) of RT. SD-RTs were higher for the ASD group than for the TD group (*significant differences). D: the correlation between intertrial phase coherence (ITPC) values, transformed to rationalized arcsine units (RAU) (see materials and methods), SD-RT regression line for each group separately, and a 95% confidence interval for each regression. E: k-means clustering on the basis of ITPC and SD-RT data with two centroids. The majority of TD participants populate cluster 1 (lower SD-RT/higher ITPC). The majority of participants with ASD populate cluster 2 (higher SD-RT, lower ITPC).
EEG Processing
To tailor analyses to each of our research questions, data processing involved four different subpipelines, as elaborated below. All epochs, except for those used for measuring entrainment [see Entrainment] were downsampled to 256 Hz, bandpass filtered between 0.1 and 55 Hz using Butterworth infinite impulse response (IIR) windowing, with filter order of 5. Epoching was performed on the filtered data. Epochs were demeaned to normalize for DC shifts, and baseline-corrected, as specified below.
Visual-evoked potential.
Continuous data were epoched with respect to each visual stimulus: 200 ms before and 850 ms after stimulus onset and baselined to the 100-ms window before the onset of each visual stimulus. Two averaging approaches were taken, so that we could measure and compare between groups on 1) the overall visual-evoked potential (VEP) and 2) sequence effects on the CNV, as follows.
P1.
To compare sensory-evoked potentials between the groups, trials were averaged across all stimuli, regardless of their placement in the sequence. Data were referenced to a frontal channel (AFz) to optimize visualization and measurement of the VEP over occipital scalp at channels O1, O2, and Oz. Comparison between the groups on the VEP was calculated on the voltage at the peak of the P1 component (time window centered at 100 ms) for each participant (see Statistical Analysis for more details).
Contingent negative variation.
To test for differential patterns of anticipation with respect to the place of a cue in the sequence, voltages were measured following each of the visual cue stimuli and averaged across the 200-ms time window before the upcoming stimulus, which was either visual (i.e., the 2nd, 3rd, or 4th cue stimulus) or auditory (the target). Event-related potentials (ERP) analyses were focused on preparatory effects (the CNV) that are commonly seen over frontocentral sites (38, 40, 48) and were measured at frontal channels (AFz, FP1, AF3, and AF4). To optimize visualization and measurement, data were referenced to P1.
Entrainment.
To measure entrainment of neural oscillations to the timing of the events, the EEG data were low-pass filtered at 55 Hz and high-pass filtered at 0.1 Hz and then were epoched at 3,000 ms before and 500 ms after the auditory event to encompass the full sequence of stimuli comprising a trial. Trials were then baselined to 100 ms before the onset of the first visual stimulus in the sequence. Data were referenced to channel AFz. To visualize entrainment of oscillatory activity to the rhythm of visual events (1.5 Hz), data were low-pass filtered at 1.9 Hz. For this, a finite impulse response (FIR) filter, with normalized passband frequency of 1.9 Hz, stopband frequency of 4 Hz, passband ripple of 1 Hz, and stopband attenuation of 60 dB, was applied. Following previous studies showing posterior entrainment to rhythmic inputs (27, 30), our areas of interest were focused on parieto-occipital channels. Intratrial phase coherence (ITPC) was calculated as follows (49):
where θnij is the phase at frequency bin i and temporal bin j in trial n. Output values range between 0 (no phase coherence) and 1 (strongest phase coherence). First, to observe differences in entrainment to the stimulation rhythm around 1.5 Hz, ITPC was calculated for the frequency domain only, averaged across all timepoints in the 3,500-ms time window (including the 4 visual cues and auditory target) for all scalp electrodes. ITPC was calculated for the frequency range of 0.6–2.7 Hz, divided into 28 bins, each encompassing 0.07 Hz. The average number of trials per participant used to calculate ITPC for TD and ASD groups (with cue) was mean ± SD: 201 ± 34 and 167 ± 54, respectively. To evaluate differences in ITPC between the groups, a two-way ANOVA was performed with Group and Cue as factors on the ITPC max values at the window of 1.4–1.8 Hz, where most participants’ ITPC reached a peak.
Second, as an exploratory approach to see if changes of ITPC modulate on times around stimuli onsets at higher frequency bands than the stimulation rate (1.5 Hz), we performed a time-frequency ITPC analysis. For this, we re-epoched the trials to 4,000 ms before and 500 ms after the auditory target to allow large margins for the time-frequency decomposition with wavelet and to visualize ITPC for the whole trial. Again, trials were baselined to the 100 ms before the onset of the first visual stimulus in the sequence.
To evaluate frequencies at both δ and θ bands, we used wavelets ranging from 0.5 to 13 Hz in 26 linearly spaced steps, with a width of 3 cycles at 0.5 Hz increasing to 5 cycles at 13 Hz.
We included δ and θ bands in this analysis to evaluate the effect of the rhythmic stimuli on oscillations at the frequency range that includes δ and θ. To account for potential power differences in the δ/θ bands, we calculated time-frequency representation (TFR) on these epochs, with the same frequency range, using the same wavelet decomposition approach and specifications as described for the time-frequency ITPC. To control for bias due to prestimulus differences, we applied baseline correction as in Hu et al. (50) by subtracting the average power at prestimulus period from the power of each frequency.
Auditory-evoked potential.
To analyze auditory-evoked potential (AEP) to the auditory target stimulus and possible differences between the groups with respect to condition, data were epoched 300 ms before and 850 ms after the auditory stimulus onset and baselined to 100 ms before auditory stimulus onset, and as per convention, referenced to the channels near the left and right mastoid (TP7, TP8). Statistical analysis was performed on data from frontocentral channels (FC1, FC2, FCz) at the peak of each participant’s auditory P1, N1, and P2 components calculated on time windows centered at 50 ms (auditory P1), 100 ms (auditory N1), and 200 ms (auditory P2) (see EEG Processing for more details).
For all pipelines, after epoching, a two-stage automatic artifact rejection was applied at the single-trial level. First, channels that varied from the mean voltage across all channels and from the auto-covariance by 1 standard deviation were classified as bad. A maximum of six bad channels was set as an inclusion criterion for trials to be analyzed. For these trials, channels were interpolated using the nearest neighbor spline (51, 52). Second, a criterion of ±120 μV was applied. Electrodes that exceeded this criterion were considered bad.
Statistical Analysis
Behavioral data.
Mean reaction times (RT) and means ± SE were calculated for each participant and averaged across participants per each group and condition. Kolmogorov–Smirnov test of normality of distribution showed a normal RT distribution. Thus, a 2 × 2 ANOVA with Condition and Group as factors was calculated for both RT and d′.
EEG data.
Visual (P1) and auditory (P1, N1, P2) sensory components and the CNV were calculated for each participant for statistical analysis, and then averaged across each groups for illustration, at the relevant scalp sites and time windows.
VEP.
In accordance with the literature (e.g., Ref. 53) and confirmed by visual inspection of the data, a window of 20 ms centered at 100 ms (visual P1) following visual cue stimuli was used to capture the maximum voltage of the early VEP over occipital scalp (O1, O2, and Oz). Group differences were analyzed using a t test for unpaired data.
CNV.
For the analysis of anticipatory activity (i.e., the CNV), a window of interest was defined between −200 and 0 ms with relation to an expected stimulus (e.g., see Refs. 38, 40, 48). Mean voltage over frontal scalp (AFz, FP1, AF3, AF4) in this time window was calculated for each of the two conditions using a two-way ANOVA with Cue order and Group as factors. Following the observation of anticipatory effects on occipital channels in a CNV-like response, we performed a post hoc analysis in which we performed a three-way ANOVA with Cue order, Group, and Scalp region as factors. Post hoc effects were analyzed with Tukey–Kramer test and with Bonferroni–Holm correction for multiple comparisons. In addition to the predefined components for statistical analysis, an exploratory approach was taken to explore and visualize effects in other time windows and scalp regions. For this, we tested the entire data matrix. Statistical cluster plots (SCPs; 54) were generated by calculating paired two-tailed t tests between the groups, in the VEP and the AEP, generated at each timepoint for each group, and across all channels. Cluster-based correction for multiple comparisons was then applied to yield significant clusters, using Monte Carlo approach for choosing clusters based on the sum of the t values within a cluster (55).
Entrainment.
In this pipeline, intertrial phase coherence (ITPC) was calculated separately for each individual participant, between all trials in the two experimental conditions (cued and noncued), for the whole trial. This measure quantifies the consistency of the phase of responses across trials. ITPC was calculated as the circular variance of the phase across trials (49) at each frequency and time bin and either averaged across time bins (for the across-times ITPC analysis) or not (for the time-frequency ITPC matrices). For the low-frequency ITPC analysis, ANOVA was performed on the ITPC values with Group and Cue as factors. For the time-frequency ITPC analysis, differences in the time course of the between TD and ASD groups were calculated by subtracting ITPC values of ASD group averages from those of TD group averages, for each time and frequency point. To assess the significance of the maps, nonparametric statistics were computed using permutation tests, as follows. To assess the null distribution, the group labels were randomly intermixed for each subject, and the ITPC difference was computed on the Z-scored values, with a P < 0.05 as a threshold. This procedure was repeated 10,000 times for each frequency and timepoint in the 26 × 954 time × frequency ITPC matrix (56). To correct for multiple comparisons in the time × frequency ITPC matrix, we used two approaches: we first defined significant clusters as P values in consecutive timepoints for each frequency. Since we were interested at differences around stimulus onsets, we defined windows of 300 ms centered at each of the four stimuli onset. Significant clusters are those that had at least eight consecutive timepoints with significant P values (57). As a second, more stringent approach, we searched significant clusters in the time-frequency maps, using cluster-based correction for multiple comparisons. Here, we applied cluster-based multiple correction test (58). Critical size of clusters was defined as the cluster size that is larger than 95% of the null clusters that were found by N = 1,000 permutations on the time-frequency maps of the two groups pooled together. To test for the presence of significant group differences in TFR power, the same statistical procedures that were described for the time-frequency ITPC were applied to the TFR data. To test for correlations between behavior and measurements of entrainment, a linear Pearson correlation was performed between RT and ITPC that were transformed to rationalized arcsine units (RAU, see Ref. 59). In addition, we considered standard deviation of RT (SD-RT), to test whether it might correlate better with variability of entrainment. SD-RT × ITCP correlation was calculated for each group individually and across the two groups. To find if the distribution of the data points on the two dimensions, SD-RT and ITPC, mapped onto separate clusters that were dominated by one or the other participant group, k-means classification was performed on all participants’ SD-RT × ITPC correlation data points. The k-means clustering partitions n samples into k clusters of the greatest possible distinction. Each object belongs to the cluster with the nearest mean. The objective of k-means clustering is to minimize total intracluster variance or the squared error function:
where k is the number of predefined clusters, n is number of samples, and C is the centroid of a cluster. Two centroids were defined for the combined data set using the elbow method (60). Evaluation of k-means clustering was achieved using the Silhouette method, with squared Euclidean distance (61).
To assess potential associations between ASD severity and oscillatory entrainment, Pearson correlations between scores of behavioral/cognitive assessments and ITPC were tested for the children with ASD. For behavioral/cognitive assessments, we used severity scores from autism diagnostic observation schedule (ADOS), performance IQ, verbal IQ, and repetitive behavior scale-revised (RBS-R) questionnaire. P values were corrected for multiple comparisons, using Holm–Bonferroni false discovery rate (FDR) method (62).
AEP.
In accordance with the literature (e.g., Refs. 63 and 64) and confirmed by visual inspection of the data, windows of 20, 40, and 60 ms following auditory target (in both the Cue and No-Cue conditions) centered at 50 ms (auditory P1), 100 ms (auditory N1), and 200 ms (auditory P2) were used to capture the maximum (for P1, P2) or minimum (for N1) voltage of the AEP over frontocentral scalp (FC1, FC2, FCz). Three separate two-way ANOVAs with α = 0.05 and Group and Condition (Cue and No-cue) as factors were performed to test for differences between the groups.
For significant differences in the paired tests, effect sizes (d for t test, η for ANOVA) (65) are also provided, in addition to P values.
Codes used for EEG analyses are available through Github: https://github.com/Shlomit-Beker.
RESULTS
We investigated the influence of an isochronous and predictable repeating stimulus on neural entrainment and anticipation processes in children with a diagnosis of ASD, using measurements of reaction time and of EEG dynamics.
Behavioral Results
Reaction times were measured as the time between the onset of the auditory target and the participant’s motor response (Fig. 2). A two-way ANOVA with Condition and Group as factors found that overall, both groups of participants had shorter latencies in the Cue compared with the No-Cue condition [means ± SE: Cue = 370 ± 18 ms; No-Cue = 432 ± 18 ms; F(1,48) = 5.8; P = 0.019]. In addition, there was a main effect of group, where the average RT was slower for participants with ASD than for TD participants [means ± SE: ASD = 431 ± 17 ms; TD = 357 ± 16 ms; F(1,48) = 8.7; P = 0.005]. No Condition × Group interaction was found [means ± SE: TD Cue = 331 ± 23 ms; TD No-Cue = 382 ± 23 ms; ASD Cue = 396 ± 4 ms; ASD No-Cue = 465 ± 24 ms; F(1,48) = 0.11; P = 0.74; see Fig. 2]. The d′ measures showed a similar pattern of results [means ± SE: ASD Cue = 2.43 ± 0.17; ASD No-Cue = 1.79 ± 0.16; TD Cue = 2.93 ± 0.24; TD No-Cue = 2.01 ± 0.11; Fig. 2B]. A 2 × 2 ANOVA on d′ with Group and Condition as factors showed a Group effect that approached significance [F(1,48) = 3.8; P = 0.05] and a main effect for Condition, where d′ was lower for the No-Cue condition [F(1,48) = 17; P < 0.001]. No Condition × Group interaction was found [F(1,48) = 0.57; P = 0.45].
To measure differences in variability in behavior, the SD-RT was calculated for each individual participant and condition and compared between the groups. On average, RTs of participants with ASD were more variable than those of TD participants (SD-RT, means ± SE: TD Cue = 120 ± 14 ms; ASD Cue = 178 ± 18 ms; TD No-Cue = 122 ± 13 ms; ASD No-Cue = 187 ± 17 ms). There was a significant main effect of Group [F(1,48) = 12.4, P < 0.001] but not of Condition [F(1,48) = 0.2, P = 0.7], and the Condition × Group interaction was not statistically significant [F(1,48) = 0.04; P = 0.8].
EEG Results
To account for the effect of introducing isochronous visual cues on different aspects of the brain responses, results are reported for the different pipelines used for the analysis (see EEG Data).
VEP.
The visual-evoked potential was measured at occipital sites (O1, Oz, and O2) at 100 ms after visual stimulus onset (P1). Mean VEPs did not differ significantly between the two groups (t stat = 0.02; df = 48, P = 0.9). To test the robustness of seemingly different potentials at a later time window (450–650 ms), where lower amplitudes for ASD than TD at frontal, central, and parietal sites were observed (Fig. 3A), we performed an exploratory two-tailed t test for unpaired data (for occipital channels: t stat = 2; df = 43; P = 0.048). These findings are further supported by the more comprehensive SCP analysis. Here, group differences were not apparent in the sensory processing time frame but emerged across a broad swath of channels from frontocentral to posterior scalp regions in the ∼400 to 700 ms time window (Fig. 3A2).
Figure 3.

A: visual-evoked potential (VEP) averaged across all 4 cues. A1: waveforms from occipital scalp for typically developing (TD) and autism spectrum disorder (ASD) groups. A2: statistical cluster plots of t test results for ASD vs. TD comparison for all channels and timepoints (statistically significant clusters are plotted in bold color). A3: scalp-voltage topographic maps for the P1 and the contingent negative variation (CNV). B: anticipatory activity over frontal scalp channels for each group. Top: for each of the 4 sequential visual cues; bottom: for the 1st and last (4th) visual cue. A graded anticipatory response in the time window highlighted in gray is present for the TD, but not the ASD, group. C: box plots showing averaged CNV voltage for participants in each group and stimulus, calculated over the 200-ms time window before 1st and 4th stimulus (*significant differences). Plots were created using https://github.com/mickcrosse/DataVisTools. D: scalp topographic maps for the 1st and 4th stimulus and the difference between them, averaged across the 200-ms time window before the upcoming stimulus. NS, not significant.
CNV.
Considering the ERP prior to each stimulus in the sequence separately, a gradation of the CNV response is seen before stimulus onset for the TD group, where voltage is more negative going the later the cue appears in the sequence. This gradation is best seen at frontal sites in the TD group, where we focused our analysis (Fig. 3B). Over this same scalp region, this negative-going change in voltage is not evident in the ASD group. A two-way ANOVA revealed a significant Group × Cue order (1st vs. 4th) interaction [F(1,48) = 5.2; P = 0.02; η = 0.03] but no main effect for Group [F(1,48) = 1.2; P = −0.28] or Cue order [F(1,48)=2.2; P = 0.13]. Tukey–Kramer post hoc test on the interaction effect revealed a significant difference between voltage traces after the first and fourth cues in the sequence of the TD group (P = 0.03) but not the ASD group (P = 0.94).
Entrainment.
To visualize entrainment to the rhythm of stimulation (1.5 Hz), each epoch was individually low-pass filtered at 1.9 Hz (see materials and methods). Then, epochs were averaged across participants. Broadband and low-pass filtered signals are shown in Fig. 4A. Fast Fourier transform (FFT) analysis did not show a between-group differences in the maximal power at the stimulating frequency, 1.5 Hz (Wilcoxon rank test zVal = −1.14; ranksum = 460, P = 0.25). To measure neural entrainment to the rhythm of stimulus presentation (1.5 Hz), the average of phase angles at the time of visual stimulus onsets was calculated for each individual trial at the stimulation frequency of 1.5 Hz. Phase angles were plotted for each group in a polar plane as histograms. Average across participants is denoted by the mean resultant vector, which is plotted on the polar plots. In line with previous finding on visual entrainment (27, 30), analysis was focused on data from parieto-occipital channels. Polar plots show higher phase concentration for the TD group (Rayleigh test for nonuniformity, P < 0.001) than for the ASD group (Rayleigh test for nonuniformity, P = 0.1; Fig. 4B). To measure coherence of phases across trials, intertrial phase coherence (ITPC) was calculated across epochs for each participant and channel, and across participants in each group, for frequencies in the range of 0.6–2.5 Hz (Fig. 4C). ITPC is stronger over occipital (Oz, Iz) and central channels (C1, C2, Cz) for the TD than for the ASD group (Fig. 4D). To evaluate differences in ITPC between the groups, a two-way ANOVA was performed on the ITPC peak values with Group and Condition as factors (Fig. 4E). Main effects were found for Group [F(1,47) = 5.3; P = 0.023; η = 0.044] and Condition [F(1,47) = 17; P < 0.001; η = 0.14]. There was no Group × Condition interaction [F(1,47) = 0.16; P = 0.68]. Testing for group differences in ITPC in the No-Cue condition, there is evidence for stronger phase locking in TD than in ASD (permutation test with n = 10,000 iterations: P = 0.038). This No-Cue between-group difference could be a result of the paradigm’s design (see limitation section at the end of the discussion). Following the significant ITPC difference between the groups, we explored whether the ITPC differences are modulated around the stimuli onsets by calculating ITPC at each time and frequency point in the time-frequency matrices. In this exploratory analysis, we observed the strongest difference in ITPC between the groups in the vicinity of cue onset times (Fig. 4F). To compensate for false discovery rate related to multiple comparisons, only timepoints that met the predefined criterion were marked as significant (black contours in Fig. 4F) (57). Following this approach, ITPC was weaker in the ASD than in the TD group in the vicinity of the second, third, and fourth cues in the sequence. This difference did not hold up to more stringent statistical correction using a cluster-based correction for multiple comparisons (58).
Figure 4.

Rhythmic entrainment. A, top: grand averaged low-pass filtered signals superimposed on wideband signal, time locked to the first of the visual cue stimuli, for an epoch that extends through the four visual cue stimuli. Onsets of visual cue stimuli are marked by vertical dashed lines. Middle: low-pass signals for the autism spectrum disorder (ASD) and typically developing (TD) groups. Bottom: averaged fast Fourier transform (FFT) for TD and ASD groups with standard error, for the Cue (left) and No-Cue (right) conditions. Note that none of the observed differences was statistically significant. B: polar plots of phase concentration at 1.5 Hz at time of visual stimulus presentation for ASD and TD groups for Cue and No-Cue conditions. C: intertrial phase coherence (ITPC) across timepoints for the 1–4 cues in the sequence. D: topography plots of ITPC at presentation rate for ASD and TD groups and Cue and No-Cue conditions. E: box plots showing averaged ITPC peak values for participants in each group and condition, calculated in the range of 0.6–2.5 Hz. Plots were created using https://github.com/mickcrosse/DataVisTools (*significant results). F, top: group difference in ITPC for each time and frequency bin (data interpolated for visualization). The white vertical dashed lines indicate the times of stimuli presentation. The black contours indicate significant areas following correction for multiple comparisons. Bottom: mean ITPC value collapsed across all frequency values at each timepoints. VEP, visual-evoked potential.
As a note, the significant clusters that survived the correction should not be taken as a separate unit from the whole map, but instead as the peaks of larger effect which encompasses more time and frequency points, since the time range of each cluster is less than one cycle of the neural oscillation.
With regard to the time frequency representation (TFR), no significant power differences were found between the groups in the δ/θ bands (Supplemental Fig. S1; all Supplemental material is available at (https://doi.org/10.6084/m9.figshare.14965725).
Interestingly, although power differences were not observed in the δ/θ range, there was a subtle power modulation in the α range that was significantly reduced for the ASD group at certain time-frequency clusters around cue onset times. Reduced α activity in ASD versus TD has been shown in a range of different paradigms (e.g., see Refs. 66 and 67). Although this effect was not predicted nor was at the focus of this analysis, more work is needed to account for underlying process.
To see whether the behavioral measurements correlated with neural entrainment, we measured the correlation between RT and ITPC and standard deviation of RT and ITPC. Through this correlation, we wished to investigate whether there is a direct link between speed of processing and entrainment, and/or whether the degree of consistency of response is correlated with the consistency of neural entrainment, that is, ITPC. Although no correlation was found between ITPC and RT, an inverse linear correlation between SD-RT and ITPC at 1.5 Hz was demonstrated for both the ASD (Pearson r = −0.47, P < 0.01) and TD (Pearson r = −0.46, P < 0.01) groups and across the two groups (Pearson r = −0.46, P < 0.01, see Fig. 2D). That is, in both groups, the higher the ITPC of an individual participant, the lower the variance of their RTs. To find clusters in this correlation distribution, k-means classification was performed on all participants’ SD-RT × ITPC correlation data. Classification using the elbow method for finding optimal number of clusters (68) resulted in two clusters. A total of 33% of participants with ASD versus 70% of TD participants fell into cluster 1, the low SD-RT/high ITPC cluster, whereas 66% of participants with ASD versus 30% of TD participants fell into cluster 2, the high SD-RT/low ITPC cluster. Parsed differently, cluster 1 contains 54% data points from TD participants, whereas cluster 2 contains 75% data points from participants with ASD.
To test a group difference based on the covariance of SD-RT and ITPC, we performed Hotelling T2 test for multivariate samples (https://github.com/brian-lau/multdist), with SD-RT and ITPC as within-subject variables. The test shows no significant difference between the groups, although a trend exists [T2 = 5.759; F(2,47) = 2.819; P = 0.07].
AEP.
Group × Condition analysis of variance (ANOVA) was performed on the auditory components P1 at 50 ms, N1 at 100 ms, and P2 at 200 ms (Fig. 5). Analysis showed no main effects or interactions of the factors, Group and Cue, over frontocentral scalp for the P1 [Group: F(1,48) = 1.4; P = 0.24; Cue: F(1,48) = 2.2; P = 0.14, ns; interaction: F(1,48) = 0.3; P = 0.56] or the P2 [Group: F(1,48) = 0.4; P = 0.54, ns; Cue: F(1,48) = 0.13; P = 0.72; interaction: F(1,48) = 0.02; P = 0.89]. Similarly, no main effects or interaction were found for the N1 [Group: F(1,48) = 2.59; P = 0.11; Cue: F(1,48) = 0.26; P = 0.61, interaction: F(1,48) = 0.02; P = 0.87]. Although differences in most comparisons were not significant, comparing the two groups in the No-Cue condition resulted in significant clusters channels at the late response window (300–600 ms after stimulus onset; see Fig. 5D), which can be related to difference in slow oscillatory activity between the group, with a nonsignificant hint in the Cue condition (Fig. 5C).
Figure 5.

Auditory-evoked potentials (AEP). Waveforms and statistical cluster plots (SCPs) for Cue vs. No-Cue conditions for typically developing (TD) and autism spectrum disorder (ASD) groups (A and B, respectively) and for ASD vs. TD groups for Cue and No-Cue (C and D, respectively) conditions. Waveforms are plotted for frontocentral channels. Statistically significant clusters following correction for multiple comparisons are plotted in bold color.
Finally, Pearson correlation between behavioral/cognitive assessments of the children with ASD and ITPC found no significant correlations. Tests were performed for autism diagnostic observation schedule (ADOS; r = 0.06, P = 0.84); performance IQ (r = −0.02, P = 0.87); verbal IQ (r = 0.12; P = 0.83) and repetitive behavior scale-revised (RBS-R; r = −0.17; P = 0.83).
DISCUSSION
Clinical observations and behavioral tasks suggest that people with ASD are often impaired in generating expectations based on regularities in their environment (23), but the field lacks mechanistic insight into the neural underpinnings of this prominent feature of the ASD phenotype (41). Based on impairments observed in children with ASD in tasks that involve adaptation to stimuli and/or anticipatory processing, we reasoned that one potential source might be disruption of entrainment of synchronous neuronal activity, a neural mechanism that has been implicated strongly in the formation of anticipatory predictive processes (69) and in the representation of rhythmic environmental structures (70).
To this end, we applied a paradigm designed to evoke neural entrainment and anticipatory processes, enabling us to study these functions in children with ASD. We presented a series of four visual isochronous cues, followed by an auditory target that occurred in rhythm with the cues. A control condition did not include any cues before the auditory target. Participants performed a speeded target detection task while high-density EEG and response speeds were measured. Despite significantly slower responses overall for the ASD group, which is common in ASD across a range of tasks (71–74) and could reflect deficits in motor functions (75), the presence of the visual cues led to a similar speeding of responses, compared with a no-cue condition, for both groups. Hence, contrary to our expectation, individuals with ASD were not impaired in their ability to benefit from temporal cues. Indeed, although numerous studies have reported impaired predictive processing in ASD (16, 76–82), this is not always the case, and mixed results and intact predictive processing have also been found (83–88).
The intact effect of temporal cues in our data contrasts with the dramatic electrophysiological differences between ASD and control groups in anticipatory processes, as well as in entrainment to the visual stimulus train, that we see. Anticipatory processing was indexed by the CNV and measured by comparing the amplitudes of the signals following each of the four visual cue stimuli, in the 200-ms period immediately before the upcoming stimulus. In the TD group, there was an evident build function to the CNV such that it increased systematically in amplitude as the cueing sequence progressed and the imminence of the target approached (Fig. 3B). This pattern was not present, however, in the ASD group. Indication for reduced entrainment was seen in the reduction of phase coherence (intertrial phase coherence, ITPC) of the signal relative to a highly predictable stimulus onset. Data showed reduced entrainment for the participants with ASD at both the frequency of stimulation (δ; Fig. 4C) and θ frequency oscillations at around the times of stimulus presentation (Fig. 4F). Modulation of θ-band ITPC following stimulation in the δ rhythm has been previously observed (89) and may reflect a hierarchical organization of EEG oscillations (90).
There was a lack of Group by Cue-Condition interaction. A possible scenario that could explain this is that there were carryover effects from the entrainment in the Cue blocks to the No-Cue blocks, creating a certain level of phase locking to the times of the (missing) cues, which led to higher ITPC values in the TD group, for whom entrainment was more effective overall. Together, the entrainment (ITPC) and anticipatory processing (CNV) data point to altered neural tracking and anticipation of temporally predictable stimuli in the ASD group.
Our analysis of the electrophysiological data further revealed that visual-evoked responses were essentially indistinguishable between the groups (Figs. 3A and 5). Taken together, these neurophysiological data point to intact sensory processing (71, 91–93), despite altered entrainment and anticipatory processing in this population. Altered neuro-oscillatory activity in ASD aligns well with findings from a previous study by our group, where anticipatory α-band oscillatory activity was found to be reduced in ASD in the context of a cued intersensory attention task (67), suggesting that transiently deployed neuro-oscillatory mechanisms were weakened in this population (94–96). The current work extends these findings by showing that neuro-oscillatory activity in a lower frequency band that entrains to the rhythm of a predictable task is also impacted in ASD.
Finding atypical neurophysiological indices of anticipatory processing, despite intact sensory responses, is in line with a prominent theory in ASD—the weak central coherence theory (97). This theory proposes that there is a reduced tendency to extract global form and meaning in ASD, which might result from a processing bias for featural and local information and impaired global processing (98), both of which would lead to difficulty in extracting gist in everyday life. In this context, it has been argued that people with ASD apply strategies that depend on the sensory inputs, at the expense of more integrative processing that requires an awareness of context necessary for prediction (12, 97).
Entrainment of oscillatory activity is considered to reflect a form of preparation (1), where temporally predictable targets are associated not only with stronger alignment of δ phase with the target event but also with speeding of reaction time (99). However, despite impaired anticipation and entrainment in ASD, the behavioral cuing effect was intact. That is, participants with ASD showed a proportionally similar speeding of their responses to what was seen in TD participants. Arguably, the intact ERPs and behavioral facilitation in the participants with ASD indicate that target detection did not lean on entrainment and anticipation in this paradigm. Here, the mere presence of a single temporal cue may have been sufficient to speed response times to a supra-threshold target to near ceiling levels, rendering the influence of entrainment negligible. It is possible that the use of subthreshold targets (100), which we deemed untenable with the current population, would provide a more sensitive behavioral assay of the influence of anticipatory processes on predictive processing.
In this context, it is relevant to point out that while rhythmic input has been associated with enhanced speed and performance across multiple paradigms and modalities (64, 99, 101, 102), group-level relationships between oscillatory activity and behavior are not always found (103), likely reflecting the complexity of the relationships between neuro-oscillatory function and behavior (103–106). Nevertheless, it is notable that in our data, we found that phase coherence was correlated with reduced variability of reaction time for both ASD and TD groups. The k-means clustering analysis further suggested that the TD group had greater representation in the lower SD-RT/higher ITPC cluster (70% of TD participants) and the ASD group had greater representation in the higher SD-RT and lower ITPC cluster (66% of participants with ASD).
Based on our data, we stress the following: in an environment where sensory events are presented in a predictable temporal pattern, neuronal responses and performance in children with ASD may be governed more by the occurrence of the events themselves and less by their anticipated timing based on rhythm. Behaviorally, children with ASD benefited as much as TD children from the contextual stimuli. In contrast, they showed significantly reduced entrainment and anticipatory activity compared with the TD group. Since immediate response to the stimuli (both ERP and behavior) is not covaried with the underlying oscillatory activity, we conclude that, at least in the current paradigm, cue-based enhancement of target detection was not fully dependent on the underlying slow oscillatory activity.
There are several limitations that should be noted with respect to this study. The ratio of males to females differed between the groups. Note that we would not anticipate sex effects here, since we measure basic neural processes. Another limitation is that cognitive testing was not performed on all of the TD children, and hence matching on P-IQ is based on a subset (62%) of the TD participants. However, power analysis on P-IQ results show that we would need n = 113 participants to observe a between-group difference with a statistical power of 0.8. In other words, given the current number of participants with ASD, an equal number of TD participants will, with a high probability, yield a nonsignificant between-group difference in this test.
Although we expected to find an association between impaired entrainment and phenotypic expression of rigidity and insistance on sameness as assessed by the Repetitive Behavior Scale-revised (RBSR), this was not evident in our data. It is important to point out that the final score of an assessment reflects a weighted average of many symptoms of the disorder, whereas ITPC could be correlated with the severity of a specific symptom/subset, but not others. Therefore, future work that accounts for hidden patterns of relationships between ITPC and ASD symptoms may better serve to elucidate these associations.
With regard to measuring rhythmicity in the current paradigm, to minimize irritation and enhance engagement to the stimuli in this young, clinical population, we have introduced the simplest conditions of rhythmic cues and no cues. For a full theoretical framework of entrainment in ASD, future work will need to include other rhythmic conditions, such as a-rhythmic cues.
Another potentially important consideration is our use of an intersensory design, whereby the auditory target is preceded by visual cues. Since there are well-documented deficits in multisensory integration in children with autism (71, 91, 93, 107–112), it is possible that impaired ITPC is due to poor cross-sensory communication and that what we are observing reflects a multisensory deficit rather than a general entrainment issue. Arguing against a pure multisensory deficit account, the ASD group showed faster RTs in the cued compared with the uncued condition, demonstrating intact use of a cross-sensory cue. An intrasensory design (e.g., using visual cues and visual targets) would address whether such entrainment and anticipation deficits are specific to a multisensory setup.
Finally, views against ITPC as a reliable measure of rhythmic entrainment state that it might reflect memory-based anticipation that is also observed as the CNV (see Refs. 38 and 39 for this case and Ref. 113 for counter arguments). The different topographies that we find for the CNV and ITPC (see Fig. 3A3 and Fig. 4D, respectively), however, argue against a common underlying process.
Conclusions
The current data show that cue-based temporal predictions can be readily implemented in children with autism. This finding counters the idea that predictive processing is categorically impaired in this group. In contrast to the behavioral data, we found that neuro-oscillatory entrainment to the rhythm of stimulus presentation was impaired and preparatory brain activity was altered in ASD, whereas basic sensory processing was intact. Notably, entrainment was associated with reaction-time variability, revealing the influence of entrainment of neural processes on behavior. Nevertheless, further work is needed to fully understand the behavioral and clinical implications of impaired neural entrainment in ASD and whether impaired neural entrainment might be related to temporally based predictive processing under more complex situations.
SUPPLEMENTAL DATA
Supplemental Fig. S1: https://doi.org/10.6084/m9.figshare.14965725.
GRANTS
This work was supported in part by an RO1 from the NICHD (HD082814) and through the Rose F. Kennedy Intellectual and Developmental Disabilities Research Center (RFK-IDDRC), which is funded through a center grant from the Eunice Kennedy Shriver National Institute of Child Health & Human Development (NICHD U54 HD090260 to S.M.). Additional support for our work in ASD comes from pilot grant funds from The Harry T. Mangurian Jr. Foundation. Work on ASD at the University of Rochester (UR) collaborating site is funded by a center grant from the Eunice Kennedy Shriver National Institute of Child Health and Human Development (NICHD P50 HD103536 to J.J.F.) supporting the UR Intellectual and Developmental Disabilities Research Center (UR-IDDRC).
DISCLOSURES
No conflicts of interest, financial or otherwise, are declared by the authors.
AUTHOR CONTRIBUTIONS
J.J.F. and S.M. conceived and designed research; S.B. analyzed data; S.B., J.J.F., and S.M. interpreted results of experiments; S.B. prepared figures; S.B. drafted manuscript; S.B., J.J.F., and S.M. edited and revised manuscript; S.B., J.J.F., and S.M. approved final version of manuscript.
ENDNOTE
At the request of the authors, readers are herein alerted to the fact that additional materials related to this manuscript may be found at https://github.com/Shlomit-Beker. These materials are not a part of this manuscript and have not undergone peer review by the American Physiological Society (APS). APS and the journal editors take no responsibility for these materials, for the website address, or for any links to or from it.
ACKNOWLEDGMENTS
The authors thank the participants and their families for taking the time to participate in this study and for their dedication to advancing understanding of autism. We could not do this without you! We acknowledge the contributions of the Human Clinical Phenotyping Core of the Rose F. Kennedy Intellectual and Developmental Disabilities Research Center (RFK IDDRC) and Drs. Juliana Bates and Pamela Counts for performing clinical and cognitive testing; Luke Shaw and Douwe Horsthuis for paradigm programming and preprocessing of the data; Yilun Zhang and Elise Taverna for their extreme diligence in collecting high-quality EEG data; and Maya Madzharova, Catherine Halpern, Sophia Zhou, and Alaina Berruti for recruitment and study coordination. S.B. additionally thanks Dr. Idan Tal for helpful comments and suggestions for parts of the analysis.
REFERENCES
- 1.Lakatos P, Karmos G, Mehta AD, Ulbert I, Schroeder CE. Entrainment of neuronal oscillations as a mechanism of attentional selection. Science 320: 110–113, 2008. doi: 10.1126/science.1154735. [DOI] [PubMed] [Google Scholar]
- 2.Rao RPN, Ballard DH. Predictive coding in the visual cortex: a functional interpretation of some extra-classical receptive-field effects. Nat Neurosci 2: 79–87, 1999. doi: 10.1038/4580. [DOI] [PubMed] [Google Scholar]
- 3.Nobre A, Correa A, Coull J. The hazards of time. Curr Opin Neurobiol 17: 465–470, 2007. doi: 10.1016/j.conb.2007.07.006. [DOI] [PubMed] [Google Scholar]
- 4.Cravo AM, Rohenkohl G, Wyart V, Nobre AC. Temporal expectation enhances contrast sensitivity by phase entrainment of low-frequency oscillations in visual cortex. J Neurosci 33: 4002–4010, 2013. doi: 10.1523/JNEUROSCI.4675-12.2013. [DOI] [PMC free article] [PubMed] [Google Scholar]
- 5.Cui X, Stetson C, Montague PR, Eagleman DM. Ready…go: amplitude of the FMRI signal encodes expectation of cue arrival time. PLoS Biol 7: e1000167, 2009. [Erratum in PLoS Biol 7, 2009]. doi: 10.1371/journal.pbio.1000167. [DOI] [PMC free article] [PubMed] [Google Scholar]
- 6.Foxe JJ, Simpson GV. Biasing the brain’s attentional set: II. effects of selective intersensory attentional deployments on subsequent sensory processing. Exp Brain Res 166: 393–401, 2005. doi: 10.1007/s00221-005-2379-6. [DOI] [PubMed] [Google Scholar]
- 7.Foxe JJ, Simpson GV, Ahlfors SP, Saron CD. Biasing the brain’s attentional set: I. cue driven deployments of intersensory selective attention. Exp Brain Res 166: 370–392, 2005. doi: 10.1007/s00221-005-2378-7. [DOI] [PubMed] [Google Scholar]
- 8.Kelly SP, Gomez-Ramirez M, Foxe JJ. The strength of anticipatory spatial biasing predicts target discrimination at attended locations: a high-density EEG study. Eur J Neurosci 30: 2224–2234, 2009. doi: 10.1111/j.1460-9568.2009.06980.x. [DOI] [PubMed] [Google Scholar]
- 9.Mitchell P, Ropar D. Visuo-spatial abilities in autism: a review. Inf Child Develop 13: 185–198, 2004. doi: 10.1002/icd.348. [DOI] [Google Scholar]
- 10.Pellicano E, Burr D. When the world becomes ‘too real’: a Bayesian explanation of autistic perception. Trends Cogn Sci 16: 504–510, 2012. doi: 10.1016/j.tics.2012.08.009. [DOI] [PubMed] [Google Scholar]
- 11.Brock J. Alternative Bayesian accounts of autistic perception: comment on Pellicano and Burr. Trends Cogn Sci 16: 573–574, 2012. doi: 10.1016/j.tics.2012.10.005. [DOI] [PubMed] [Google Scholar]
- 12.Sinha P, Kjelgaard MM, Gandhi TK, Tsourides K, Cardinaux AL, Pantazis D, Diamond SP, Held RM. Autism as a disorder of prediction. Proc Natl Acad Sci USA 111: 15220–15225, 2014. doi: 10.1073/pnas.1416797111. [DOI] [PMC free article] [PubMed] [Google Scholar]
- 13.Uljarević M, Richdale AL, Evans DW, Cai RY, Leekam SR. Interrelationship between insistence on sameness, effortful control and anxiety in adolescents and young adults with autism spectrum disorder (ASD). Mol Autism 8: 36, 2017. doi: 10.1186/s13229-017-0158-4. [DOI] [PMC free article] [PubMed] [Google Scholar]
- 14.Lawson RP, Aylward J, White S, Rees G. A striking reduction of simple loudness adaptation in autism. Sci Rep 5: 16157, 2015. doi: 10.1038/srep16157. [DOI] [PMC free article] [PubMed] [Google Scholar]
- 15.Karaminis T, Cicchini GM, Neil L, Cappagli G, Aagten-Murphy D, Burr D, Pellicano E. Central tendency effects in time interval reproduction in autism. Sci Rep 6: 28570, 2016. doi: 10.1038/srep28570. [DOI] [PMC free article] [PubMed] [Google Scholar]
- 16.Lieder I, Adam V, Frenkel O, Jaffe-Dax S, Sahani M, Ahissar M. Perceptual bias reveals slow-updating in autism and fast-forgetting in dyslexia. Nat Neurosci 22: 256–264, 2019. doi: 10.1038/s41593-018-0308-9. [DOI] [PubMed] [Google Scholar]
- 17.Turi M, Burr DC, Igliozzi R, Aagten-Murphy D, Muratori F, Pellicano E. Children with autism spectrum disorder show reduced adaptation to number. Proc Natl Acad Sci USA 112: 7868–7872, 2015. doi: 10.1073/pnas.1504099112. [DOI] [PMC free article] [PubMed] [Google Scholar]
- 18.Turi M, Karaminis T, Pellicano E, Burr D. No rapid audiovisual recalibration in adults on the autism spectrum. Sci Rep 6: 21756, 2016. doi: 10.1038/srep21756. [DOI] [PMC free article] [PubMed] [Google Scholar]
- 19.Alais D, Burr D. The ventriloquist effect results from near-optimal bimodal integration. Curr Biol 14: 257–262, 2004. doi: 10.1016/j.cub.2004.01.029. [DOI] [PubMed] [Google Scholar]
- 20.Kersten D, Mamassian P, Yuille A. Object perception as Bayesian inference. Annu Rev Psychol 55: 271–304, 2004. doi: 10.1146/annurev.psych.55.090902.142005. [DOI] [PubMed] [Google Scholar]
- 21.Pellicano E. Testing the predictive power of cognitive atypicalities in autistic children: evidence from a 3-year follow-up study. Autism Res 6: 258–267, 2013. doi: 10.1002/aur.1286. [DOI] [PubMed] [Google Scholar]
- 22.Pellicano E, Jeffery L, Burr D, Rhodes G. Abnormal adaptive face-coding mechanisms in children with autism spectrum disorder. Curr Biol 17: 1508–1512, 2007. doi: 10.1016/j.cub.2007.07.065. [DOI] [PubMed] [Google Scholar]
- 23.Van de Cruys S, Evers K, Van der Hallen R, Van Eylen L, Boets B, de-Wit L, Wagemans J. Precise minds in uncertain worlds: predictive coding in autism. Psychol Rev 121: 649–675, 2014. doi: 10.1037/a0037665. [DOI] [PubMed] [Google Scholar]
- 24.Busch NA, Dubois J, VanRullen R. The phase of ongoing EEG oscillations predicts visual perception. J Neurosci 29: 7869–7876, 2009. doi: 10.1523/JNEUROSCI.0113-09.2009. [DOI] [PMC free article] [PubMed] [Google Scholar]
- 25.Fiebelkorn IC, Snyder AC, Mercier MR, Butler JS, Molholm S, Foxe JJ. Cortical cross-frequency coupling predicts perceptual outcomes. NeuroImage 69: 126–137, 2013. doi: 10.1016/j.neuroimage.2012.11.021. [DOI] [PMC free article] [PubMed] [Google Scholar]
- 26.Gomez-Ramirez M, Kelly SP, Molholm S, Sehatpour P, Schwartz TH, Foxe JJ. Oscillatory sensory selection mechanisms during intersensory attention to rhythmic auditory and visual inputs: a human electrocorticographic investigation. J Neurosci 31: 18556–18567, 2011. doi: 10.1523/JNEUROSCI.2164-11.2011. [DOI] [PMC free article] [PubMed] [Google Scholar]
- 27.Gray MJ, Frey HP, Wilson TJ, Foxe JJ. Oscillatory recruitment of bilateral visual cortex during spatial attention to competing rhythmic inputs. J Neurosci 35: 5489–5503, 2015. doi: 10.1523/JNEUROSCI.2891-14.2015. [DOI] [PMC free article] [PubMed] [Google Scholar]
- 28.Mazaheri A, Slagter HA, Thut G, Foxe JJ. Orchestration of brain oscillations: principles and functions. Eur J Neurosci 48: 2385–2388, 2018. doi: 10.1111/ejn.14189. [DOI] [PubMed] [Google Scholar]
- 29.Schroeder CE, Lakatos P. Low-frequency neuronal oscillations as instruments of sensory selection. Trends Neurosci 32: 9–18, 2009. doi: 10.1016/j.tins.2008.09.012. [DOI] [PMC free article] [PubMed] [Google Scholar]
- 30.Wilson TJ, Foxe JJ. Cross-frequency coupling of alpha oscillatory power to the entrainment rhythm of a spatially attended input stream. Cogn Neurosci 11: 71–91, 2020. doi: 10.1080/17588928.2019.1627303. [DOI] [PMC free article] [PubMed] [Google Scholar]
- 31.Buzsáki G. Neural syntax: cell assemblies, synapsembles, and readers. Neuron 68: 362–385, 2010. doi: 10.1016/j.neuron.2010.09.023. [DOI] [PMC free article] [PubMed] [Google Scholar]
- 32.Butts DA, Weng C, Jin J, Yeh CI, Lesica NA, Alonso JM, Stanley GB. Temporal precision in the neural code and the timescales of natural vision. Nature 449: 92–95, 2007. doi: 10.1038/nature06105. [DOI] [PubMed] [Google Scholar]
- 33.Kayser C, Salazar RF, Konig P. Responses to natural scenes in cat V1. J Neurophysiol 90: 1910–1920, 2003. doi: 10.1152/jn.00195.2003. [DOI] [PubMed] [Google Scholar]
- 34.Besle J, Schevon CA, Mehta AD, Lakatos P, Goodman RR, McKhann GM, Emerson RG, Schroeder CE. Tuning of the human neocortex to the temporal dynamics of attended events. J Neurosci 31: 3176–3185, 2011. doi: 10.1523/JNEUROSCI.4518-10.2011. [DOI] [PMC free article] [PubMed] [Google Scholar]
- 35.Keitel C, Thut G, Gross J. Visual cortex responses reflect temporal structure of continuous quasi-rhythmic sensory stimulation. NeuroImage 146: 58–70, 2017. doi: 10.1016/j.neuroimage.2016.11.043. [DOI] [PMC free article] [PubMed] [Google Scholar]
- 36.Barnes R, Jones MR. Expectancy, attention, and time. Cogn Psychol 41: 254–311, 2000. doi: 10.1006/cogp.2000.0738. [DOI] [PubMed] [Google Scholar]
- 37.Correa A, Nobre AC. Neural modulation by regularity and passage of time. J Neurophysiol 100: 1649–1655, 2008. doi: 10.1152/jn.90656.2008. [DOI] [PubMed] [Google Scholar]
- 38.Breska A, Deouell LY. Neural mechanisms of rhythm-based temporal prediction: delta phase-locking reflects temporal predictability but not rhythmic entrainment. PLoS Biol 15: e2001665, 2017. doi: 10.1371/journal.pbio.2001665. [DOI] [PMC free article] [PubMed] [Google Scholar]
- 39.Dias EC, Foxe JJ, Javitt DC. Changing plans: a high density electrical mapping study of cortical control. Cereb Cortex 13: 701–715, 2003. doi: 10.1093/cercor/13.7.701. [DOI] [PubMed] [Google Scholar]
- 40.Walter WG, Cooper R, Aldridge VJ, McCallum WC, Winter AL. Contingent negative variation: an electric sign of sensori-motor association and expectancy in the human brain. Nature. 203: 380–384, 1964. doi: 10.1038/203380a0. [DOI] [PubMed] [Google Scholar]
- 41.Lawson RP, Mathys C, Rees G. Adults with autism overestimate the volatility of the sensory environment. Nat Neurosci 20: 1293–1299, 2017. doi: 10.1038/nn.4615. [DOI] [PMC free article] [PubMed] [Google Scholar]
- 42.Vanrullen R, Busch NA, Drewes J, Dubois J. Ongoing EEG phase as a trial-by-trial predictor of perceptual and attentional variability. Front Psychol 2: 60, 2011. doi: 10.3389/fpsyg.2011.00060. [DOI] [PMC free article] [PubMed] [Google Scholar]
- 43.Wechsler D. Wechsler Abbreviated Scale of Intelligence (2nd ed.). London: Pearson, 2011. [Google Scholar]
- 44.Lord C, Rutter M, Le Couteur A. Autism diagnostic interview-revised: a revised version of a diagnostic interview for caregivers of individuals with possible pervasive developmental disorders. J Autism Dev Disord 24: 659–685, 1994. doi: 10.1007/BF02172145. [DOI] [PubMed] [Google Scholar]
- 45.Lam KS, Aman MG. The repetitive behavior scale-revised: independent validation in individuals with autism spectrum disorders. J Autism Dev Disord 37: 855–866, 2007. doi: 10.1007/s10803-006-0213-z. [DOI] [PubMed] [Google Scholar]
- 46.Oostenveld R, Fries P, Maris E, Schoffelen JM. FieldTrip: open source software for advanced analysis of MEG, EEG, and invasive electrophysiological data. Comput Intell Neurosc 2011: 156869, 2011. doi: 10.1155/2011/156869. [DOI] [PMC free article] [PubMed] [Google Scholar]
- 47.Hunter JD. Matplotlib: a 2D graphics environment. Comput Sci Eng 9: 90–95, 2007. doi: 10.1109/MCSE.2007.55. [DOI] [Google Scholar]
- 48.Gaillard AWK. Effects of warning-signal modality on the contingent negative variation (CNV). Biol Psychol 4: 139–153, 1976. doi: 10.1016/0301-0511(76)90013-2. [DOI] [PubMed] [Google Scholar]
- 49.Luo H, Poeppel D. Phase patterns of neuronal responses reliably discriminate speech in human auditory cortex. Neuron 54: 1001–1010, 2007. doi: 10.1016/j.neuron.2007.06.004. [DOI] [PMC free article] [PubMed] [Google Scholar]
- 50.Hu L, Xiao P, Zhang ZG, Mouraux A, Iannetti GD. Single-trial time-frequency analysis of electrocortical signals: baseline correction and beyond. NeuroImage 84: 876–887, 2014. doi: 10.1016/j.neuroimage.2013.09.055. [DOI] [PubMed] [Google Scholar]
- 51.Perrin F, Pernier J, Bertrand O, Echallier JF. Spherical splines for scalp potential and current density mapping. Electroencephalogr Clin Neurophysiol 72: 184–187, 1989. doi: 10.1016/0013-4694(89)90180-6. [DOI] [PubMed] [Google Scholar]
- 52.Perrin F, Pernier J, Bertnard O, Giard MH, Echallier JF. Mapping of scalp potentials by surface spline interpolation. Electroencephalogr Clin Neurophysiol 66: 75–81, 1987. doi: 10.1016/0013-4694(87)90141-6. [DOI] [PubMed] [Google Scholar]
- 53.Foxe JJ, Simpson GV. Flow of activation from V1 to frontal cortex in humans. A framework for defining “early” visual processing. Exp Brain Res 142: 139–150, 2002. doi: 10.1007/s00221-001-0906-7. [DOI] [PubMed] [Google Scholar]
- 54.Molholm S, Ritter W, Murray MM, Javitt DC, Schroeder CE, Foxe JJ. Multisensory auditory–visual interactions during early sensory processing in humans: a high-density electrical mapping study. Brain Res Cogn Brain Res 14: 115–128, 2002. doi: 10.1016/s0926-6410(02)00066-6. [DOI] [PubMed] [Google Scholar]
- 55.Maris E, Oostenveld R. Nonparametric statistical testing of EEG- and MEG-data. J Neurosci Methods 164: 177–190, 2007. doi: 10.1016/j.jneumeth.2007.03.024. [DOI] [PubMed] [Google Scholar]
- 56.Zoefel B, Costa-Faidella J, Lakatos P, Schroeder CE, VanRullen R. Characterization of neural entrainment to speech with and without slow spectral energy fluctuations in laminar recordings in monkey A1. NeuroImage 150: 344–357, 2017. doi: 10.1016/j.neuroimage.2017.02.014. [DOI] [PubMed] [Google Scholar]
- 57.Guthrie D, Buchwald JS. Significance testing of difference potentials. Psychophysiology 28: 240–244, 1991. doi: 10.1111/j.1469-8986.1991.tb00417.x. [DOI] [PubMed] [Google Scholar]
- 58.Cohen MX. Analyzing Neural Time Series Data: Theory and Practice. Cambridge, MA: The MIT Press, 2014. [Google Scholar]
- 59.Studebaker GA. A “rationalized” arcsine transform. J Speech Hear Res 28: 455–462, 1985. doi: 10.1044/jshr.2803.455. [DOI] [PubMed] [Google Scholar]
- 60.Ketchen DJJ, Shook CL. The application of cluster analysis in strategic management research: an analysis and critique. Strat Mgmt J 17: 441–458, 1996. doi:. [DOI] [Google Scholar]
- 61.Rousseeuw PJ. Silhouettes: a graphical aid to the interpretation and validation of cluster analysis. J Comput Appl Math 20: 53–65, 1987. doi: 10.1016/0377-0427(87)90125-7. [DOI] [Google Scholar]
- 62.Aickin M, Gensler H. Adjusting for multiple testing when reporting research results: the Bonferroni vs Holm methods. Am J Public Health 86: 726–728, 1996. doi: 10.2105/ajph.86.5.726. [DOI] [PMC free article] [PubMed] [Google Scholar]
- 63.Leavitt VM, Molholm S, Ritter W, Shpaner M, Foxe JJ. Auditory processing in schizophrenia during the middle latency period (10–50 ms): high-density electrical mapping and source analysis reveal subcortical antecedents to early cortical deficits. J Psychiatry Neurosci 32: 339–353, 2007. [Erratum in J Psychiatry Neurosci 32: 438, 2007]. [PMC free article] [PubMed] [Google Scholar]
- 64.Rimmele J, Jolsvai H, Sussman E. Auditory target detection is affected by implicit temporal and spatial expectations. J Cogn Neurosci 23: 1136–1147, 2011. doi: 10.1162/jocn.2010.21437. [DOI] [PMC free article] [PubMed] [Google Scholar]
- 65.Cohen J. Statistical Power Analysis for the Behavioral Sciences (2nd ed.). Hillsdale, NJ: Erlbaum, 1988. [Google Scholar]
- 66.Dumas G, Soussignan R, Hugueville L, Martinerie J, Nadel J. Revisiting mu suppression in autism spectrum disorder. Brain Res 1585: 108–119, 2014. doi: 10.1016/j.brainres.2014.08.035. [DOI] [PubMed] [Google Scholar]
- 67.Murphy JW, Foxe JJ, Peters JB, Molholm S. Susceptibility to distraction in autism spectrum disorder: probing the integrity of oscillatory alpha-band suppression mechanisms. Autism Res 7: 442–458, 2014. doi: 10.1002/aur.1374. [DOI] [PMC free article] [PubMed] [Google Scholar]
- 68.Allen EA, Damaraju E, Plis SM, Erhardt EB, Eichele T, Calhoun VD. Tracking whole-brain connectivity dynamics in the resting state. Cereb Cortex 24: 663–676, 2014. doi: 10.1093/cercor/bhs352. [DOI] [PMC free article] [PubMed] [Google Scholar]
- 69.Calderone DJ, Lakatos P, Butler PD, Castellanos FX. Entrainment of neural oscillations as a modifiable substrate of attention. Trends Cogn Sci 18: 300–309, 2014. doi: 10.1016/j.tics.2014.02.005. [DOI] [PMC free article] [PubMed] [Google Scholar]
- 70.Thut G, Miniussi C, Gross J. The functional importance of rhythmic activity in the brain. Curr Biol 22: R658–R663, 2012. doi: 10.1016/j.cub.2012.06.061. [DOI] [PubMed] [Google Scholar]
- 71.Brandwein AB, Foxe JJ, Butler JS, Russo NN, Altschuler TS, Gomes H, Molholm S. The development of multisensory integration in high-functioning autism: high-density electrical mapping and psychophysical measures reveal impairments in the processing of audiovisual inputs. Cereb Cortex 23: 1329–1341, 2013. doi: 10.1093/cercor/bhs109. [DOI] [PMC free article] [PubMed] [Google Scholar]
- 72.Pirrone A, Dickinson A, Gomez R, Stafford T, Milne E. Understanding perceptual judgment in autism spectrum disorder using the drift diffusion model. Neuropsychology 31: 173–180, 2017. doi: 10.1037/neu0000320. [DOI] [PubMed] [Google Scholar]
- 73.Pirrone A, Johnson I, Stafford T, Milne E. A diffusion model decomposition of orientation discrimination in children with autism spectrum disorder (ASD). Eur J Dev Psychol 17: 213–230, 2020. doi: 10.1080/17405629.2018.1561364. [DOI] [Google Scholar]
- 74.Van der Hallen R, Evers K, Brewaeys K, Van den Noortgate W, Wagemans J. Global processing takes time: a meta-analysis on local-global visual processing in ASD. Psychol Bull 141: 549–573, 2015. doi: 10.1037/bul0000004. [DOI] [PubMed] [Google Scholar]
- 75.Morrison S, Armitano CN, Raffaele CT, Deutsch SI, Neumann SA, Caracci H, Urbano MR. Neuromotor and cognitive responses of adults with autism spectrum disorder compared to neurotypical adults. Exp Brain Res 236: 2321–2332, 2018. doi: 10.1007/s00221-018-5300-9. [DOI] [PubMed] [Google Scholar]
- 76.Amoruso L, Narzisi A, Pinzino M, Finisguerra A, Billeci L, Calderoni S, Fabbro F, Muratori F, Volzone A, Urgesi C. Contextual priors do not modulate action prediction in children with autism. Proc Biol Sci 286: 20191319, 2019. doi: 10.1098/rspb.2019.1319. [DOI] [PMC free article] [PubMed] [Google Scholar]
- 77.Gonzalez-Gadea ML, Chennu S, Bekinschtein TA, Rattazzi A, Beraudi A, Tripicchio P, Moyano B, Soffita Y, Steinberg L, Adolfi F, Sigman M, Marino J, Manes F, Ibanez A. Predictive coding in autism spectrum disorder and attention deficit hyperactivity disorder. J Neurophysiol 114: 2625–2636, 2015. doi: 10.1152/jn.00543.2015. [DOI] [PMC free article] [PubMed] [Google Scholar]
- 78.Goris J, Braem S, Nijhof AD, Rigoni D, Deschrijver E, Van de Cruys S, Wiersema JR, Brass M. Sensory prediction errors are less modulated by global context in autism spectrum disorder. Biol Psychiatry Cogn Neurosci Neuroimaging 3: 667–674, 2018. doi: 10.1016/j.bpsc.2018.02.003. [DOI] [PubMed] [Google Scholar]
- 79.Grisoni L, Moseley RL, Motlagh S, Kandia D, Sener N, Pulvermüller F, Roepke S, Mohr B. Prediction and mismatch negativity responses reflect impairments in action semantic processing in adults with autism spectrum disorders. Front Hum Neurosci 13: 395, 2019. doi: 10.3389/fnhum.2019.00395. [DOI] [PMC free article] [PubMed] [Google Scholar]
- 80.Kinard JL, Mosner MG, Greene RK, Addicott M, Bizzell J, Petty C, Cernasov P, Walsh E, Eisenlohr-Moul T, Carter RM, McLamb M, Hopper A, Sukhu R, Dichter GS. Neural mechanisms of social and nonsocial reward prediction errors in adolescents with autism spectrum disorder. Autism Res 13: 715–728, 2020. doi: 10.1002/aur.2273. [DOI] [PMC free article] [PubMed] [Google Scholar]
- 81.Landa RJ, Haworth JL, Nebel MB. Ready, set, go! Low anticipatory response during a dyadic task in infants at high familial risk for autism. Front Psychol 7: 721, 2016. doi: 10.3389/fpsyg.2016.00721. [DOI] [PMC free article] [PubMed] [Google Scholar]
- 82.Thillay A, Lemaire M, Roux S, Houy-Durand E, Barthélémy C, Knight RT, Bidet-Caulet A, Bonnet-Brilhault F. Atypical brain mechanisms of prediction according to uncertainty in autism. Front Neurosci 10: 317, 2016. doi: 10.3389/fnins.2016.00317. [DOI] [PMC free article] [PubMed] [Google Scholar]
- 83.Barzy M, Black J, Williams D, Ferguson HJ. Autistic adults anticipate and integrate meaning based on the speaker’s voice: evidence from eye-tracking and event-related potentials. J Exp Psychol Gen 149: 1097–1115, 2020. doi: 10.1037/xge0000705. [DOI] [PubMed] [Google Scholar]
- 84.Cannon J, O’Brien AM, Bungert L, Sinha P. Prediction in autism spectrum disorder: a systematic review of empirical evidence. Autism Res 14: 604–630, 2021. doi: 10.1002/aur.2482. [DOI] [PMC free article] [PubMed] [Google Scholar]
- 85.Karaminis T, Arrighi R, Forth G, Burr D, Pellicano E. Adaptation to the speed of biological motion in autism. J Autism Dev Disord 50: 373–385, 2020. doi: 10.1007/s10803-019-04241-4. [DOI] [PMC free article] [PubMed] [Google Scholar]
- 86.Knight EJ, Oakes L, Hyman SL, Freedman EG, Foxe JJ. Individuals with autism have no detectable deficit in neural markers of prediction error when presented with auditory rhythms of varied temporal complexity. Autism Res 13: 2058–2072, 2020. doi: 10.1002/aur.2362. [DOI] [PMC free article] [PubMed] [Google Scholar]
- 87.Krogh-Jespersen S, Kaldy Z, Valadez AG, Carter AS, Woodward AL. Goal prediction in 2-year-old children with and without autism spectrum disorder: an eye-tracking study. Autism Res 11: 870–882, 2018. doi: 10.1002/aur.1936. [DOI] [PMC free article] [PubMed] [Google Scholar]
- 88.Tewolde FG, Bishop DVM, Manning C. Visual motion prediction and verbal false memory performance in autistic children. Autism Res 11: 509–518, 2018. doi: 10.1002/aur.1915. [DOI] [PMC free article] [PubMed] [Google Scholar]
- 89.Hickey P, Merseal H, Patel AD, Race E. Memory in time: neural tracking of low-frequency rhythm dynamically modulates memory formation. NeuroImage 213: 116693, 2020. doi: 10.1016/j.neuroimage.2020.116693. [DOI] [PubMed] [Google Scholar]
- 90.Lakatos P, Shah AS, Knuth KH, Ulbert I, Karmos G, Schroeder CE. An oscillatory hierarchy controlling neuronal excitability and stimulus processing in the auditory cortex. J Neurophysiol 94: 1904–1911, 2005. doi: 10.1152/jn.00263.2005. [DOI] [PubMed] [Google Scholar]
- 91.Beker S, Foxe JJ, Molholm S. Ripe for solution: delayed development of multisensory processing in autism and its remediation. Neurosci Biobehav Rev 84: 182–192, 2018. doi: 10.1016/j.neubiorev.2017.11.008. [DOI] [PMC free article] [PubMed] [Google Scholar]
- 92.Butler JS, Molholm S, Andrade GN, Foxe JJ. An examination of the neural unreliability thesis of autism. Cereb Cortex 27: 185–200, 2017. doi: 10.1093/cercor/bhw375. [DOI] [PMC free article] [PubMed] [Google Scholar]
- 93.Foxe JJ, Molholm S, Del Bene VA, Frey HP, Russo NN, Blanco D, Saint-Amour D, Ross LA. Severe multisensory speech integration deficits in high-functioning school-aged children with autism spectrum disorder (ASD) and their resolution during early adolescence. Cereb Cortex 25: 298–312, 2015. doi: 10.1093/cercor/bht213. [DOI] [PMC free article] [PubMed] [Google Scholar]
- 94.Foxe JJ, Simpson GV, Ahlfors SP. Parieto-occipital approximately 10 Hz activity reflects anticipatory state of visual attention mechanisms. NeuroReport 9: 3929–3933, 1998. doi: 10.1097/00001756-199812010-00030. [DOI] [PubMed] [Google Scholar]
- 95.Fu KM, Foxe JJ, Murray MM, Higgins BA, Javitt DC, Schroeder CE. Attention-dependent suppression of distracter visual input can be cross-modally cued as indexed by anticipatory parieto-occipital alpha-band oscillations. Brain Res Cogn Brain Res 12: 145–152, 2001. doi: 10.1016/s0926-6410(01)00034-9. [DOI] [PubMed] [Google Scholar]
- 96.Welsh JP, Ahn ES, Placantonakis DG. Is autism due to brain desynchronization? Int J Dev Neurosci 23: 253–263, 2005. doi: 10.1016/j.ijdevneu.2004.09.002. [DOI] [PubMed] [Google Scholar]
- 97.Happé F, Frith U. The weak coherence account: detail-focused cognitive style in autism spectrum disorders. J Autism Dev Disord 36: 5–25, 2006. doi: 10.1007/s10803-005-0039-0. [DOI] [PubMed] [Google Scholar]
- 98.Booth RDL, Happé FGE. Evidence of reduced global processing in autism spectrum disorder. J Autism Dev Disord 48: 1397–1408, 2018. doi: 10.1007/s10803-016-2724-6. [DOI] [PMC free article] [PubMed] [Google Scholar]
- 99.Stefanics G, Hangya B, Hernádi I, Winkler I, Lakatos P, Ulbert I. Phase entrainment of human delta oscillations can mediate the effects of expectation on reaction speed. J Neurosci 30: 13578–13585, 2010. [Erratum in J Neurosci 31: 1559, 2011]. doi: 10.1523/JNEUROSCI.0703-10.2010. [DOI] [PMC free article] [PubMed] [Google Scholar]
- 100.Fiebelkorn IC, Foxe JJ, Butler JS, Mercier MR, Snyder AC, Molholm S. Ready, set, reset: stimulus-locked periodicity in behavioral performance demonstrates the consequences of cross-sensory phase reset. J Neurosci 31: 9971–9981, 2011. doi: 10.1523/JNEUROSCI.1338-11.2011. [DOI] [PMC free article] [PubMed] [Google Scholar]
- 101.Henry MJ, Obleser J. Frequency modulation entrains slow neural oscillations and optimizes human listening behavior. Proc Natl Acad Sci USA 109: 20095–20100, 2012. doi: 10.1073/pnas.1213390109. [DOI] [PMC free article] [PubMed] [Google Scholar]
- 102.Lawrance EL, Harper NS, Cooke JE, Schnupp JW. Temporal predictability enhances auditory detection. J Acoust Soc Am 135: EL357–EL363, 2014. doi: 10.1121/1.4879667. [DOI] [PMC free article] [PubMed] [Google Scholar]
- 103.Sun Y, Michalareas G, Poeppel D. The impact of phase entrainment on auditory detection is highly variable: revisiting a key finding. Eur J Neurosci, 2021. doi: 10.1111/ejn.15367. [DOI] [PubMed] [Google Scholar]
- 104.Herbst SK, Obleser J. Implicit temporal predictability enhances pitch discrimination sensitivity and biases the phase of delta oscillations in auditory cortex. NeuroImage 203: 116198, 2019. doi: 10.1016/j.neuroimage.2019.116198. [DOI] [PubMed] [Google Scholar]
- 105.Ng BS, Schroeder T, Kayser C. A precluding but not ensuring role of entrained low-frequency oscillations for auditory perception. J Neurosci 32: 12268–12276, 2012. doi: 10.1523/JNEUROSCI.1877-12.2012. [DOI] [PMC free article] [PubMed] [Google Scholar]
- 106.Zoefel B, Heil P. Detection of near-threshold sounds is independent of EEG phase in common frequency bands. Front Psychol 4: 262, 2013. doi: 10.3389/fpsyg.2013.00262. [DOI] [PMC free article] [PubMed] [Google Scholar]
- 107.Brandwein AB, Foxe JJ, Butler JS, Frey HP, Bates JC, Shulman LH, Molholm S. Neurophysiological indices of atypical auditory processing and multisensory integration are associated with symptom severity in autism. J Autism Dev Disord 45: 230–244, 2015. doi: 10.1007/s10803-014-2212-9. [DOI] [PMC free article] [PubMed] [Google Scholar]
- 108.Ross LA, Del Bene VA, Molholm S, Frey HP, Foxe JJ. Sex differences in multisensory speech processing in both typically developing children and those on the autism spectrum. Front Neurosci 9: 185, 2015. doi: 10.3389/fnins.2015.00185. [DOI] [PMC free article] [PubMed] [Google Scholar]
- 109.Russo N, Foxe JJ, Brandwein AB, Altschuler T, Gomes H, Molholm S. Multisensory processing in children with autism: high-density electrical mapping of auditory-somatosensory integration. Autism Res 3: 253–267, 2010. doi: 10.1002/aur.152. [DOI] [PubMed] [Google Scholar]
- 110.Stevenson RA, Siemann JK, Schneider BC, Eberly HE, Woynaroski TG, Camarata SM, Wallace MT. Multisensory temporal integration in autism spectrum disorders. J Neurosci 34: 691–697, 2014. doi: 10.1523/JNEUROSCI.3615-13.2014. [DOI] [PMC free article] [PubMed] [Google Scholar]
- 111.Stevenson RA, Siemann JK, Woynaroski TG, Schneider BC, Eberly HE, Camarata SM, Wallace MT. Brief report: arrested development of audiovisual speech perception in autism spectrum disorders. J Autism Dev Disord 44: 1470–1477, 2014. doi: 10.1007/s10803-013-1992-7. [DOI] [PMC free article] [PubMed] [Google Scholar]
- 112.Stevenson RA, Siemann JK, Woynaroski TG, Schneider BC, Eberly HE, Camarata SM, Wallace MT. Evidence for diminished multisensory integration in autism spectrum disorders. J Autism Dev Disord 44: 3161–3167, 2014. doi: 10.1007/s10803-014-2179-6. [DOI] [PMC free article] [PubMed] [Google Scholar]
- 113.Obleser J, Henry MJ, Lakatos P. What do we talk about when we talk about rhythm? PLoS Biol 15: e2002794, 2017. [Erratum in PLoS Biol 15: e1002615, 2017]. doi: 10.1371/journal.pbio.2002794. [DOI] [PMC free article] [PubMed] [Google Scholar]
Associated Data
This section collects any data citations, data availability statements, or supplementary materials included in this article.
Supplementary Materials
Supplemental Fig. S1: https://doi.org/10.6084/m9.figshare.14965725.
Data Availability Statement
At the request of the authors, readers are herein alerted to the fact that additional materials related to this manuscript may be found at https://github.com/Shlomit-Beker. These materials are not a part of this manuscript and have not undergone peer review by the American Physiological Society (APS). APS and the journal editors take no responsibility for these materials, for the website address, or for any links to or from it.