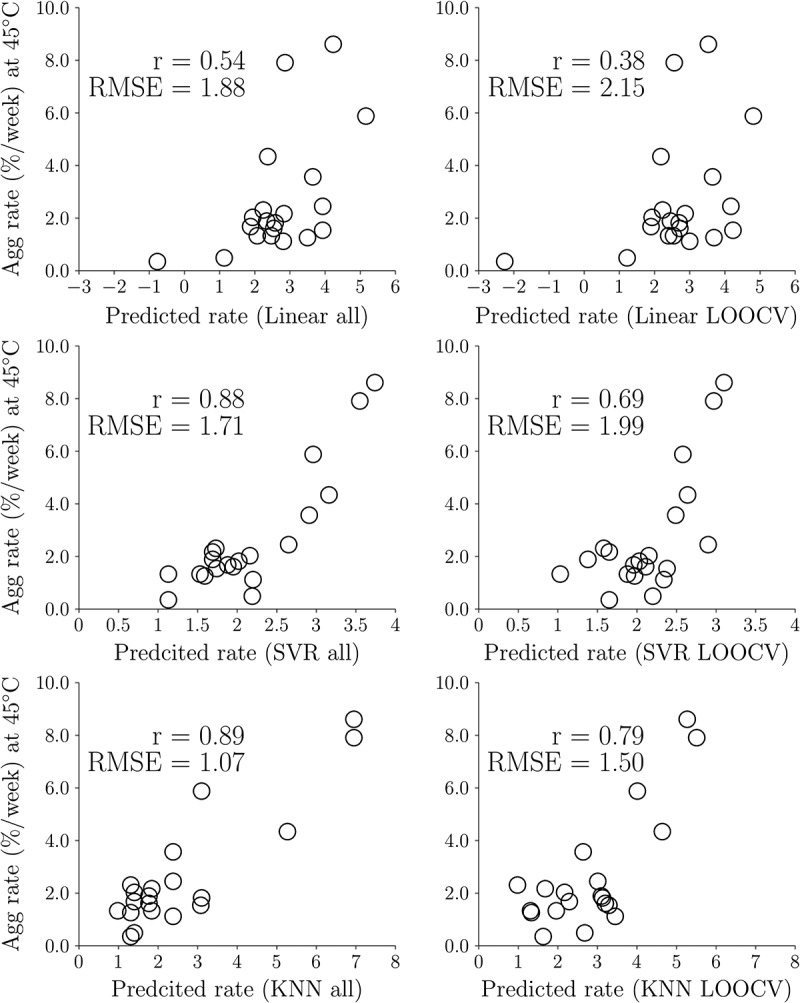
Figure 2.

Correlation coefficients for the best two-feature linear, support vector regression (SVR) and k-nearest neighbors (KNN) regression models trained using all 20 data and LOOCV. The features for the linear regression model are SCM_neg_H2 and SASA_phobic_H3. The features for the SVR and KNN models are both SCM_pos_H2 and SASA_phobic_Fv.
