

ABSTRACT
Metabolic deficits at brain–fluid barriers are an increasingly recognized feature of cognitive decline in older adults. At the blood–cerebrospinal fluid barrier, water is transported across the choroid plexus (CP) epithelium against large osmotic gradients via processes tightly coupled to activity of the sodium/potassium pump. Here, we quantify CP homeostatic water exchange using dynamic contrast-enhanced MRI and investigate the association of the water efflux rate constant (kco) with cognitive dysfunction in older individuals. Temporal changes in the longitudinal relaxation rate constant (R1) after contrast agent bolus injection were measured in a CP region of interest in 11 participants with mild cognitive dysfunction [CI; 73 ± 6 years] and 28 healthy controls [CN; 72 ± 7 years]. kco was determined from a modified two-site pharmacokinetic exchange analysis of the R1 time-course. Ktrans, a measure of contrast agent extravasation to the interstitial space was also determined. Cognitive function was assessed by neuropsychological test performance. kco averages 5.8 ± 2.7 s−1 in CN individuals and is reduced by 2.4 s−1 [ca. 40%] in CI subjects. Significant associations of kco with global cognition and multiple cognitive domains are observed. Ktrans averages 0.13 ± 0.07 min−1 and declines with age [–0.006 ± 0.002 min−1 yr−1], but shows no difference between CI and CN individuals or association with cognitive performance. Our findings suggest that the CP water efflux rate constant is associated with cognitive dysfunction and shows an age-related decline in later life, consistent with the metabolic disturbances that characterize brain aging.
KEYWORDS: Blood-CSF barrier, choroid plexus, DCE-MRI, Na+/K+-ATPase, water transport
Introduction
The choroid plexus (CP) is a monolayer of ciliated epithelial cells supported by a loose, fluid-filled compartment of connective tissue (stroma) and highly permeable blood vessels folded into villi that project into all four ventricles of the human brain (Figure 1a). Tight proteinaceous junctions located near the apical [cerebrospinal fluid (CSF)-facing] surface restrict paracellular diffusion of large solute molecules and confer epithelial cells with barrier properties.1 As the major interface between the vasculature and CSF, the CP participates in a wide variety of central nervous system functions, including maintenance of pH and ionic balance, hormone delivery, paracrine neurotransmission, and mediation of immune responses.2
Figure 1.
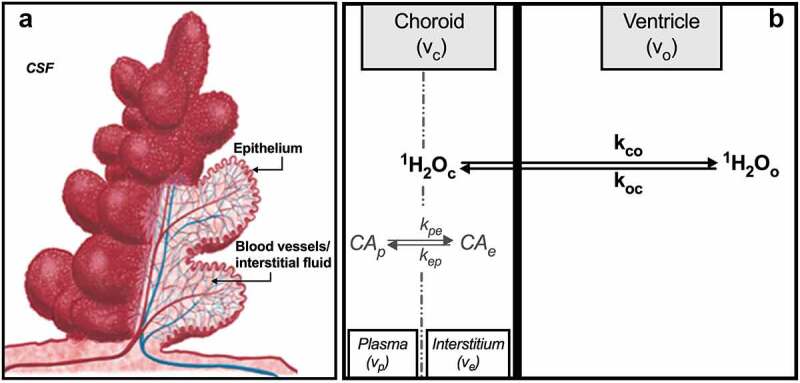
(a) Schematic representation of the CP unit. A single layer of cuboidal epithelial cells is folded into numerous small villi, each with a fluid-filled core of connective tissue richly supplied by blood vessels. Adapted from Oreskovic,3 with permission. (b) Compartments of the CP with chemical equilibria and unidirectional rate constants defined per text. Volumes shown do not reflect relative volume fraction. This illustration is elaborated further in Figure 2.
The CP also plays a key role in CSF production and secretion. Supported by a highly amplified apical surface area, large central nucleus and dense mitochondria, the CP epithelium secretes ca. 0.5 L/day into the adult human ventricles, roughly 10% of the delivered blood volume.4 In the healthy brain, this is a homeostatic process, so that for each molecule of water that is transported into the ventricle another is reabsorbed or leaves by convective flow. The steady-state nature of this exchange is crucial since the entire CSF volume turns over 3–4 times per day and even small disturbances can significantly impact neurologic function.
Despite a variety of experimental approaches and decades of often elegant work, the detailed molecular pathways by which water is transported into the ventricles at the CP against its concentration gradient remain unclear. The relatively low resistance of epithelial junctions5 and presence of a water-permeable claudin isoform6 suggest that paracellular routes cannot be completely excluded. Most likely, though, the majority of water takes a transcellular route across the CP epithelium and in the process employs a wide range of membrane proteins, including water channels (e.g., aquaporin-1) and cotransporters (e.g., NKCC1 (Na+/K+/2Cl−). In the former, transport is driven by osmotic gradients while in the latter, water follows substrate in an energetically demanding transport process.7 In either case, water flux across the CP epithelium is coupled directly to ion transport and, therefore, to the kinetics of Na+/K+-ATPase (NKA), which uses the energy from adenosine triphosphate (ATP) hydrolysis to translocate three intracellular (subscript “in”) sodium ions and two extracellular (subscript “out”) potassium ions across the apical membrane (Figure 2). The forward reaction for the process is shown below:
Figure 2.
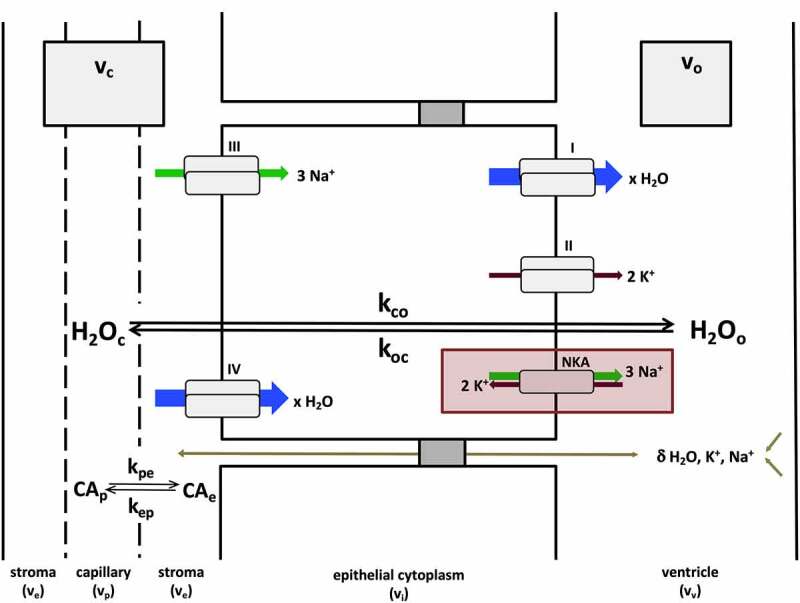
General mechanisms of CP steady-state water exchange. Most water flux at the CP (shown here with unidirectional rate constants kco and koc) is synchronized to the kinetics of NKA-dependent exchange of Na+ and K+ ions at the apical cell membrane (red rectangle). Pathways I–IV describe secondary active processes contributing to water, Na+ and K+ transport (blue, green and brown arrows, respectively) into or out of the cell. These include, but are not limited to, substrate (e.g., Na+, K+, Cl−, glucose) coupled co-transport of water at the apical (i) and basolateral (IV) membranes, potassium channels (II), some of which are voltage-gated (KCC4, Kv1.1, Kv1.4, Kir7.1), and Na+-coupled bicarbonate transporters (III) (e.g., NCBE, NBCe2).8 The arrow size of pathways I–IV is meant to convey the relative contribution of each to the overall flux, but is not quantitatively to scale. Paracellular transport, via claudin-2 pores or ependymal drainage of interstitial fluid, also contributes to water and ion fluxes, but likely represents a relatively minor contribution.6 These routes (olive arrow) are indicated with a δ.
The importance of NKA in water transport at the CP is underlined by the 50–80% decrease in CSF production in rabbits, cats and dogs after inhibition of NKA activity by intraventricular perfusion of ouabain.9
In humans, the molecular details underlying ATP hydrolysis have been examined using a variety of molecular imaging techniques, including hyperpolarized 13C-MR spectroscopy10 and positron emission tomography.11,12 However, given the ubiquity and functionally diverse nature of P-type ATPases, the utility of these approaches as specific probes of the NKA pump is limited. In comparison, dynamic contrast-enhanced (DCE) MRI is based on the water proton (1H2O) signal and has been shown to yield a cellular water efflux rate constant that is responsive to experimentally controlled levels of NKA activity in a wide variety of model systems (tabulated in ref. 13). In an important extension of these results, Rooney et al.14 combined DCE-MRI and literature 31P MR spectroscopic results to interpret in vivo water exchange kinetics in the human brain. Their findings show that the rate constant for capillary water efflux tracks ATP production/consumption and declines in hypometabolic regions of the brain. Taken together, these studies suggest that water cellular and capillary efflux rate constants as measured by DCE-MRI may represent high-resolution biomarkers of metabolic transport activity.
Metabolic abnormalities are characteristic features of brain aging. Mitochondrial defects and accumulated oxidative damage impair function and hinder processes that reduce deleterious effects on ATP production.15 Moreover, gene expression studies suggest that mitochondrial damage plays a major role in cognitive decline.16 In the parenchyma, metabolically driven changes in hemodynamic latency,17 blood flow regulation18 and capillary integrity19 have been demonstrated in older individuals with reduced cognitive function. At the CP, mitochondrial aging has been less widely studied. Nevertheless, the decreased expression of glucose transporter proteins and dehydrogenases important in glucose metabolism,20 combined with reduced NKA activity, Na+ flux and CSF secretion21,22 suggest that metabolic transport activity may be altered in the aged CP and may contribute to the cognitive decline that frequently accompanies brain aging. Here, we investigate homeostatic water exchange in the CP and examine the extent to which it is associated with cognitive dysfunction in older individuals.
Materials and methods
(a) DCE-MRI and Pharmacokinetic Modeling
DCE-MRI is based on temporal changes in the 1H2O longitudinal relaxation rate constant (R1 ≡ 1/T1) associated with bolus injection of a paramagnetic contrast agent (CA). Mathematical fitting of a pharmacokinetic model of tissue architecture to the R1 time-course, R1(t), then yields physiological parameters that can be interpreted at the cellular level. A widely used (‘standard’) model (SM)23 partitions tissue into two compartments (vascular and extravascular) and yields estimates of the CA extravasation rate constant distribution volume product (Ktrans). While analytical interpretation of R1(t) using the SM has afforded insight into a wide variety of pathological conditions,24,25 the model implicitly treats equilibrium water exchange as though it is effectively infinitely fast. For many physiological states, this assumption is not valid and has important implications for the nature and accuracy of estimated parameters.
Detailed descriptions of the effects of water exchange kinetics on the time-course of the DCE-MRI signal have been presented.26–28 Here, we briefly outline the salient features, as applied to the CP. Ignoring the small volumes of epithelial and red blood cells, three major water-containing compartments can be reasonably defined in and around the CP: blood vessels, interstitiums and ventricles (Figure 1b). Water molecules access and exchange between all three. However, the fenestrated vessels of the CP, which permit extravasation of even large solutes, are unlikely to restrict access of small water molecules. Thus, the number of distinct water-containing sites is effectively reduced to two: a ‘choroid’ compartment with volume fraction (vc) equal to the sum of the plasma (vp) and interstitium (ve) volume fractions and a ventricular (‘outside’) compartment with volume fraction vo, i.e., vc + vo = 1. Contrast agent also occupies two compartments. However, since common gadolinium(III) chelate-based CAs do not penetrate cell membranes,29 CA is restricted to and exchanges only between plasma and the interstitial space with rate constants kpe and kep (Figures 1b and Figures 2). This difference in the compartmental distributions of water (from which the MR signal arises) and CA (which catalyzes 1H2O relaxation) has important implications for DCE-MRI experiments. Longitudinal magnetization recovery is dependent on short-range (dipole–dipole) interactions and requires direct (transient) coordination of water molecules to CA molecules.30 But since water is distributed in the choroid and ventricular compartments and CA is restricted to the choroid, most water molecules must access CA via exchange equilibria across the epithelial membrane. As a result, the mathematical behavior of R1(t) depends on the relative rate constants of CA-water molecular interactions within the choroid compartment and equilibrium water exchange between choroid and ventricular compartments. If the latter is sufficiently infrequent compared to CA-water molecular interactions, the dependence of R1(t) on choroid CA concentration, [CAc], will be non-linear, and fitting R1(t) as CA passes through the field of view with an appropriate two-site physiological exchange model will yield the rate constant for intercompartmental water exchange. The shutter-speed family of models incorporate equilibrium exchange effects in their pharmacokinetic derivation and, in so doing, have led to important insights into a variety of pathologies.31–34
The mathematical formulation of the two-site shutter-speed model (SSM) is shown in Eqn. [1]. Here, R1o0 and R1c0 are the intrinsic 1H2O relaxation rate constants in the ventricle and choroid compartments in the absence of exchange. r1c and [CAc] are the CA relaxivity and concentration, respectively, in the choroid compartment and koc is the unidirectional rate constant for steady-state influx of water molecules from the ventricle. This equation holds for the small shutter speed condition, i.e., . In this condition13, relaxation is always mono-exponential and R1(t) remains single-valued. Ignoring the contribution from blood red cell water volume, the rate constant for steady-state water influx from the ventricle to the choroid compartment, koc, can then be calculated from mass balance considerations .
| (1) |
To fit the entire R1(t) time-course, Eqn. [1] is combined with a pharmacokinetic rate law that describes the time-dependent change in the interstitial CA concentration ([CAe](t)) as CA exchanges between plasma and interstitial fluid (Eqn. [2]).35 Here, Ktrans is the pseudo-first-order rate constant/volume fraction product for CA transfer from blood plasma to the interstitial space or vice-versa, i.e., (Figure 1), and [CAp](t) is the time-dependent plasma CA concentration. The latter can be estimated from the R1 time-course in a voxel(s) containing only blood using Eqn. [3]. Here, is the blood CA relaxivity, h is the hematocrit, and R1b0 is the R1 value in blood before CA arrival. Equations [2] and [3] constitute the SM.
| (2) |
| (3) |
(b) Study Participants
Forty-two individuals were recruited from the NIA- Layton Aging & Alzheimer’s Clinic and the NINDS NeuroNEXT Registry at Oregon Health & Science University. All participants underwent clinical interview, including health history, neurological examination, and routine laboratory testing. In addition, the Mini-Mental State Examination (MMSE)36 and neuropsychological tests of memory (Wechsler Memory Scale-Revised (WMS-R) Logical Memory II37 and Consortium to Establish a Registry for Alzheimer’s Disease Word List38), attention/processing speed (Trail Making Test, Parts A and B,39 and Symbol Digits Modalities Test (SDMT)40), and language (category (animals) and letter (Controlled Oral Word Association) fluency41,42) were administered to all subjects. Individuals with normal cognition, mild cognitive impairment or early Alzheimer’s disease were enrolled. Individuals with Parkinson’s disease, vascular or other dementia or psychiatric condition that could account for the cognitive decline were not enrolled. Participants with diabetes, uncontrolled hypertension, cardiovascular disease, or history of transient ischemic event/stroke, brain cancer, or significant head trauma were also excluded. Participants had no current contraindications to MRI. One subject declined participation after completion of clinical procedures due to unanticipated MRI-related claustrophobia. A measurable R1 time course in blood and/or CP could not be obtained in 2 subjects due to severe motion during the DCE acquisition. Altogether, a total of 39 participants provided complete study data and were included in analyses (Table 1).
Table 1.
Demographic and clinical characteristicsa
| Characteristic | CI (N = 11) | CN (N = 28) | pb |
|---|---|---|---|
| Age (yrs) | 73.4 ± 5.6 | 71.8 ± 6.5 | .45 |
| Sex (N, % female) | 3 (27) | 14 (50) | .29c |
| Education (yrs) | 18 ± 2 | 16 ± 3 | .11 |
| Volume, parenchyma (%)d | 65 ± 6 | 72 ± 8 | .009 |
| Volume, lateral ventricles (%)d | 3.3 ± 1.1 | 2.4 ± 1.0 | .036 |
| MMSE | 23 ± 2 | 29 ± 1 | <.0001 |
aMean (± SD) or frequency (%); bt-test or Wilcoxon rank sum test; cFisher’s exact test; dNormalized to intracranial volume
Group assignment was based on the MMSE, a widely used composite measure of cognitive function. Among highly educated individuals like the participants of this study (17 ± 2 years of education), an MMSE score of 26 or lower has been shown to identify cognitive impairment correctly in 90% of individuals.43 Accordingly, individuals with an MMSE score less than 27 (N = 11) were assigned to the cognitively impaired (CI) group; those with an MMSE score of at least 27 (N = 28) were assigned to the cognitively normal (CN) group. Demographic and clinical characteristics of study participants are shown in Table l. CI subjects show decreased parenchymal and increased ventricular volumes, but are otherwise radiologically indistinguishable from CN participants.
(c) MR Measurements
Data were acquired using a 7Tesla MRI instrument (Siemens, Erlangen, Germany) with quadrature transmission and 24-channel phased-array receive head coils. Pre-contrast R1 (R10) values were determined from a series of standard T1-weighted gradient echo (GRE) images with inversion times (TIs) of 0, 200, 600, or 1800 ms [other imaging parameters: repetition time (TR) 2500 ms; echo time (TE) 2.1 ms; flip angle (FA) 8°; 1 mm2 in-plane resolution; 2.5 mm nominal slice thickness]. Dynamic measurements employed a fast 3D GRE (FLASH) sequence with slab-selective excitation and TR/TE = 2.9/1.4 ms. A 10° FA was chosen to optimize sensitivity of the sequence to water exchange effects while preserving reasonable signal-to-noise (SNR) and contrast-to-noise.44 Each dynamic volume consisted of 40 axial slices (5 mm nominal thickness) with (2 mm)2 in-plane spatial resolution resulting in a 20 μL voxel volume (2x2x5 (mm)3). The inter-sampling interval was 3.51 s. After collection of the third image volume, a 0.10 mmol/kg bolus of gadoteridol (Bracco, Inc., Princeton, NJ, USA) was injected at 2.5 mL/s into an antecubital vein using a power injector (Medrad, Warrendale, PA, USA) followed by a 20-mL saline flush. Total acquisition time was 9–10 minutes. SNR of the dynamic acquisition was calculated as the quotient of the mean signal intensity of the fourth image and the standard deviation (SD) of intensity values on a difference image formed by subtraction of the third and fourth images.45 Choroid plexus SNR averaged 70 (± 18).
Parenchymal and lateral ventricle volumes were determined from an anatomical skull-stripped, bias-corrected46 T1-w gradient echo image (TR/TE/TI = 2200/3.1/1050 ms; FA = 7°; (0.7 mm)3 resolution) using FreeSurfer, v. 5.1 (http://surfer.nmr.mgh.harvard.edu). Variation in morphometric estimates due to head size was corrected by normalization to total intracranial volume. Proton density (PD) (TR/TE = 200/1.4 ms; in plane resolution = (2 mm)2, nominal slice thickness = 5 mm) and T2-weighted fluid-attenuated inversion recovery (FLAIR) images (TR/TE/TI = 8000/386/2150 ms; FA = 120°, (0.8 mm)3 resolution) were acquired for image processing and region-of-interest (ROI) analysis.
(d) Image Processing and Analysis
To facilitate ROI selection, anatomic and dynamic images from each subject were registered to the corresponding PD image using FSL tools47,48 (Figure 3). Since quantitative measures of registration accuracy (e.g., mean square error of intensity differences or distance between anatomical features on an image of interest and reference) can be difficult to interpret, registration quality was assessed by visual inspection. Particular attention was paid to pixels at fluid–tissue interfaces and skull boundaries, where errors were within (2 mm)2 (1 pixel).
Figure 3.
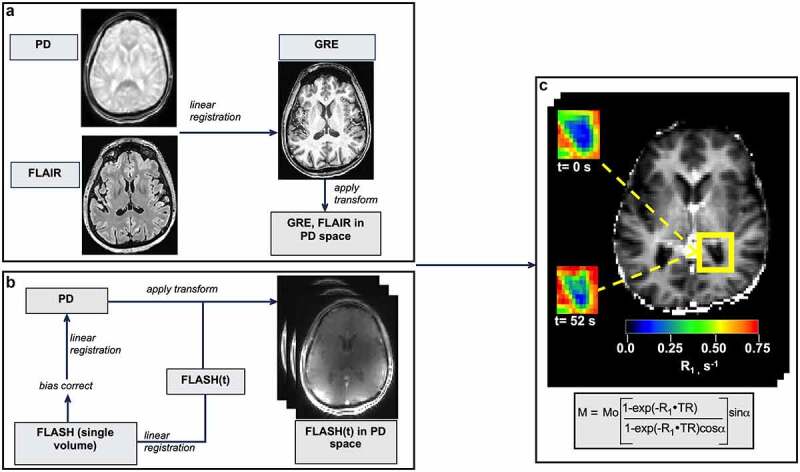
Image processing. (a) Brain-extracted high-resolution T1-w GRE and FLAIR images were bias field corrected, co-registered and brought into PD space. (b) Dynamic FLASH volumes were first registered to the image at the temporal center of the acquisition. In a second step, this skull-stripped, bias-corrected image was registered to the PD image and the transform applied to each volume in the FLASH series. (c) A representative R1(t) map, prepared by fitting dynamic FLASH volumes to the GRE signal intensity equation (shown in rectangle). Insets: R1 maps of the posterior horn (outlined in yellow) before (upper) and 52 seconds after (lower) CA injection. CP-containing voxels show a clear R1 increase after CA arrival.
R1(t) maps were prepared by non-linear least-squares curve fitting (Levenberg-Marquardt) of the GRE signal intensity equation (Figure 3c) to FLASH signal intensities, assuming complete spoiling of T2* magnetization.49 Initial estimates of proton spin density (M0) and R10 used in R1(t) map preparation were obtained from voxel-wise fittings of the Bloch rate law for longitudinal relaxation to the pre-contrast variable TI GRE data sets, accounting for all RF pulses and delays and assuming monoexponential inversion-recovery.50
Bilateral ROIs (0.39 ± 0.13 mL) were manually placed in the choroid glomus, a prominent portion of the CP at the junction of the body and posterior horn of the lateral ventricle.51 Partial volume contributions were minimized by exclusion of voxels with maximum R1 increase less than 0.05 s−1 above pre-CA values and a signal intensity on the FLAIR image less than twice that of CSF. Care was taken to avoid boundaries with parenchyma and gross vasculature. To reduce bias, ROIs were selected by two investigators (VCA, AD) with discrepancies resolved by consensus. Ktrans, vc, and kco were obtained using Eqns. [2–3] and fitting Eqn. [1] to ROI-average R1(t) values using a non-linear, least-squares gradient expansion algorithm (SciPy v 0.17.0, http://www.scipy.org). Reasonable values of h and r1b were assumed (0.4 and 3.3 mM−1 s−1, respectively).52 Goodness of fit was assessed by l2-norm.
Temporal features of the blood time-course, R1b(t), were estimated after means clustering of R1 values in the superior sagittal sinus. Voxels with no apparent partial volume or signal saturation effects (typically 5–15 pixels) were selected along the length of the sinus from the superior to inferior aspect and k-means clustering algorithms applied, as detailed by Mouridsen and colleagues.53 The maximum number of clusters was set to 3. Voxel-wise values of peak ΔR1b(t) (R1b(t) – R1b0) and full-width half-maximum (FWHM) were determined for each cluster. The cluster with the largest ΔR1b/FWHM was used to estimate the vascular output function. A temporal correction, averaging 3.9 ± 1.7 sec, was simultaneously optimized in each ROI fitting as an additional free parameter to correct for delay in the onset of venous signal changes.
Uncertainty in parametric estimates was investigated using Monte Carlo simulation. Random noise, estimated by sampling a uniformly distributed random number distribution with a mean of zero and standard deviation equal to the R10(t) standard deviation, was added to CP ROI R1 time course data. Pharmacokinetic estimates were then obtained by fitting Eqn. [1] to the newly constructed time-course. ROI parametric accuracy assessed as the percent difference in experimental and simulated mean values, and precision (coefficient of variation, COV) was computed based on 1000 trial runs per ROI.
(e) Statistical methods
Statistical analyses were performed in Stata (Statacorp, v 16, College Station, TX). Data are summarized as frequencies (%) or means (± SD). Associations were examined using analysis of variance or linear regression. Adequacy of linear models was assessed by residual plots. Influence of data points with extreme values was examined using difference-in-fits and Cook’s distance measures.54 Robust variance estimation procedures were used to minimize the effect of influential points on regression estimates.55 Goodness-of-fit was assessed by coefficient of determination (R2). P values were calculated at the 0.05 significance level in two-tailed tests and are uncorrected for multiple comparisons.
Results
A representative R1 time-course from a CP ROI is shown in Figure 4a. The contemporaneous sagittal sinus [R1b] plot is also shown (right inset). The rapid and sustained increase in CP R1 values (2–3% of the maximum R1b change) in the early portion of the curve (t < ca. 40 sec) is consistent with extravasation of CA into the interstitial space. The relationship between the change in baseline (pre-CA) R1 values in the CP and blood (ΔR1 and ΔR1b, respectively) is shown in Figure 4b. The plasma CA concentration ([CAp]) calculated from Eqn. [3] is shown along the upper abscissa. As indicated by the dashed line, linearity of R1 and [CAp]
Figure 4.
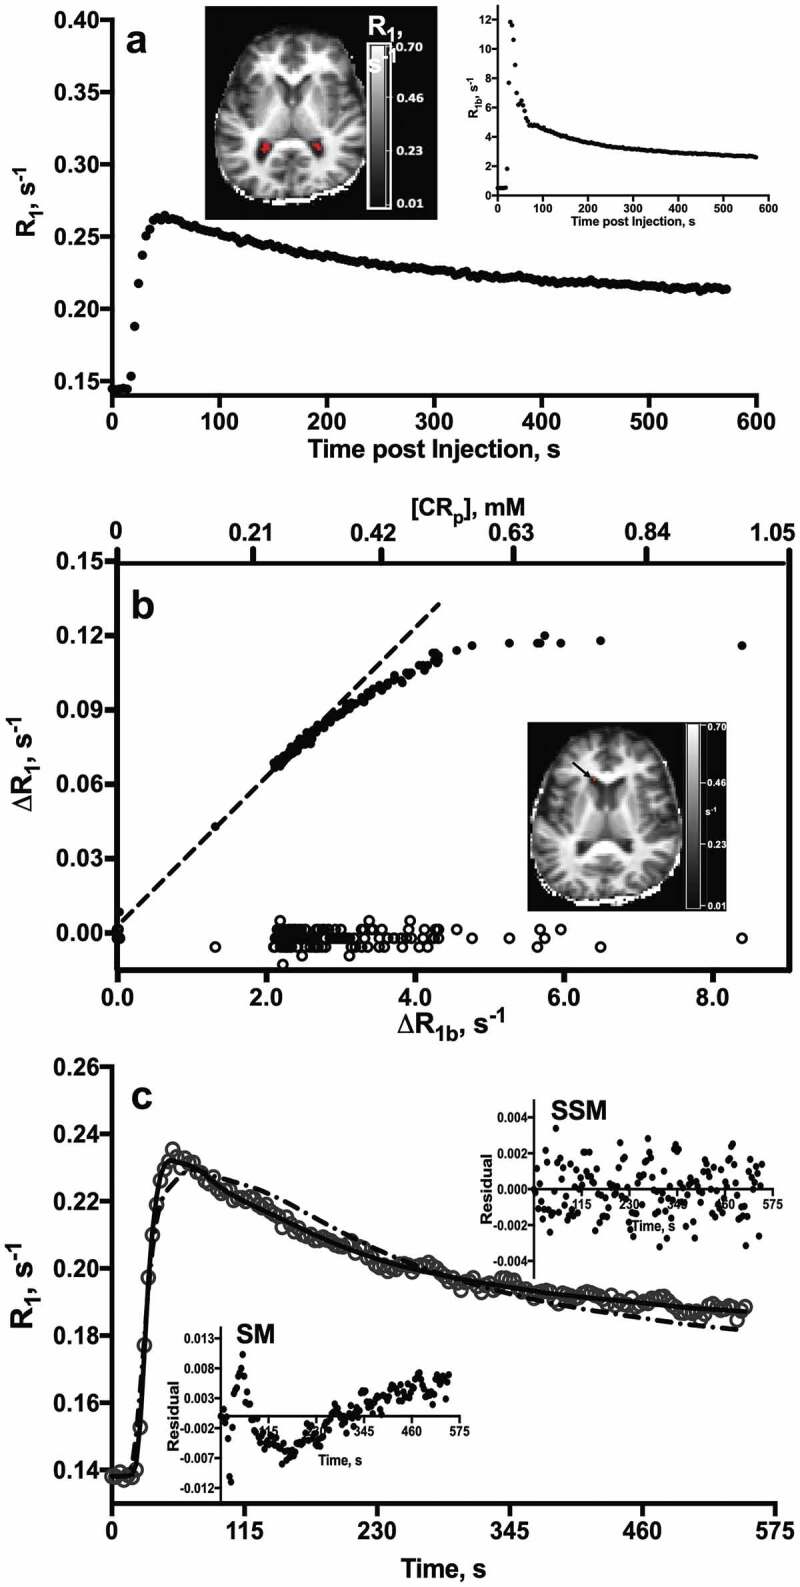
Representative CP R1(t) behavior. (a) Time-course of CP ROI (19 voxels; 0.38 mL) R1 values after CA injection in a 64 year-old CN subject. R1 map (upper left) shows the ROI (red) from which data were obtained. R1 values in the sagittal sinus (R1b) are plotted at upper right. (b) Time-course of R1 changes (ΔR1) in the CP (∙) and CSF (o) after CA arrival. Plasma CA concentration, [CAp], is shown along the upper axis. Inset: R1 map. Arrow shows the ROI from which CSF R1 values were measured. (c) Fittings of SSM (_, Eqn. [1]) and SM (– -, Eqns. [2] and [3]) models to the CP R1 time-course from a 77 year-old CI subject. Insets: Residual plots from SSM (upper) and SM (lower) model fittings. Note the randomness and constant spread of residuals about the horizontal y = 0 line and more negative minimum of the AIC in the SSM fitting.
holds only at low [CAp] (less than ca. 0.3 mM); at higher concentrations, the relationship is distinctly non-linear, with R1 becoming essentially independent of [CAp] at concentrations greater than ca. 0.5 mM. In terms of panel A, this condition corresponds to the immediate post-injection period (large [CAp]) and early wash-out phase. The non-linearity, observed in a variety of human tissues, has been shown to be a direct result of intercompartmental water exchange kinetics.26,34 Figure 4b also shows the analogous plot from an ROI in an anterior horn of the lateral ventricle, a region free of CP. Consistent with our previous findings,56 the ΔR1 here shows no appreciable change during CA bolus passage, confirming that CA leakage into the ventricle is negligible during the ca. 10 minute DCE acquisition.
Figure 4c displays the best fittings of the SSM (solid) and SM (dotted) models to R1 time-course data from a 77-year-old subject. The reduced Akaike Information Criterion (AIC) of the SSM model (-1959 cf. -1572, SSM and SM, respectively) confirms the increased suitability of the SSM (Eqn. [1])).57 Residual plots are shown in figure insets. In contrast to the random pattern and constant spread about the horizontal null line of the SSM fitting residuals (upper inset), the pattern of SM residuals demonstrates that the model systematically underestimates R1 values shortly after injection, when [CAp] is high, and over- or under-estimates them to varying degrees at later times, as CAp washes out. The inability of SM to account for this time-dependent R1 behavior has been shown to be a direct result of its failure to incorporate intercompartmental water exchange rate constants during CA bolus passage.28
Table 2 summarizes the pharmacokinetic parameter estimates obtained from SSM fittings. kco averages 5.8 ± 2.7 s−1 and is decreased 35−40% in CI compared to CN individuals.
Table 2.
CP pharmacokinetic estimates
| Parameter | N = 39 a | CI (N = 11) b | CN (N = 28) b | pc |
|---|---|---|---|---|
| Ktrans, min−1 | 0.13 ± 0.07 | 0.12 ± 0.02 | 0.13 ± 0.01 | .59 |
| vc, mL 100 g−1 | 5.4 ± 2.0 | 5.3 ± 0.6 | 5.4 ± 0.4 | .89 |
| kco, s−1 | 5.8 ± 2.7 | 3.9 ± 0.3 | 6.6 ± 0.5 | .005 |
aMean (± SD); b Mean (± SE); c t-test or Wilcoxon rank sum test
Declining kco values with age are also observed (Figure 5a). Both age and group are significant predictors of kco (R2 = 0.25; β (group) = -2.40, p = .007; β (age) = -0.136, p = .033) in multivariable models. kco shows a mild to moderate correlation with MMSE (R2 = 0.214, p = .019) and performance on several cognitive tasks in age-adjusted cohorts, including logical memory recall (Figure 5b), category fluency (Figure 5c) and SDMT (Figure 5d).58 Ktrans values range from 0.04 to 0.31 min−1 and are strongly correlated with age (R2 = 0.27; β = -0.006, p = .001) (Figure 5a, lower). While Ktrans is reduced by ca. 10% in CI compared with CN individuals, group differences are not significant after adjusting for age (R2 = 0.27, F(2, 36) = 6.69; β (age) = -0.006, p = .001; β (group) = -0.004, p = .84). No association of Ktrans with any cognitive measure is observed.
Figure 5.
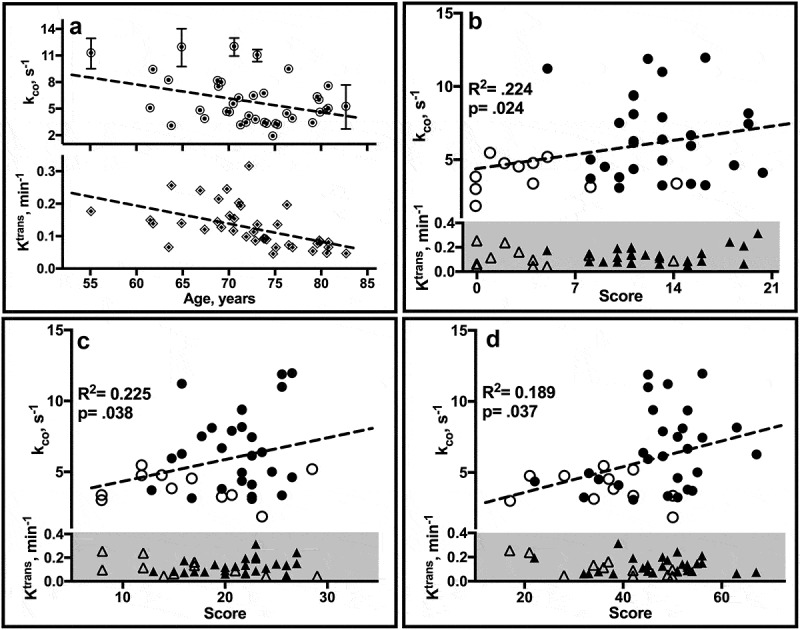
Estimate correlates. (a) Linear regression plots of individual ROI estimates of kco (↑ upper) and Ktrans (◊, lower) by age. Error bars, not all of which are visible on the scale of the plots, reflect SD. (b-d) Plots of mean kco and Ktrans values by neuropsychological test score in CN (filled) and CI (open) individuals. WMS-R Logical Memory II (b) tests verbal recall of a short story after a 30-minute delay. The score is the number of story units recalled, ranging from 0 to 25. The category fluency task (c) requires subjects to name as many unique animals as possible within 1 minute. The SDMT (d) requires subjects to match symbols to numbers according to a provided key. The score is the number of correct matches made in 90 sec. R2, F statistic and p (group) from age-adjusted linear regression analyses are shown.
Discussion
Our results show that kco declines with age, is markedly reduced in CI compared to CN individuals and is associated with impairment in multiple cognitive domains, including verbal memory, processing speed and verbal fluency. Given that CP water efflux is driven primarily by active transport processes and that age-related cognitive decline is frequently accompanied by metabolic abnormalities, our findings suggest that the reduced kco in CI individuals may reflect energetic compromise at the blood-CSF barrier.
From a pharmacokinetic perspective, kco is equivalent to kpo, the steady-state rate constant for parenchymal capillary water efflux in the parenchyma since in both cases water is moved from blood to an ‘outside’ (ventricular or interstitial) fluid. Previous diffusion-weighted arterial spin labeling (ASL)59 and DCE-MRI14,60 studies have found kpo to be ca. 3 s−1 in healthy brain capillaries. That the kco measured here is roughly twice as large may be a consequence of functional differences in cell types that modulate water exchange in the CP and cerebral microvessels. Unlike parenchymal endothelial cells, CP epithelial cells are uniquely specialized for water transport.2 ,61 Thus, despite their relatively small numbers, they produce a substantial, if not majority, of the CSF. In this context, the increased magnitude of kco compared to kpo may reflect differences in water transport demands at the blood-brain and blood-CSF barriers. Variation in water exchange rate constants between cell types has been noted previously in cell culture.62
It is important to note that kco is not by itself a measure of secretion. It is a unidirectional rate constant, distinct from the CSF production rate (net flux) which incorporates contributions from brain interstitial fluid through the ependyma and pia-glia limitans. Nevertheless, since most of the water delivered to the epithelium is transported into the ventricle, biologic plausibility demands kco be of sufficient magnitude to produce a water flux sufficient to generate CSF at known production rates. In humans, the absolute magnitude of water flux and secretion at the CP is unknown; however, the former can be estimated from our data. For a cuboidal cell with sides ca. 10 μm in length (the average dimensions of a CP epithelial cell63) and, thus, an average volume of 1 pL per cell, there are approximately 106 cells in a 1 (mm)3 (1 μL) imaging voxel. At 50 M H2O, each 1 pL cell contains roughly 3×10¹³ H2O molecules. Therefore, in the absence of cell shrinkage or swelling (i.e., steady state), the estimated efflux per cell is the product of the number of H2O molecules per cell and the efflux rate constant (5.8 s−1), ca. 1.7 × 10¹⁴ H2O molecules/cell/s. The rate of CSF secretion in humans is ca. 4.2 μL/g/s.64 Assuming a tissue density of 1 g/mL, the CSF production rate per cell can be calculated as the product of the volume (in μL) of fluid secreted (4.2 x 10⁻⁹ μL/s/cell) and the number of H2O molecules/μL (3 x 10¹⁹), ca. 1.2 × 10¹¹ H2O molecules per cell per s. Thus, in combination with reasonable physiological parameters, our measured kco estimate provides evidence for a unidirectional (blood to CSF) homeostatic water flux that not only accounts for, but is ca. three orders of magnitude higher than the net flux; only one in a thousand water molecules cycled in the epithelium is transported into the CSF without compensation. An illustration of this is shown in Figure 2. This result is consistent with analogous calculations in the kidney and intestine, where it has been estimated that 175 water molecules must be transported per ion or other substrate molecule to maintain isotonicity with the surrounding plasma.7
In addition to water exchange rate constants, our study also yields Ktrans, the volume transfer rate for CA extravasation. The relatively large Ktrans (>0.10 min−1) is comparable to that found in angiogenic vascular tumor beds and is consistent with the fenestrated endothelial cells, thin endothelial basement membrane and densely packed capillary network of the CP. Not unexpectedly, our estimate is considerably higher than the 0.003 min−1 estimated previously using DCE-MRI and a standard pharmacokinetic model.65 While absolute parameter values cannot be used as accuracy criteria, Li et al. have shown that pharmacokinetic models that do not incorporate exchange effects invariably underestimate Ktrans.66
Although not a primary aim of our study, our results also show an age-related decline in Ktrans among study participants. Previous studies have revealed marked changes in aged CP epithelium and arterial walls,20,67 but age-related effects on CP microvessels have not been well characterized. It is possible that the reduced Ktrans in older individuals observed here reflects decreased microvascular permeability, as suggested by a previous T2*-weighted (DSC) MRI study.68 However, Ktrans also includes contributions from blood flow and in the CP, where both permeability and flow are high, determination of the major contributor can be difficult. Our modeling approach does not account for individual variation in blood flow. However, using ASL, Evans et al. recently found a 13% reduction in CP perfusion in older compared to younger mice.69 Further studies will be necessary to clarify the physiologic process(es) responsible for the age-related changes in Ktrans observed here. Whatever their nature, our finding of only a marginal difference between CI and CN individuals suggests that it is unlikely to have a large impact on cognitive function.
Taken together, our data provide unique insight into water exchange at the human CP. However, our interpretation (like that of any DCE-MRI study) depends strongly on methodological details. Of particular importance in this regard is the pharmacokinetic model used to describe signal changes. As applied to the CP, the two-site SSM implicitly assumes that the epithelial cell volume is effectively zero and that water exchange within the choroid compartment is infinitely fast. The first assumption is equivalent to compressing the basal and apical epithelial cell membranes into a single transport barrier. Given the relative volumes, neglect of the intracellular volume as a separate water pool is unlikely to have a large effect on the DCE signal. However, our interpretation of kco as a metric of active water cycling could be affected if water flux at the basolateral membrane, about which little is known, is rate-limiting or involves a significant contribution from passively driven transport processes.7 An additional assumption of our model is that diffusion within the choroid compartment is isotropic and water exchange is fast on the nuclear magnetic resonance time scale. For the most part, the stroma is characterized by large aqueous spaces. Collagen fibrils and cellular debris are also present, but are unlikely to present diffusional hindrances or compromise the validity of Eqn. [2]. However, cells, primarily meningocytes and macrophages, are also present,70,71 although concentrations are not expected to be high in healthy adults. Nevertheless, CA does not penetrate cell membranes.72 Thus, if transmembrane exchange between intracellular and interstitial water is not sufficiently fast in the choroid compartment, fitting a two-site model to the early time portions of the DCE time-course (from which Ktrans and vc are determined) could compromise parametric accuracy. Fitting the data to a three-site exchange model could be extremely informative in this regard. As pointed out previously though, the number of parameters in pharmacokinetic models applied to DCE data increases with the number of compartments, placing additional demands on the SNR and temporal resolution of the acquisition.27 In addition, the extra fitting parameters introduced by a more complicated model is likely to impact the precision of existing fitting parameters. In the present study, sequences were optimized to provide good spatial and temporal resolution of the small and relatively slow CP signal changes in the later part of the DCE time course. However, sparse sampling and related image reconstruction techniques are used with increasing frequency to accelerate DCE-MRI. In combination with two-site exchange modeling, these approaches could clarify CA exchange kinetics during the first pass and provide improved estimates of Ktrans and vc. Finally, the effect of partial volume errors on our interpretations must be considered. Partial volume contributions to the blood signal were minimized by using the signal from the superior sagittal sinus to approximate the blood time course. In addition to the relatively low flow compared to arterial blood, the sagittal sinus experiences an effective flip angle that is typically even smaller than the nominal flip angle defined at the center of the brain and provides a relatively large area from which to measure blood signal changes.73,74 In tissue, partial volume errors arise from signal mixing with adjacent parenchymal tissue and CSF. Most reasonably, our use of a 3D sequence and ROI selection that carefully avoided adjacent tissue or voxels with minimal R1(t) changes limited these errors. However, we did not correct for CSF partial volume contributions within the ROI which, based on our estimates from 3-class segmentation, approach 50% in CP ROIs. However, given the SNR of our acquisition, a simple 2-class mixing model of tissue and CSF R1(t) values75 suggests that the CSF contribution to the later portions of the R1 time course (to which kco is most sensitive) is less than 15%.
In summary, we have used DCE-MRI and a pharmacokinetic model that quantitatively accounts for equilibrium exchange effects to measure in vivo water cycling at the human CP. Our results show that kco declines with age and is markedly reduced in older adults with mild cognitive dysfunction. Given the critical role of NKA in active water transport processes, these findings suggest that kco may reflect disturbances in blood-CSF barrier metabolism and early cognitive decline in older individuals.
Acknowledgments
The authors thank Mr. William Woodward, senior MRI technologist, for scanning assistance and Mr. Eric Baker, senior research associate, for data processing and analysis support. This work was supported by the National Institutes of Health (AG046626, AG008017, AG066518, NS040801, NS089260, OD018224) and the Oregon Partnership for Alzheimer’s Research.
Funding Statement
This work was supported by the National Institutes of Health [AG066518,AG046626, AG008017, OD018224, NS089260, NS040801] and the Oregon Partnership for Alzheimer's Research.
Disclosure statement
No potential conflict of interest was reported by the author(s).
References
- 1.Strazielle N, Ghersi-Egea JF.. Physiology of blood-brain interfaces in relation to brain disposition of small compounds and macromolecules. Mol Pharm. 2013;10(5):20–34. DOI: 10.1021/mp300518e. [DOI] [PubMed] [Google Scholar]
- 2.Johanson CE, Keep RF.. Blending established and new perspectives on choroid plexus-CSF dynamics. In: Praetorius J, Blazer-Yost B, Damkier H, editors. Role of the choroid plexus in health and disease. New York (NY): Springer; 2020. p. 35–81. [Google Scholar]
- 3.Oreskovic D, Rados M, Klarica M. Role of the choroid plexus in cerebrospinal fluid hydrodynamics. Neuroscience. 2017;354:69–87. DOI: 10.1016/j.neuroscience.2017.04.025. [DOI] [PubMed] [Google Scholar]
- 4.Cornford EM, Varesi JB, Hyman S, Damian RT, Raleigh MJ. Mitochondrial content of choroid plexus epithelium. Exp Brain Res. 1997;116(3):399–405. DOI: 10.1007/PL00005768. [DOI] [PubMed] [Google Scholar]
- 5.Baehr C, Reichel V, Fricker G. Choroid plexus epithelial monolayers- a cell culture model from porcine brain. Cerebrospinal Fluid Res. 2006;3(1):13. DOI: 10.1186/1743-8454-3-13. [DOI] [PMC free article] [PubMed] [Google Scholar]
- 6.Rosenthal R, Gunzel D, Krug SM, Schulzke JD, Frommm M, Yu AS. Claudin-2-mediated cation and water transport share a common pore. Acta Physiol. 2017;219(2):521–536. DOI: 10.1111/apha.12742. [DOI] [PMC free article] [PubMed] [Google Scholar]
- 7.Zeuthen T, MacAulay N. Transport of water against its concentration gradient: fact or fiction? WIREs Memtr Transp Signal. 2012;1(4):373–381. DOI: 10.1002/wmts.54. [DOI] [Google Scholar]
- 8.Damkier H, Brown P, Praetorius J. Epithelial pathways in choroid plexus electrolyte transport. Physiology. 2010;25(4):239–249. DOI: 10.1152/physiol.00011.2010. [DOI] [PubMed] [Google Scholar]
- 9.MacAulay N. Molecular mechanisms of water transport. Nat Rev Neurosci. 2021;22(6):326–344. DOI: 10.1038/s41583-021-00454-8. [DOI] [PubMed] [Google Scholar]
- 10.Brindle K. Watching tumours gasp and die with MRI: the promise of hyperpolarised 13C-MR spectroscopic imaging. Br J Radiol. 2012;85(1014):697–708. DOI: 10.1259/bjr/81120511. [DOI] [PMC free article] [PubMed] [Google Scholar]
- 11.Jochumsen MR, Sörensen J, Pedersen BG, Nyengaard JR, Krag SR, Frøkiær J, Borre M, Bouchelouche K, Tolbod LP. Tumour blood flow for prediction of human prostate cancer aggressiveness: a study with Rubidium-82 PET, MRI and Na+/K+-ATPase-density. Eur J Nucl Med Mol Imaging. 202. 1;48(2);532–542. DOI: 10.1007/s00259-00020-04998-00252. [DOI] [PMC free article] [PubMed] [Google Scholar]
- 12.Wang Q, Li SB, Zhao YY, Dai DN, Du H, Lin YZ, Ye JC, Zhao J, Xiao W, Mei Y, et al. Identification of a sodium pump Na+/K+ ATPase α1-targeted peptide for PET imaging of breast cancer. J Control Release. 2018;281:178–188. DOI: 10.1016/j.jconrel.2018.05.019. [DOI] [PubMed] [Google Scholar]
- 13.Li X, Mangia S, Lee J-H, Bai R, Springer CS. NMR shutter-speed elucidates apparent population inversion of 1H2O signals due to active transmembrane water cycling. Magn Reson Med. 2019;82(1):411–424. DOI: 10.1002/mrm.27725. [DOI] [PMC free article] [PubMed] [Google Scholar]
- 14.Rooney WD, Li X, Sammi MK, Bourdette DN, Neuwelt EA, Springer CS. Mapping human brain capillary water lifetime: high-resolution metabolic neuroimaging. NMR Biomed. 2015;28(6):607–623. DOI: 10.1002/nbm.3294. [DOI] [PMC free article] [PubMed] [Google Scholar]
- 15.Butterfield DA, Boyd-Kimball D. Mitochondrial oxidative and nitrosative stress and Alzheimer disease. Antioxidants. 2020;9(9):818. DOI: 10.3390/antiox9090818. [DOI] [PMC free article] [PubMed] [Google Scholar]
- 16.Zweig JA, Caruso M, Brandes MS, Gray NE. Loss of NRF2 leads to impaired mitochondrial function, decreased synaptic density and exacerbated age-related cognitive deficits. Exp Gerontol. 2020;131:110767. DOI: 10.1016/j.exger.2019.110767. [DOI] [PMC free article] [PubMed] [Google Scholar]
- 17.Anderson AE, Diaz-Santos M, Frei S, Dang BH, Kaur P, Lyden P, Buxton R, Douglas PK, Bilder RM, Esfandiari M, et al. Hemodynamic latency is associated with reduced intelligence across the lifespan: an fMRI DCM study of aging, cerebrovascular integrity, and cognitive ability. Brain Struct Funct. 2020a;225(6):1705–1717. DOI: 10.1007/s00429-020-02083-w. [DOI] [PMC free article] [PubMed] [Google Scholar]
- 18.Iadecola C. The neurovascular unit coming of age: a journey through neurovascular coupling in health and disease. Neuron. 2017;96(1):17–42. DOI: 10.1016/j.neuron.2017.07.030. [DOI] [PMC free article] [PubMed] [Google Scholar]
- 19.Nation DA, Sweeney MD, Montagne A, Sagare AP, D’Orazio LM, Pachicano M, Sepehrband F, Nelson AR, Buennagel DP, Harrington MG, et al. Blood-brain barrier breakdown is an early biomarker of human cognitive dysfunction. Nat Med. 2019;25(2):270–276. DOI: 10.1038/s41591-018-0297-y. [DOI] [PMC free article] [PubMed] [Google Scholar]
- 20.Preston JE. Ageing choroid plexus-cerebrospinal fluid system. Microsc Res Tech. 2001;52(1):31–37. DOI:. [DOI] [PubMed] [Google Scholar]
- 21.Chen RL, Kassem NA, Redzic ZB, Chen CPC, Segal MB, Preston JE. Age-related changes in choroid plexus and blood-cerebrospinal fluid barrier function in sheep. Exp Gerontol. 2009;44(4):289–296. DOI: 10.1016/j.exger.2008.12.004. [DOI] [PubMed] [Google Scholar]
- 22.Masseguin C, LePanse S, Corman B, Verbavatz JM, Gabrion J. Aging affects choroidal proteins involved in CSF production in Sprague-Dawley rats. Neurobiol Aging. 2005;26(6):917–927. DOI: 10.1016/j.neurobiolaging.2004.07.013. [DOI] [PubMed] [Google Scholar]
- 23.Tofts PS, Brix G, Buckley DL, Evelhoch JL, Henderson E, Knopp MV, Larsson HB, Lee TY, Mayr NA, Parker GJM, et al. Estimating kinetic parameters from dynamic contrast-enhanced T(1)-weighted MRI of a diffusable tracer: standardized quantities and symbols. J Magn Reson Imaging. 1999;10(3):223–232. DOI:. [DOI] [PubMed] [Google Scholar]
- 24.Heye AK, Culling RD, Valdés Hernández MC, Thrippleton MJ, Wardlaw JM. Assessment of blood–brain barrier disruption using dynamic contrast-enhanced MRI. A systematic review. Neuroimage: Clinical. 2014;6:262–274. DOI: 10.1016/j.nicl.2014.09.002. [DOI] [PMC free article] [PubMed] [Google Scholar]
- 25.Jackson A, Buckley DL, Parker GJM. Dynamic contrast-enhanced magnetic resonance imaging in oncology. Berlin, Germany: Springer-Verlag; 2005. [Google Scholar]
- 26.Landis CS, Li X, Telang FW, Coderre JA, Micca PL, Rooney WD, Latour LL, Vétek G, Springer CS, Jr. Determination of the MRI contrast agent concentration time course in vivo following bolus injection: effect of equilibrium transcytolemmal water exchange. Magn Reson Med. 2000;44:563–574. [DOI] [PubMed] [Google Scholar]
- 27.Li X, Rooney WD, Springer CS. A unified MRI pharmacokinetic theory: intravascular and extracellular contrast reagents. Magn Reson Med. 2005b;54(6):1351–1359. DOI: 10.1002/mrm.20684. [DOI] [PubMed] [Google Scholar]
- 28.Yankeelov TE, Rooney WD, Li X, Springer CS. Variation of the relaxographic “shutter-speed” for transcytolemmal water exchange affects the CR bolus-tracking curve shape. Magn Reson Med. 2003;50(6):1151–1169. DOI: 10.1002/mrm.10624. [DOI] [PubMed] [Google Scholar]
- 29.Allen MJ, Meade TJ. Synthesis and visualization of a membrane-permeable MRI contrast agent. J Biol Inorg Chem. 2003;8(7):746–750. DOI: 10.1007/s00775-003-0475-2. [DOI] [PubMed] [Google Scholar]
- 30.Caravan P, Ellison JJ, McMurry TJ, Lauffer RB. Gadolinium(III) chelates as MRI contrast agents: structure, dynamics, and applications. Chem Rev. 1999;99:2293–2352. DOI: 10.1021/cr980440x. [DOI] [PubMed] [Google Scholar]
- 31.Huang W, Li X, Morris EA, Tudorica LA, Seshan VE, Rooney WR, Tagge I, Wang Y, Xu J, Springer CS, et al. The magnetic resonance shutter speed discriminates vascular properties of malignant and benign breast tumors in vivo. Proc Nat Acad Sci. 2008;105(46):17943–17948. DOI: 10.1073/pnas.0711226105. [DOI] [PMC free article] [PubMed] [Google Scholar]
- 32.Li X, Priest RA, Woodward WJ, Siddiqui F, Beer TM, Garzotto MG, Rooney WD, Springer CS. Cell membrane water exchange effects in prostate DCE-MRI. J Magn Reson. 2012;218:77–85. DOI: 10.1016/j.jmr.2012.03.019. [DOI] [PMC free article] [PubMed] [Google Scholar]
- 33.Rooney WD, Yankeelov TE, Coyle PK, Telang FW, Springer CS. Quantitative measurement of contrast reagent blood-brain barrier permeability in multiple sclerosis. Proc Int Soc Magn Reson Med. 2003;11:276. [Google Scholar]
- 34.Yankeelov TE, Rooney WD, Huang W, Dyke JP, Li X, Tudorica A, Lee JH, Koutcher JA, Springer CS. Evidence for shutter-speed variation in CR bolus-tracking studies of human pathology. NMR Biomed. 2005;18(3):173–185. DOI: 10.1002/nbm.938. [DOI] [PubMed] [Google Scholar]
- 35.Li X, Huang W, Morris EA, Tudorica LA, Seshan VE, Rooney WD, Tagge I, Wang Y, Xu J, Springer CS, et al. Dynamic NMR effects in breast cancer dynamic-contrast-enhanced MRI. Proc Nat Acad Sci. 2008;105(46):17937–17942. DOI: 10.1073/pnas.0804224105. [DOI] [PMC free article] [PubMed] [Google Scholar]
- 36.Folstein MF, Folstein SE, McHugh PR. “Mini-mental state”: a practical method for grading the cognitive state of patients for the clinician. J Psychiatr Res. 1975;12(3):189–198. DOI: 10.1016/0022-3956(75)90026-6. [DOI] [PubMed] [Google Scholar]
- 37.Abikoff H, Alvir J, Hong G, Sukoff R, Orazio J, Solomon S, Saravay S. Logical memory subtest of the Wechsler Memory Scale: age and education norms and alternate-form reliability of two scoring systems. J Clin Exp Neuropsychol. 1987;9(4):435–448. DOI: 10.1080/01688638708405063. [DOI] [PubMed] [Google Scholar]
- 38.Morris JC, Heyman A, Mohs RC, Hughes JP, Van Belle G, Fillenbaum G, Mellits ED, Clark C. The Consortium to Establish a Registry for Alzheimer’s Disease (CXERAD). Part I. Clinical and neuropsychological assessment of Alzheimer’s disease. Neurology. 1989;39(9):1159–1165. DOI: 10.1212/WNL.39.9.1159. [DOI] [PubMed] [Google Scholar]
- 39.Bowie CR, Harvey PD. Administration and interpretation of the Trail Making Test. Nature Protocols. 2006;1(5):2277–2281. DOI: 10.1038/nprot.2006.390. [DOI] [PubMed] [Google Scholar]
- 40.Smith A. Symbol Digits Modalities Test (SDMT), Symbol Digits Modalities Test (SDMT) Manual. Los Angeles (CA): Western Psychological Services; 1982. [Google Scholar]
- 41.Lezak MD. Neuropsychological Assessment. NY: Oxford University Press; 1995. [Google Scholar]
- 42.Malek-Ahmadi M, Small BJ, Raj A. The diagnostic value of Controlled Oral Word Association Test-FAS and category fluency in single-domain amnestic mild cognitive impairment. Dement Geriatr Cogn Disord. 2012;32(4):235–240. DOI: 10.1159/000334525. [DOI] [PMC free article] [PubMed] [Google Scholar]
- 43.O’Bryant SE, Humphreys JD, Smith GE, Ivnik RJ, Graff-Radford NR, Petersen RC, Lucas JA. Detecting Dementia with the Mini-Mental State Examination (MMSE) in Highly Educated Individuals. Arch Neurol. 2008;65(7):963–967. DOI: 10.1001/archneur.65.7.963. [DOI] [PMC free article] [PubMed] [Google Scholar]
- 44.Li X, Huang W, Rooney WD. Signal-to-noise ratio, contrast-to-noise ratio and pharmacokinetic modeling considerations in dynamic contrast-enhanced magnetic resonance imaging. Magn Reson Imag. 2012;30(9):1313–1322. DOI: 10.1016/j.mri.2012.05.005. [DOI] [PMC free article] [PubMed] [Google Scholar]
- 45.Dietrich O, Raya JG, Reeder SB, Reiser MF, Schoenberg SO. Measurement of signal-to-noise ratios in MR images: influence of multichannel coils, parallel imaging, and reconstruction filters. J Magn Reson Imaging. 2007;26(2):375–385. DOI: 10.1002/jmri.20969. [DOI] [PubMed] [Google Scholar]
- 46.Berlow YA, Vingara LK, Sammi MK, McMahon LE, Tagge I, Maloney B, Grinstead JW, Rooney WD. Unified segmentation at 7T. Proc Int Soc Magn Reson Med. 2014;22:4911. [Google Scholar]
- 47.Jenkinson M, Beckmann CF, Behrens TE, Woolrich MW, Smith SM. FSL. Neuroimage. 2012;62(2):782–790. DOI: 10.1016/j.neuroimage.2011.09.015. [DOI] [PubMed] [Google Scholar]
- 48.Smith SM, Jenkinson M, Woolrich MW, Beckmann CF, Behrens T, Johansen-Berg H, Bannister PR, De Luca M, Drobnjak I, Flitney DE, et al. Advances in functional and structural MR image analysis and implementation as FSL. Neuroimage. 2004;23:S208–S219. DOI: 10.1016/j.neuroimage.2004.07.051. [DOI] [PubMed] [Google Scholar]
- 49.Markel M, Leupold J. Gradient echo imaging. J Magn Reson Imaging. 2012;35(6):1274–1289. DOI: 10.1002/jmri.23638. [DOI] [PubMed] [Google Scholar]
- 50.Deichmann R, Haase A. Quantification of T1 values by SNAPSHOT-FLASH NMR Imaging. J Magn Reson. 1992;96:608–612. DOI: 10.1002/mrm.1097. [DOI] [Google Scholar]
- 51.Scelsi CL, Rahim TA, Morris JA, Kramer GJ, Gilbert BC, Forseen SE. The lateral ventricles: a detailed review of anatomy, development, and anatomic variations. Amer J Neurorad. 2020;41(4):566–572. DOI: 10.3174/ajnr.A6456. [DOI] [PMC free article] [PubMed] [Google Scholar]
- 52.Noebauer-Huhmann IM, Kraff O, Juras V, Szomolanyi P, Maderwald S, Mlynarik V, Thyesohn JM, Ladd SC, Trattnig S. MR contrast media at 7T- preliminary study on relaxivities. Proc Int Soc Magn Reson Med. 2008;16:1457. [Google Scholar]
- 53.Mouridsen K, Christensen S, Gyldensted L, Ostergaard L. Automatic selection of arterial input function using cluster analysis. Magn Reson Med. 2006;55(3):524–531. DOI: 10.1002/mrm.20759. [DOI] [PubMed] [Google Scholar]
- 54.Hodge VJ, Austin J. A survey of outlier detection methodologies. Artificial Intelligence Rev. 2004;22(2):85–126. DOI: 10.1023/B:AIRE.0000045502.10941.a9. [DOI] [Google Scholar]
- 55.Verardi V, Croux C. Robust regression in Stata. Stata J. 1999;9(3):439–453. DOI: 10.1177/1536867X0900900306. [DOI] [Google Scholar]
- 56.Anderson VC, Obayashi JT, Kaye JA, Quinn JF, Berryhill P, Riccelli LP, Peterson D, Rooney WD. Longitudinal relaxographic imaging of white matter hyperintensities in the elderly. Fluids Barriers CNS. 2014;11(1):24. DOI: 10.1186/2045-8118-11-24. [DOI] [PMC free article] [PubMed] [Google Scholar]
- 57.Akaike H. A new look at the statistical model identification. IEEE Trans Auto Control. 1974;19(6):716–723. DOI: 10.1109/TAC.1974.1100705. [DOI] [Google Scholar]
- 58.Jaeger J. Digit Symbol Substitution Test: the case for sensitivity over specificity in neuropsychological testing. J Clin Psychopharmacol. 2018;38(5):513–519. DOI: 10.1097/JCP.0000000000000941. [DOI] [PMC free article] [PubMed] [Google Scholar]
- 59.Wang J, Fernandez-Seara MA, Wang S, St Lawrence KS. When perfusion meets diffusion: in vivo measurement of water permeability in human brain. J Cereb Blood Flow Metab. 2007;27(4):839–849. DOI: 10.1038/sj.jcbfm.9600398. [DOI] [PubMed] [Google Scholar]
- 60.Anderson VC, Tagge IJ, Li X, Quinn JF, Kaye JA, Bourdette DN, Spain RI, Riccelli LP, Sammi MK, Springer CS, et al. Observation of reduced homeostatic metabolic activity and/or coupling in white matter aging. J Neuroimaging. 2020;30(5):658–665. DOI: 10.1111/jon.12744. [DOI] [PMC free article] [PubMed] [Google Scholar]
- 61.Damkier H, Praetorius J. Structure of the mammalian choroid plexus. In: Praetorius J, Blazer-Yost B, Damkier H, editors. Role of the choroid plexus in health and disease. New York (NY): Springer; 2020. p. 1–33. [Google Scholar]
- 62.Yang DM, Huettner JE, Bretthorst GL, Neil JJ, Garbow JR, Ackerman JJH. Intracellular water preexchange lifetime in neurons and astrocytes. Magn Reson Med. 2018;79(3):1616–1627. DOI: 10.1002/mrm.26781. [DOI] [PMC free article] [PubMed] [Google Scholar]
- 63.Tamega OJ, Tirapelli LF, Petroni S. Scanning electron microscopy study of the choroid pleuxus in the monkey (cebus apella apella). Arq Neuropsiquiatr. 2000;58(3B):820–825. DOI: 10.1590/S0004-282X2000000500005. [DOI] [PubMed] [Google Scholar]
- 64.Brown PD, Davies SL, Speake T, MIllar ID. Molecular mechanisms of cerebrospinal fluid production. Neuroscience. 2004;129(4):955–968. DOI: 10.1016/j.neuroscience.2004.07.003. [DOI] [PMC free article] [PubMed] [Google Scholar]
- 65.Zhu X, Cain JR, Wang S, Feldmann M, Thompson G, Li KL, Asselin M, Jackson A. Separation of intra- and extra-vascular spaces in human brain with DCE-MRI and 11C- verapamil PET. Proc Int Soc Mag Reson Med. 2011;19:784. [Google Scholar]
- 66.Li X, Huang W, Yankeelov TE, Tudorica A, Rooney WD, Springer CS. Shutter-speed analysis of contrast reagent bolus-tracking data: preliminary observations in benign and malignant breast disease. Magn Reson Med. 2005;53:724–729. DOI: 10.1002/mrm.20425. [DOI] [PubMed] [Google Scholar]
- 67.Serot J-M, Foliguet B, Bene MC, Faure GC. Choroid plexus and ageing in rats: a morphometric and ultrastructural study. Eur J Neurosci. 2001;14(5):794–798. DOI: 10.1046/j.0953-816x.2001.01693.x. [DOI] [PubMed] [Google Scholar]
- 68.Bouzerar R, Chaarani B, Gondry-Jouet C, Zmudka J, Balédent O. Measurement of choroid plexus perfusion using dynamic susceptibility MR imaging: capillary permeability and age-related changes. Neuroradiology. 2013;55(12):1447–1454. DOI: 10.1007/s00234-013-1290-2. [DOI] [PubMed] [Google Scholar]
- 69.Evans PG, Sokolska M, Alves A, Harrison IF, Ohene Y, Nahavandi P, Ismail O, Miranda E, Lythgoe MF, Thomas DL, et al. Non-invasive MRI of blood-cerebrospinal fluid barrier function. Nat Commun. 2020;11(1):2081. DOI: 10.1038/s41467-020-16002-4. [DOI] [PMC free article] [PubMed] [Google Scholar]
- 70.Mortzavi MM, Griessenauer CJ, Adeeb N, Deep A, Shahripour RB, Loukas M, Tubbs RI, Tubbs RS. The choroid plexus: a comprehensive review of its history, anatomy, function, histology, embryology, and surgical considerations. Childs Nerv Syst. 2014;30(2):205–214. DOI: 10.1007/s00381-013-2326-y. [DOI] [PubMed] [Google Scholar]
- 71.Schwartz M, Shechter R. Protective autoimmunity functions by intracranial immunosurveillance to support the mind: the missing link between health and disease. Mol Psychiatry. 2010;15(4):342–354. DOI: 10.1038/mp.2010.31. [DOI] [PubMed] [Google Scholar]
- 72.Huang W, Chen Y, Fedorov A, Li X, Jajamovich GH, Malyarenko DI, Aryal MP, LaViolette PS, Oborski MJ, O’Sullivan F, et al. The impact of arterial input function determination variations on prostate dynamic contrast-enhanced magnetic resonance imaging pharmacokinetic modeling: a multicenter data analysis challenge. Tomography. 2016;2(1):56–66. DOI: 10.18383/j.tom.2015.00184. [DOI] [PMC free article] [PubMed] [Google Scholar]
- 73.Lavini C, Verhoeff JJ. Reproducibility of the gadolinium concentration measurements and of the fitting parameters of the vascular input function in the superior sagittal sinus in a patient population. Magn Reson Imag. 2010;28(10):1420–1430. DOI: 10.1016/j.mri.2010.06.017. [DOI] [PubMed] [Google Scholar]
- 74.Vaughan JT, Garwood M, Collins CM, Liu W, DelaBarre L, Adriany G, Andersen P, Merkle H, Goebel R, Smith MB, et al. 7T vs. 4T: RF power, homogeneity, and signal-to-noise comparison in head images. Magn Reson Med. 2001;46(1):24–30. DOI: 10.1002/mrm.1156. [DOI] [PubMed] [Google Scholar]
- 75.Asllani I, Borogovac A, Brown TR. A regression algorithm correcting for partial volume effects in arterial spin labeling MRI. Magn Reson Med. 2008;60(6):1362–1371. DOI: 10.1002/mrm.21670. [DOI] [PubMed] [Google Scholar]