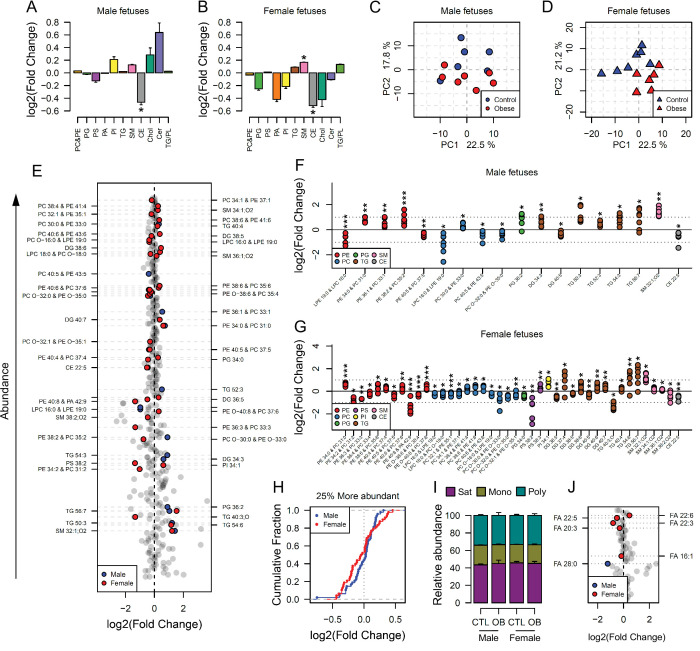
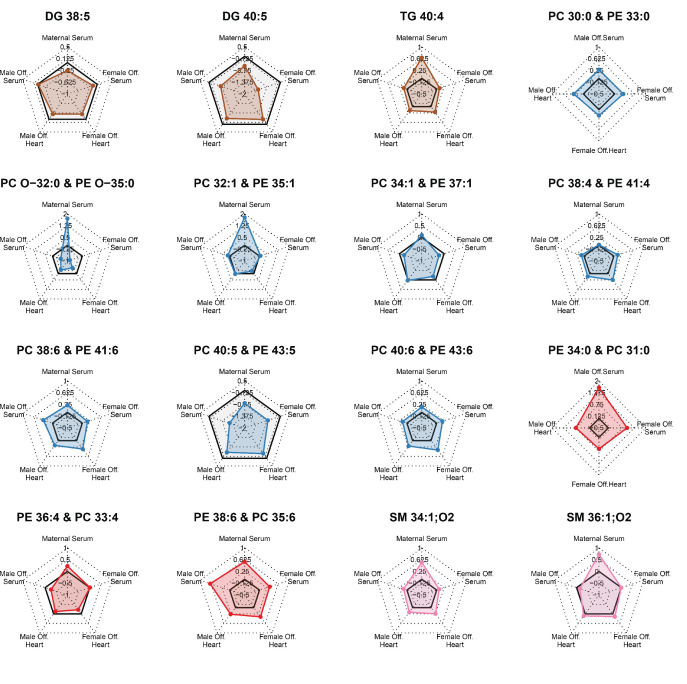
Figure 4. Maternal and fetal cardiac lipidome.
(A–B) Relative changes in cardiac lipid classes in male (A) and female (B) fetuses from obese dams. Values are mean + SE. *p < 0.05 calculated by Student t-test or Mann-Whitney test. (C–D) PCA plots showing the PC1 and PC2 scores for individual male (C) and female (D) cardiac lipidomes. (E) Regulation of fetal cardiac lipid species ranked according to their abundance. Coloured dots represent statistically regulated species as calculated by univariate Student t-test (p < 0.05) and PLS-DA VIP (vip score >1) in fetal OB hearts compared to CTL. (F–G) Cardiac levels of regulated lipids from male (F) and female (G) fetuses of obese dams at gestational day 18.5. Each dot represents a result from one obese heart, relative to the average of results for individual lipids in the control group (straight line). Male fetuses CTL n = 6, male fetuses OB n = 7, female fetuses CTL n = 7, female fetuses OB n = 6. * p < 0.05, ** p < 0.01, *** p < 0.001 calculated by Student t-test. (H) Cumulative frequency of cardiac lipid species according to the log2 of the fold change in abundance between male and female fetuses from obese and control dams. (I) Grouped saturated, monounsaturated and polyunsaturated fatty acids content in male and female fetal hearts at gestational day 18.5. (J) Regulation of maternal and fetal serum fatty acids. Coloured dots represent statistically regulated fatty acids as calculated by univariate Student t-test or Mann-Whitney test (p < 0.05) in fetal OB hearts compared to CTL. Male fetuses CTL n = 8, male fetuses OB n = 6, female fetuses CTL n = 7, female fetuses OB n = 7. In figures A-B: PE, phosphatidylethanolamines/odd chain phosphatidylcholines; PC, phosphatidylcholines/odd-chain phosphatidylethanolamines; PC, phosphatidylcholines; PG, phosphatidylglycerols; PS, phosphatidylserines; PA, phosphatidic acids; PI, phosphatidylinositols; TG, monoglycerides, diglycerides and triglycerides; SM, sphingomyelins; CE, cholesteryl esters; Cer, ceramides; PL, phospholipids. In figures E-G, other isobaric lipids can contribute to these signals (Supplementary file 2). See also Figure 4—figure supplement 1 and Figure 4—figure supplement 2.


