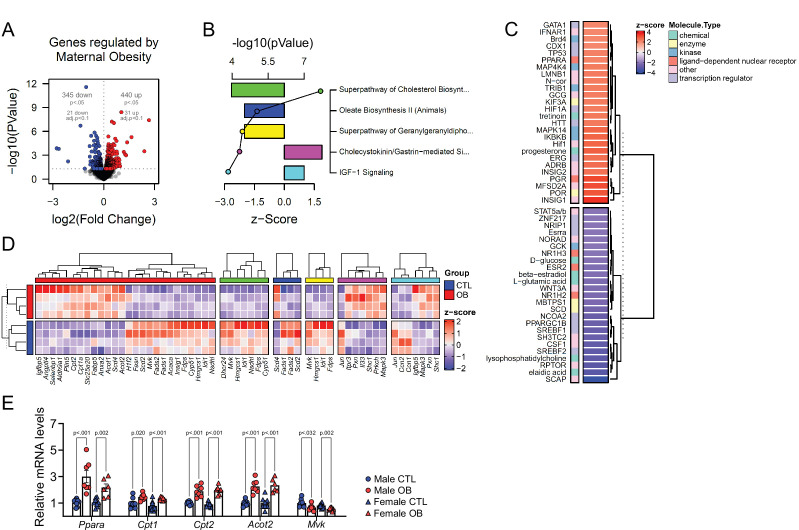
Figure 5. Fetal cardiac transcriptomics.
(A) Volcano plot showing up and downregulated genes in the heart of obese fetuses. p < 0.05 and FDR < 0.1 by generalised linear models with quasi-likelihood tests. Full statistical data is available in Figure 5—source data 1. (B) Top five regulated Ingenuity Canonical Pathways predicted by analysis of cardiac transcriptome from male fetuses from obese dams compared to fetuses from control dams. A p-value cut-off of 0.01 calculated by likelihood-ratio test was used to select regulated genes included in the IPA analysis. Bars represent activation z-score per pathway; points represent p-value of enriched pathways estimated by IPA algorithm. (C) Activation z-score of top Ingenuity Upstream Regulators predicted by analysis of cardiac transcriptome from male fetuses from obese dams compared to fetuses from control dams. The complete lists of regulated IPA canonical pathways and IPA upstream regulators are available in Figure 5—source data 2 and Figure 5—source data 3, respectively (D) Heatmap showing mRNA levels of genes regulated by PPAR-alpha activity (red bar), and genes mapped to ‘Superpathway of Cholesterol Biosynthesis’ (green bar), ‘Oleate Biosynthesis II’ (blue bar), ‘Superpathway of Geranylgeranyldiphosphate Biosynthesis I’ (yellow bar), ‘Cholecystokinin/Gastrin-mediated Signalling’ (pink bar) and ‘IGF-1 Signalling’ (light blue bar) Ingenuity Canonical Pathways in male E18.5 hearts as analysed by RNA Seq. CTL n = 4 and OB n = 4. (E) mRNA levels of selected markers of lipid metabolism in male and female fetal heats. Male CTL n = 8, male OB n = 8, female CTL n = 6, female OB n = 11. *p < 0.05, **p < 0.01, ***p < 0.001 by Student t-test. Diet ***p < 0.001 by factorial ANOVA. Primer sequences are available in Table 1.

