

Significance
We show that under widely believed complexity theoretic hypotheses, one cannot expect to find provably correct and efficient algorithms for predicting epidemic dynamics on general networks. These results hold even under idealized problem formulations, where all the model parameters are known and are insensitive to changes in environment. Further, they hold even for a small time horizon with just one random parameter, namely, the transmission probability. Thus, computational complexity poses an inherent challenge to effective and efficient epidemic forecasting in network models. Our results do not rule out heuristics that work well in practice or algorithms that provide provable guarantees for restricted networks. Rather, they suggest that algorithms working across a range of inputs should exploit properties of problem instances.
Keywords: forecasting, epidemic measures, network dynamics, computational complexity
Abstract
The ongoing COVID-19 pandemic underscores the importance of developing reliable forecasts that would allow decision makers to devise appropriate response strategies. Despite much recent research on the topic, epidemic forecasting remains poorly understood. Researchers have attributed the difficulty of forecasting contagion dynamics to a multitude of factors, including complex behavioral responses, uncertainty in data, the stochastic nature of the underlying process, and the high sensitivity of the disease parameters to changes in the environment. We offer a rigorous explanation of the difficulty of short-term forecasting on networked populations using ideas from computational complexity. Specifically, we show that several forecasting problems (e.g., the probability that at least a given number of people will get infected at a given time and the probability that the number of infections will reach a peak at a given time) are computationally intractable. For instance, efficient solvability of such problems would imply that the number of satisfying assignments of an arbitrary Boolean formula in conjunctive normal form can be computed efficiently, violating a widely believed hypothesis in computational complexity. This intractability result holds even under the ideal situation, where all the disease parameters are known and are assumed to be insensitive to changes in the environment. From a computational complexity viewpoint, our results, which show that contagion dynamics become unpredictable for both macroscopic and individual properties, bring out some fundamental difficulties of predicting disease parameters. On the positive side, we develop efficient algorithms or approximation algorithms for restricted versions of forecasting problems.
Prediction is very difficult, especially if it’s about the future.
Niels Bohr (1885–1962)
1. Background and Motivation
As demonstrated by the COVID-19 pandemic, large unexpected disease outbreaks can lead to devastating economic consequences. Thus, there is increasing interest in the development of systems that can provide early warnings regarding epidemics. This is borne out by the large number of epidemic-forecasting challenges issued by various agencies; examples include COVID-19 forecasts from the Centers for Disease Control and Prevention (CDC) (1), the “CHIKV Challenge” (for chikungunya virus) by the Defense Advanced Research Projects Agency (2), and the Intelligence Advanced Research Projects Activity (IARPA) flu challenge (3). There has also been a burst of activity on attempting to forecast different kinds of phenomena, such as sizes of epidemic outbreaks (e.g., refs. 4–6), cascades in social media, and civil unrest (e.g., refs. 7–9). In the context of evolutionary biology, pioneering work by Jacob (10) has clearly pointed out that one cannot reliably predict the properties of a complex system at one level based on what is known about the system at simpler levels. The difficulty of forecasting geophysical phenomena such as earthquakes has also been noted in the literature (e.g., ref. 11). A special issue of Science on “Prediction and its Limits” (12) contains many articles that point out the difficulty of accurately forecasting the behaviors of complex social systems (e.g., refs. 13–16). Despite a lot of work, epidemic forecasting remains poorly understood. A case in point is Google Flu Trends (GFT) (17). In its initial years, GFT produced very good forecasts of flu incidence rates, just based on search query results. However, the forecast accuracy decreased over time [e.g., overestimates of the A/H3N2 epidemic (18)]. Since the spread of flu-like diseases is a stochastic process, which depends on many time-varying factors (19, 20), one cannot expect accurate long-term predictions from a model such as GFT that relies on just one form of data. Several recent articles and news stories have highlighted the difficulties in constructing good models and producing reliable forecasts for influenza (e.g., ref. 21) and the COVID-19 pandemic (e.g., refs. 22 and 23). A comprehensive list of models that are currently used for forecasts related to COVID-19 can be found in ref. 24.
Many researchers have observed the need for carrying out a systematic study of the various issues associated with forecasting contagion dynamics in networked systems. Some of these observations are summarized below.
-
•
Drake (19, 20) observes that while systems may provide good forecasts of some epidemic measures (e.g., timing), there are fundamental limits on the effectiveness of such systems in forecasting other measures (e.g., final epidemic size). Several important reasons (such as the nature of stochastic disease-propagation models and high sensitivity of disease parameters to changes in the environment) are articulated in refs. 19 and 20 to explain such limits.
-
•
Cheng et al. (25) address the question of predicting whether a cascade will continue to grow in a social network. In particular, they focus on identifying the features of a cascade that can help in predicting the future course of the cascade. They remark that “a robust way to formulate the problem of cascade prediction remains an open problem.” In other related work, Althouse et al. (26) observe that superspreader events have played a big role in the spread of COVID-19 and that prediction of such events is important in controlling disease outbreaks.
-
•
Martin et al. (7) examine the limits of predictability in complex social systems; they observe that even a small degree of uncertainty can limit predictability. Further, they raise the question of whether a phenomenon that one is trying to predict is itself inherently unpredictable or the available data and techniques are inadequate to develop a reliable prediction. Hofman et al. (14) mention that “theoretical limits to the predictive accuracy of complex systems must be better characterized.”
-
•
Lazer et al. (18) use GFT as an example to caution against the use of social media and search information as a substitute for traditional data collection and analysis methods to predict epidemic measures. They highlight the need for systematically “studying the evolution of the socio-technical systems that are embedded in our society.”
-
•
Shaman et al. (27) use a differential equation-based model along with new data analysis techniques to predict the timing of the peak number of infections for influenza outbreaks. They demonstrate the usefulness of their framework in predicting the peak timing for the 2012–2013 season. They suggest that their methods can be made more robust when additional data are available.
-
•
Biggerstaff et al. (28) discuss results from the CDC’s “Predict the 2013–2014 Influenza Season Challenge.” They conclude that “forecasting has become technically feasible, but further efforts are needed to improve the accuracy so that policy makers can reliably use those predictions.”
-
•
May (29) points out that care must be exercised in drawing conclusions about the dynamics of ecological systems when there is uncertainty in the structure and parameters of the underlying network model. As mentioned earlier, a similar observation was made by Jacob (10) in the context of evolutionary biology.
Beckage et al. (30) point to another challenge for forecasting, which they refer to as “computational irreducibility”—this is the property of systems where the dynamics cannot be predicted without observing the evolution of the system. However, this can be difficult if determining the properties associated with the evolution of a system is itself computationally demanding—this is referred to as “computational intractability” (31) and has been a cornerstone of modern theoretical computer science. Indeed, many researchers [e.g., Buss et al. (32), Moore (33), and Wolfram (34)] have observed that computational intractability results for discrete dynamical systems provide an indication of the unpredictability (or “chaotic” behavior) of such systems. The theory of computational intractability has helped to place computational problems into a number of classes, such as P, NP, #P, etc. (see, e.g., refs. 31 and 35 for an introduction to this topic). Informally, problems that are NP-hard or #P-hard are unlikely to have efficient algorithms, i.e., algorithms that run in time that is a polynomial function of the input size. Computationally intractable problems arise in various fields (e.g., Mathematics, Physics, Biology, Social Science, Computer Science, and Operations Research). In the context of forecasting, some computational intractability results that arise in testing weather forecasts are presented in ref. 36; however, the model used in their work is different from network-based epidemic models.
In this paper, we show that many fundamental problems related to short-term predictions of epidemic properties in network models are computationally intractable, even when all the model parameters are known and assumed to be insensitive to changes in the environment. Using the observations in refs. 32–34, these results are indicative of the unpredictability of epidemic dynamics in networked systems. Thus, our results bring out a fundamental difficulty of predicting disease parameters. Scarpino and Petri (6) use a form of entropy as a model-independent measure of predictability of epidemic dynamics. They suggest that heterogeneity of social networks is a likely barrier to effective predictability. This observation is consistent with our results, which indicate that network structure plays an important role in determining the computational complexity of short-term forecasting problems.
Computational intractability results, such as NP-hardness and #P-hardness, capture worst-case scenarios; they indicate that there are problem instances for which efficient algorithms are unlikely to exist, unless some widely believed hypotheses in computational complexity turn out to be false (35). In other words, these results point out some fundamental limitations on efficiently computing certain epidemic parameters. For that reason, our complexity results should not be interpreted as implying that algorithms that work well in practice do not exist. Problem instances arising in practice are generally different from worst-case instances. In Section 4, we mention several approaches that are used in practice to obtain good solutions to some computationally intractable problems in networked epidemiology. Also, our computational intractability results do not point to weaknesses of epidemic models, nor do they raise concerns regarding the usefulness of models. Indeed, forecasts generated from commonly used models and practical solution techniques, with clearly stated assumptions and limitations, are invaluable to both policy makers and the general public.
Many computational models for epidemics have been studied in the literature (see e.g., refs. 37–39). Some recent models also take into account complex behaviors of contagions (such as evolutionary adaptions and spread of multiple strains) and strategies for vaccine dosages (40–43). Our results hold under the well-known Susceptible–Infected–Recovered (or SIR) model initially proposed in ref. 38, as well as under a broad class of related models, such as Susceptible –Infected (SI), Susceptible–Infected–Susceptible (SIS), and probabilistic threshold (PT) (complex contagion) models. We note that our results are for networked populations, and not for homogeneous mixing of populations, where the SIR and similar models were originally studied.
2. Networked Epidemic Model and Problems Studied
2.1. SIR Epidemic Model for Networks: A Brief Description.
To present the definitions of the forecasting problems considered in our work, we now provide a brief discussion on the SIR epidemic model for networks. For a more detailed discussion, the reader is referred to SI Appendix, section 2.
In the simplest SIR model on a network with unit infectious duration, the contagion is assumed to spread on an undirected network G(V, E), where V and E represent the set of nodes and edges, respectively. At any time* instant, each node is in one of the states from the domain = , . The values , and represent susceptible, infected (or infectious), and recovered states, respectively. For any node , the neighborhood of v, denoted by Nv, contains each node u such that the edge {u, v} is in E. Each edge is associated with a transmission probability pe with the following interpretation. At time t, suppose node v is in state , and X(v, t) denotes the subset of Nv such that each node in X(v, t) is in state . Then, at time t, each node tries to infect node v with probability independently of the other nodes in X(v, t). If any of these attempts is successful, then the state of v changes to at time t + 1.
A configuration of an SIR system at time t is an n-vector , where is the state of node vi at time t, . A single transition of an SIR system from one configuration to another is obtained by updating the state of each node v synchronously in the following manner.
-
1.
If the state of v at time t is , then the state of v at time t + 1 is also . (Thus, once a node reaches the state , it remains in that state forever.)
-
2.
If the state of v at time t is , then the state of v at time t + 1 is . Thus, each node remains in state for exactly one† time unit.
-
3.If the state of v at time t is , then the state of v at time t + 1 is determined by the following stochastic process. As mentioned earlier, let denote the set of neighbors of v whose state is at time t, and let be defined as follows. (The following expression for is a simple consequence of the assumption that each node in X(v, t) tries to infect v independently.)
The state of v at time t + 1 is with probability and with probability .
Initially (i.e., at ), one or more nodes are in state , and the other nodes are in state . Starting from the given initial configuration , the system goes through a sequence of configurations over time, as indicated in the following example.
Example.
The graph of an SIR system consisting of seven nodes is shown in Fig. 1. The nodes are labeled v0 through v6, and the transmission probability of each edge is also shown. Suppose at , node v0 is in state , and all other nodes are in state . Starting from this initial configuration, one possible sequence of configurations that the system may go through is shown in the table in the figure.
Fig. 1.
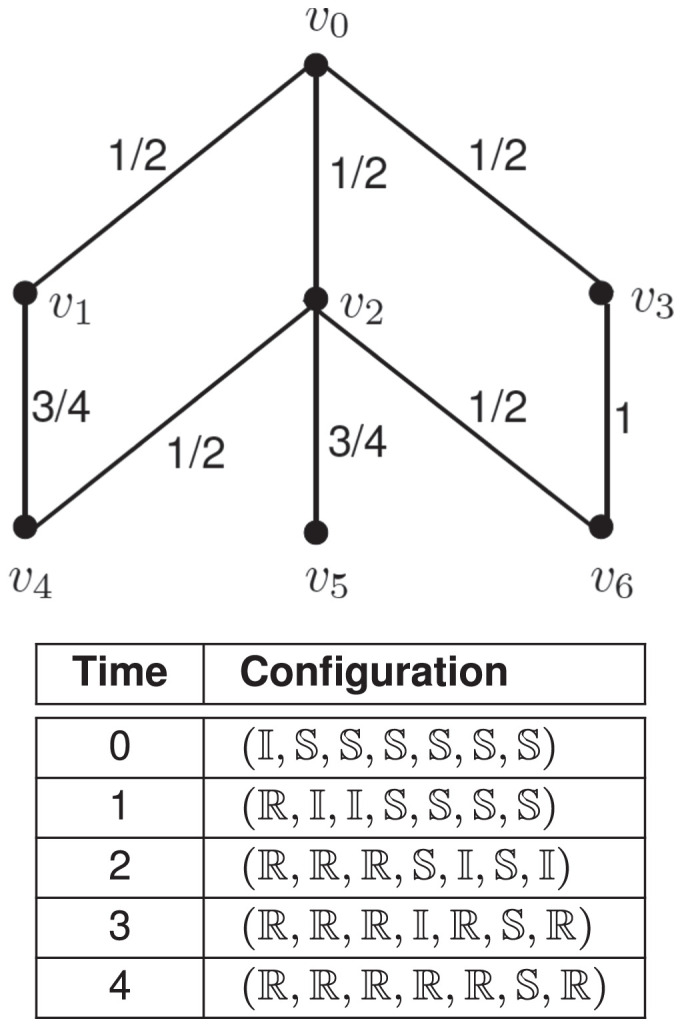
The graph of an SIR system and one possible sequence of its configurations, leading to a fixed point at time t = 4. [Each configuration is a seven-tuple , where is the state of node vi, .]
As shown in that table, at t = 1, nodes v1 and v2 get infected, v0 changes to state , and other nodes remain in state . Further, at t = 2, nodes v4 and v6 get infected, v1 and v2 change to state , and nodes v3 and v5 remain in state . Given the configuration at time t = 1, the probability that v4 gets infected at time t = 2 can be computed as follows. The infected neighbors of v4 are v1 and v2, and the transmission probabilities of the edges and are 3/4 and 1/2, respectively. Thus, the probability that v4 gets infected at time t = 2 is given by = 7/8. In a similar manner, the probability that node v6 gets infected at t = 2 is = 1/2.
We note that at t = 3, node v6 (which was infected at ) causes v3 to get infected. At t = 4, the system reaches a configuration with node v5 in state and all other nodes in state . Since this configuration does not have any node in state , no further state changes can occur; that is, the system has reached a fixed point.
2.2. Problem Definitions.
We introduce a number of short-term forecasting problems under the SIR model. (Similar problems can also be posed under other epidemic models mentioned in Section 1.) An example of a problem, denoted by pr-num-inf-at , under this model is the following: Given a social network, the set of initially infected nodes, a subset S of nodes, an integer , and a time value t, find the probability that at least q nodes of S get infected at time t. Another problem, denoted by pr-peak-inf-at , asks for the probability that the number of new infections reaches a peak at time t. Several such problems can be formulated. Table 1 gives concise descriptions of the main problems studied in our work.
Table 1.
Concise descriptions of the forecasting problems considered in the paper
| Problem name | Description |
| pr-num-inf-at | Compute the probability that the number of new infections within a given subset S of nodes at time t is at least q. |
| pr-num-inf-by | Compute the probability that the total number of infections within a given subset S of nodes by time t is at least q. |
| pr-inf-at | Compute the vulnerability of the nodes in subset S at time t (i.e., the probability that all the nodes in the subset S get infected at time t). |
| pr-inf-by | Compute the vulnerability of the nodes in S by time t (i.e., the probability that all the nodes in S get infected by time t). |
| pr-peak-inf-at | Compute the probability that the number of new infections in the network reaches a peak at time t. |
Problems pr-inf-at and pr-inf-by are special versions of pr-num-inf-at and pr-num-inf-by , respectively, with . When S = V (the set of all nodes in the network), we denote the first four problems by pr-num-inf-at , pr-num-inf-by , pr-inf-at , and pr-inf-by , respectively. Results for these variants are stated in Table 3.
3. Summary of Results
To our knowledge, only a few references (44–46) have addressed‡ the computational complexity issues related to forecasting under the SIR or other epidemic models. However, none of these references addresses short-term forecasting problems. Our contributions can be summarized as follows.
-
1.For general graphs, we establish computational intractability results for the first four problems in Table 1, namely
-
i.pr-num-inf-at ,
-
ii.pr-num-inf-by ,
-
iii.pr-inf-at , and
-
iv.pr-inf-by ,
even when the time horizon t is as small as two. We also prove a result that provides an indication of the difficulty of obtaining approximate solutions to any of these problems for any . In addition, we demonstrate the tightness of our intractability results by showing that the four problems are efficiently solvable for t = 1. Further, we show that the pr-peak-inf-at problem is computationally intractable, even for t = 1. We also present a randomized approximation scheme for the problem pr-inf-by for any fixed t and any set S of fixed size. Table 2 provides formal statements of our results for general graphs.
-
i.
-
2.
We extend the above intractability results to more realistic social networks (e.g., networks with low diameter and high clustering coefficient or power-law networks) and to networks in which all the edges have the same transmission probability. These results are shown in Table 3.
-
3.
We also present extensions of our results to prove the intractability of forecasting various epidemic measures (e.g., peak value, take-off value, or take-off time) introduced in ref. 47. These results are summarized in SI Appendix, Table 4.
-
4.
Further, we extend our intractability results to three other epidemic models, namely, SI, SIS, and PT. These results are summarized in SI Appendix, Table 5.
Table 2.
Results for forecasting problems over general graphs
| Problem(s) | Result(s) |
| pr-num-inf-at , pr-num-inf-by , pr-inf-at , and pr-inf-by | 1. #P-hard for any (part 1 of Theorem 4.1). 2. For any , there is an such that unless P = NP, the quantity cannot be efficiently approximated to within the factor , where is the solution value and n is the maximum number of nodes that can get infected at t = 1 (part 2 of Theorem 4.1). |
| pr-peak-inf-at | #P-hard for any (part 3 of Theorem 4.1). |
| pr-num-inf-at , pr-num-inf-by , pr-inf-at , and pr-inf-by | Efficiently solvable for t = 1 (Corollary 6.5). |
| Compute the expected number of new infections at time t | Efficiently solvable for t = 1 and t = 2 (Corollary 6.10). |
| pr-inf-by | Randomized approximation scheme for any fixed t and any set S of fixed size (Theorem 6.18). |
The theorems and corollaries mentioned in the above table appear in SI Appendix.
Table 3.
Extensions of intractability results to more realistic networks
| Problem | Result(s) |
| pr-num-inf-at |
#P-hard even when both the diameter and the average clustering coefficient are 1 (part 1 of Theorem 5.3). |
| pr-num-inf-by |
#P-hard even when both the diameter and the average clustering coefficient are 1 (part 2 of Theorem 5.3). |
| pr-num-inf-at | 1. #P-hard for any , even when all edge probability values are equal to 0.5 (Theorem 5.2). |
| 2. #P-hard for any even for power-law graphs (Theorem 5.7). | |
| pr-num-inf-by |
#P-hard for any even when all edge probability values are equal to 0.5 (Theorem 5.2). |
The theorems mentioned in the above table appear in the SI Appendix.
In ongoing work, we show that many of the forecasting problems under the SIR model can be solved efficiently when the treewidth of the underlying graph is bounded.
4. Implications of the Results
We briefly discuss the implications of our results with respect to the short-term forecasting problems considered in our work.
4.1. Unpredictability of Epidemic Dynamics Sets in at a Very Early Time.
Our results show that from a computational complexity point of view, epidemic dynamics become unpredictable, even when the time horizon is as small as two units. This is in contrast to previous complexity results on the unpredictability of dynamical systems that needed an exponential number of time steps for deterministic systems (e.g., PSPACE-hardness of reachability problems for dynamical systems shown in ref. 48) and a polynomial number of time steps for probabilistic systems (e.g., PSPACE-hardness of simulating quadratic dynamical systems shown in ref. 49).
4.2. Unpredictability Holds for both Macroscopic and Individual Properties.
Our computational intractability results hold for predicting macroscopic properties (e.g., finding the probability that there will be at least q new infections at any time ), as well as individual properties (e.g., finding the probability that a specific node is infected at time under the PT model) over a short time horizon.
4.3. Unpredictability Holds Even When Prior Knowledge Regarding the System Behavior Is Available.
Most of our computational intractability results hold for any time value . An examination of the proofs of these results shows that from a worst-case standpoint, the unpredictability results do not change, even if the behavior of the system is known for most previous time steps.
4.4. The Unpredictability Results Are Pervasive.
Our unpredictability results hold for a variety of problems and contagion propagation models. The problem variants include predicting the number of new infections at a certain time, the total number of infections up to a certain time, the time and size of the peak number of new infections, etc. The contagion models studied include SIR, SI, SIS, and PT. Furthermore, the complexity results hold for several classes of networks, such as power-law networks and small-world networks (e.g., complete graphs whose diameter is one).
4.5. One Random Parameter Is Adequate for Unpredictability.
Our complexity results rely on exactly one source of randomness, namely, the transmission probability. The results hold even when the remaining model parameters (e.g., the network structure and infectious period) are deterministic and do not vary over time.
4.6. Provable Predictability Results for Certain Special Cases.
For certain special forecasting problems, our results provide provably good approximations when the time horizon is fixed. Such special cases include computing the expected number of infections, the probability of a node being infected by a certain time, and the probability that the total number of infections exceeds a specified count by a certain time. (These results are presented in SI Appendix, section 6.)
For purposes of exposition, we presented our results in the context of epidemics. However, our results are applicable to other contagions in networked populations. Examples of such contagions include opinion/information propagation in social networks and malware propagation in computer networks. A good discussion of models for such contagions can be found in ref. 50.
5. Methods
We briefly summarize the methods used to establish the results mentioned in Section 3. The #P-hardness results and the difficulty of approximating the solution value shown in Table 2 are obtained through reductions from the problem of counting the number of satisfying assignments to a given monotone 2-satisfiability formula.§ The complexity of this problem was established in ref. 51, and the difficulty of obtaining provable approximations for the problem was established in ref. 52. For t = 1, we prove the efficient solvability of the first four problems in Table 2 by developing a dynamic programming algorithm for a more general problem that encompasses all four problems. The randomized approximation scheme for pr-inf-by (when t and are fixed) is based on a reduction to the problem of counting the number of satisfying assignments to a Boolean formula in disjunctive normal form. In establishing some of the results for realistic (e.g., small world) networks (Table 3), we use Fortuin–Kasteleyn–Ginibre inequalities from probability theory (53). The complexity results for various epidemic measures (presented in SI Appendix, Table 4) and for other epidemic models (presented in SI Appendix, Table 5) use appropriate modifications of the constructions used to prove the results mentioned in Table 2.
6. Discussion: Coping with Computational Intractability
We briefly discuss how some known approaches to cope with computational intractability are used in practice to solve problems in networked epidemiology.
One approach is to develop provably good approximations that work across a range of inputs by exploiting special properties of problem instances. Examples of this approach for the forecasting problems considered in our work are presented in SI Appendix, section 6. Recent examples of references that present approximation algorithms for optimization problems arising in epidemic dynamics include ref. 54 (which studies the problem of distributing vaccines under a budget constraint as a stochastic optimization problem) and ref. 55 (which considers the problem of developing strategies to decrease the spectral radius of the contact network as a way of reducing the spread of an epidemic). An approximation-based approach has also been used in the literature to reconstruct the history of an evolving network from a small collection of its snapshots over time. For example, an efficient algorithm that constructs an approximate history that is strongly correlated with the true evolution history of a network is presented in ref. 56.
A second approach is to consider structural restrictions on contact networks that can lead to efficient forecasting algorithms. As an example for this approach, our ongoing work has led to efficient algorithms for forecasting problems when the social contact networks have fixed treewidth. Such an approach has been used in the literature for a number of other computational problems in epidemiology. For example, Pinto et al. (57) consider the problem of locating the sources of infection in networks. The source-detection problem provides a way of formalizing the reverse contact-tracing approach used for epidemics (58, 59). While the forecasting problems considered in our work are based on forward trajectories with respect to time, the source-detection problem involves examining backward trajectories. As noted in ref. 60, the source-detection problem is difficult in general. Pinto et al. (57) present an efficient algorithm when the underlying network is a tree. Karrer and Newman (61) use a message-passing model for the computation of certain epidemic probabilities in networks. They observe that their approach gives exact values for tree networks and good upper bounds for general networks. Shrestha et al. (62) extend use of the message-passing approach to models such as SIS, where a node may return to the same state many times during the course of an epidemic; their results closely approximate those obtained by more computation-intensive Monte Carlo methods. Milling et al. (63) consider the problem of identifying the causative network—that is, the network on which an infection is spreading—given two candidate networks and a sample of infected nodes. For some special classes of graphs (namely d-dimensional grids and Erdös–Renyi random graphs), they provide sufficient conditions under the SI model for identifying the causative network with high probability. Altarelli et al. (64) consider the computationally hard problem of finding the marginals of certain probability distributions for an SIR epidemic over a network and develop an approach based on belief propagation (65). They show that their approach produces exact solutions for tree networks.
A third approach is to adapt heuristic techniques that work well in practice for general optimization problems. A number of such methods (e.g., genetic programming, simulated annealing, randomized search, and tabu search) have been developed for many optimization problems (66). Sophisticated forms of such approaches have been used by researchers for problems in computational epidemiology. For example, Shah and Zaman (67) use a maximum-likelihood approach in conjunction with network centrality measures to develop a highly effective algorithm to find the source of infections for a virus propagating through a network. Horn and Friedrich (68) employ a combination of random walks and the maximum-likelihood approach to develop an algorithm for locating the source of infections for foodborne diseases. Other researchers have used approaches based on message passing and belief propagation to obtain practical solutions to the problem of identifying the source of infection in general graphs (64, 69).
Finally, one can also try to reduce the time for computing forecasts by reducing the size of the contact network. One possible approach for this is to consider a higher-level aggregation of the underlying network (e.g., consider a network where each node represents a county instead of an individual). Moon et al. (70) use this approach for scaling up epidemic simulations. Finding the right level of aggregation that is appropriate for various disease parameters remains an important direction for future research.
7. Materials and Methods
Our results on the hardness of forecasting problems are obtained by using reductions from problems that are known to be computationally intractable. Our algorithms and approximation algorithms for restricted versions rely on standard techniques in algorithms for combinatorial problems. Our experimental results were generated by using simulation software written in Python.
Supplementary Material
Acknowledgments
We sincerely thank to the referees for providing valuable feedback. We also thank members of the Biocomplexity COVID-19 Response Team and the Network Systems Science and Advanced Computing Division for their thoughtful comments and suggestions related to epidemic modeling and response support. We thank Jason Matheny, Naren Ramakrishnan, and Philippe Loustaunau for discussions on this topic during the IARPA Open Source Indicators project that led to the work. This work has been partially supported by Defense Threat Reduction Agency Contract HDTRA1-19-D-0007; University of Virginia Strategic Investment Fund Award SIF160; NIH Grants 1R01GM109718 and 2R01GM109718; and NSF Grants IIS-1633028 (Big Data), CMMI-1745207 (Early Concept Grants for Exploratory Research), OAC-1916805 (Cyberinfrastructure for Network Engineering and Science), CCF-1918656 (Expeditions), CNS-2028004 (Rapid Response Research [RAPID]), OAC-2027541 (RAPID), IIS-2026982 (RAPID), IIS-1908530, IIS-1955797, and IIS-2027848. The US Government is authorized to reproduce and distribute reprints for Governmental purposes notwithstanding any copyright annotation thereon.
Footnotes
The authors declare no competing interest.
This article is a PNAS Direct Submission.
This article contains supporting information online at https://www.pnas.org/lookup/suppl/doi:10.1073/pnas.2109228119/-/DCSupplemental.
*The unit of time (which may be a day, a week, etc.) depends on the epidemic that is being modeled.
†With minor modifications to the proofs, our results can be shown to hold even when the infectious period for each node is any constant number of time units.
‡We provide a summary of these results in SI Appendix, section 3.5.
§In this problem, we are given a set of Boolean variables X and a collection of clauses, where each clause is the disjunction of exactly two variables from X. The goal is to find the number of assignments of TRUE or FALSE value to the variables in X such that all the clauses evaluate to TRUE. A formal definition of this problem appears in SI Appendix, section 3.2.3.
Data Availability
There are no data underlying this work.
References
- 1. Centers for Disease Control and Prevention, COVID-19 forecasts: Cases (2021). https://www.cdc.gov/coronavirus/2019-ncov/cases-updates/forecasts-cases.html. Accessed 28 September 2021.
- 2.Defense Advanced Research Projects Agency, CHIKV Challenge announces winners, progress toward forecasting the spread of infectious diseases (2015). https://www.darpa.mil/news-events/2015-05-27. Accessed 28 September 2021.
- 3.Muthiah S., et al., “EMBERS at 4 years: Experiences operating an open source indicators forecasting system” in KDD’16: Proceedings of the 22nd ACM SIGKDD International Conference on Knowledge Discovery and Data Mining, Krishnapuram B., et al., Eds. (Association for Computing Machinery, New York, 2016), pp. 205–214.
- 4.Tizzoni M., et al., Real-time numerical forecast of global epidemic spreading: Case study of 2009 A/H1N1pdm. BMC Med. 10, 165 (2012). [DOI] [PMC free article] [PubMed] [Google Scholar]
- 5.Chakraborty P., et al., “Forecasting a moving target: Ensemble models for ILI case count predictions” in Proceedings of the 2014 SIAM International Conference on Data Mining (SDM), Zaki M., et al., Eds. (Society for Industrial and Applied Mathematics, Philadelphia, 2014), pp. 262–270.
- 6.Scarpino S. V., Petri G., On the predictability of infectious disease outbreaks. Nat. Commun. 10, 898 (2019). [DOI] [PMC free article] [PubMed] [Google Scholar]
- 7.Martin T., Hofman J. M., Sharma A., Anderson A., Watts D. J., “Exploring limits to prediction in complex social systems” in Proceedings of the 25th International Conference on World Wide Web, WWW 2016, Bourdeau J., Hendler J., Nkambou R., Horrocks I., Zhao B. Y., Eds. (Association for Computing Machinery 2016), pp. 683–694.
- 8.Krishnan S., Butler P., Tandon R., Leskovec J., Ramakrishnan N., “Seeing the forest for the trees: New approaches to forecasting cascades” in WebSci’16: Proceedings of the 8th ACM Conference on Web Science , WebSci 2016, Nejdl W., Hall W., Parigi P., Staab S., Eds. (Association for Computing Machinery, New York, 2016), pp. 249–258.
- 9.Ramakrishnan N., et al., “‘Beating the news’ with EMBERS: Forecasting civil unrest using open source indicators” in KDD’14: Proceedings of the 20th ACM SIGKDD International Conference on Knowledge Discovery and Data Mining, S. A. Macskassy, Perlich C., Leskovec J., Wang W., Ghani R., Eds. (Association for Computing Machinery, New York, 2014), pp. 1799–1808.
- 10.Jacob F., Evolution and tinkering. Science 196, 1161–1166 (1977). [DOI] [PubMed] [Google Scholar]
- 11.Geller R. J., Jackson D. D., Kagan Y. Y., Mulargia F., Earthquakes cannot be predicted. Science 275, 1616–1617 (1997). [Google Scholar]
- 12.Jasny B. R., Stone R., Special Issue: Prediction and its Limits. Science 355(6324) (2017). [DOI] [PubMed] [Google Scholar]
- 13.Jasny B. R., Stone R., Prediction and its limits. Science 355, 468–469 (2017). [DOI] [PubMed] [Google Scholar]
- 14.Hofman J. M., Sharma A., Watts D. J., Prediction and explanation in social systems. Science 355, 486–488 (2017). [DOI] [PubMed] [Google Scholar]
- 15.Kennedy R., Wojcik S., Lazer D., Improving election prediction internationally. Science 355, 515–520 (2017). [DOI] [PubMed] [Google Scholar]
- 16.Subrahmanian V. S., Kumar S., Predicting human behavior: The next frontiers. Science 355, 489 (2017). [DOI] [PubMed] [Google Scholar]
- 17.Ginsberg J., et al., Detecting influenza epidemics using search engine query data. Nature 457, 1012–1014 (2009). [DOI] [PubMed] [Google Scholar]
- 18.Lazer D., Kennedy R., King G., Vespignani A., Big data. The parable of Google Flu: Traps in big data analysis. Science 343, 1203–1205 (2014). [DOI] [PubMed] [Google Scholar]
- 19.Drake J. M., Fundamental limits to the precision of early warning systems for epidemics of infectious diseases. PLoS Med. 2, e144 (2005). [DOI] [PMC free article] [PubMed] [Google Scholar]
- 20.Drake J. M., Limits to forecasting precision for outbreaks of directly transmitted diseases. PLoS Med. 3, e3 (2006). [DOI] [PMC free article] [PubMed] [Google Scholar]
- 21.Viboud C., Vespignani A., The future of influenza forecasts. Proc. Natl. Acad. Sci. U.S.A. 116, 2802–2804 (2019). [DOI] [PMC free article] [PubMed] [Google Scholar]
- 22.Resnick B., Why it’s so hard to see into the future of COVID-19. Vox (2020). https://www.vox.com/science-and-health/2020/4/10/21209961/coronavirus-models-covid-19-limitations-imhe. Accessed 27 September 2021.
- 23.Adam D., Special report: The simulations driving the world’s response to COVID-19. Nature 580, 316–318 (2020). [DOI] [PubMed] [Google Scholar]
- 24.The COVID-19 Forecast Hub community. https://covid19forecasthub.org/. Accessed 30 December 2021.
- 25.Cheng J., Adamic L. A., Kleinberg J. M., Leskovec J., “Do cascades recur?” in Proceedings of the 25th International Conference on World Wide Web, WWW 2016, J. Bourdeau, Hendler J., Nkambou R., Horrocks I., Zhao B. Y., Eds. (Association for Computing Machinery 2016), pp. 671–681.
- 26.Althouse B. M., et al., Superspreading events in the transmission dynamics of SARS-CoV-2: Opportunities for interventions and control. PLoS Biol. 18, e3000897 (2020). [DOI] [PMC free article] [PubMed] [Google Scholar]
- 27.Shaman J., Karspeck A., Yang W., Tamerius J., Lipsitch M., Real-time influenza forecasts during the 2012–2013 season. Nat. Commun. 4, 2837 (2013). [DOI] [PMC free article] [PubMed] [Google Scholar]
- 28.Biggerstaff M., et al., Results from the Centers for Disease Control and Prevention’s Predict the 2013–2014 Influenza Season Challenge. BMC Infect. Dis. 16, 357 (2016). [DOI] [PMC free article] [PubMed] [Google Scholar]
- 29.May R. M., Network structure and the biology of populations. Trends Ecol. Evol. 21, 394–399 (2006). [DOI] [PubMed] [Google Scholar]
- 30.Beckage B., Gross L. J., Kauffman S., The limits to prediction in ecological systems. Ecosphere 2, 1–12 (2011). [Google Scholar]
- 31.Garey M. R., Johnson D. S., Computers and Intractability: A Guide to the Theory of NP-Completeness (W. H. Freeman and Co., San Francisco, 1979). [Google Scholar]
- 32.Buss S. R., Papadimitriou C. H., Tsitsiklis J. N., On the predictability of coupled automata: An allegory about chaos. Complex Syst. 5, 525–539 (1991). [Google Scholar]
- 33.Moore C., Unpredictability and undecidability in dynamical systems. Phys. Rev. Lett. 64, 2354–2357 (1990). [DOI] [PubMed] [Google Scholar]
- 34.Wolfram S., Theory and Applications of Cellular Automata (World Scientific Publishers, Singapore, 1986). [Google Scholar]
- 35.Arora S., Barak B., Computational Complexity: A Modern Approach (Cambridge University Press, New York, 2009). [Google Scholar]
- 36.Fortnow L., Vohra R. V., The complexity of forecast testing. Econometrica 77, 93–105 (2009). [Google Scholar]
- 37.Brauer F., van den Driessche P., Wu J., Mathematical Epidemiology (Lecture Notes in Mathematics 1945, Springer Verlag, Berlin, 2008), vol. 1945. [Google Scholar]
- 38.Kermack W. O., McKendrick A. G., A contribution to the mathematical theory of epidemics. Proc. R. Soc. Lond. A Contain. Pap. Math. Phys. Character 115, 700–721 (1927). [Google Scholar]
- 39.Lofgren E. T., et al., Opinion: Mathematical models: A key tool for outbreak response. Proc. Natl. Acad. Sci. U.S.A. 111, 18095–18096 (2014). [DOI] [PMC free article] [PubMed] [Google Scholar]
- 40.Yaǧan O., et al., Modeling and analysis of the spread of COVID-19 under a multiple-strain model with mutations. Harv. Data Sci. Rev., 10.1162/99608f92.a11bf693 (2021). [DOI] [Google Scholar]
- 41.Eletreby R., Zhuang Y., Carley K. M., Yaǧan O., Poor H. V., The effects of evolutionary adaptations on spreading processes in complex networks. Proc. Natl. Acad. Sci. U.S.A. 117, 5664–5670 (2020). [DOI] [PMC free article] [PubMed] [Google Scholar]
- 42.Saad-Roy C. M., et al., Epidemiological and evolutionary considerations of SARS-CoV-2 vaccine dosing regimes. Science 372, 363–370 (2021). [DOI] [PMC free article] [PubMed] [Google Scholar]
- 43.Hébert-Dufresne L., Scarpino S. V., Young J. G., Macroscopic patterns of interacting contagions are indistinguishable from social reinforcement. Nat. Phys. 16, 426–431 (2020). [DOI] [PMC free article] [PubMed] [Google Scholar]
- 44.Laumanns M., Zenklusen R., Computational complexity of impact size estimation for spreading processes on networks. Eur. Phys. J. B 71, 481–487 (2009). [Google Scholar]
- 45.Peyrard N., Sabbadin R., “Evaluation of the expected size of a SIR epidemics on a graph” (Tech. Rep. RR-2012-1, Institut National de la Researche Agronomique, Unité de Biométrie et Intelligence Artificiale, Toulouse, France, 2012).
- 46.Shapiro M., Delgado-Eckert E., Finding the probability of infection in an SIR network is NP-Hard. Math. Biosci. 240, 77–84 (2012). [DOI] [PMC free article] [PubMed] [Google Scholar]
- 47.Tabataba F. S., et al., A framework for evaluating epidemic forecasts. BMC Infect. Dis. 17, 345 (2017). [DOI] [PMC free article] [PubMed] [Google Scholar]
- 48.Barrett C., et al., Complexity of reachability problems for finite discrete dynamical systems. J. Comput. Syst. Sci. 72, 1317–1345 (2006). [Google Scholar]
- 49.Arora S., Rabani Y., Vazirani U., “Simulating quadratic dynamical systems is PSPACE-complete” in STOC’94: Proceedings of the 26th Annual ACM Symposium on Theory of Computing, Leighton F. T., Goodrich M. T., Eds. (Association for Computing Machinery, New York, 1994), pp. 459–467.
- 50.Easley D., Kleinberg J., Networks, Crowds and Markets: Reasoning About a Highly Connected World (Cambridge University Press, New York, 2010). [Google Scholar]
- 51.Vadhan S., The complexity of counting in sparse, regular and planar graphs. SIAM J. Comput. 31, 398–427 (2001). [Google Scholar]
- 52.Zuckerman D., On unapproximable versions of NP-complete problems. SIAM J. Comput. 25, 1293–1304 (1996). [Google Scholar]
- 53.Fortuin C. M., Ginibre J., Kasteleyn P. N., Correlational inequalities for partially ordered sets. Commun. Math. Phys. 22, 89–103 (1971). [Google Scholar]
- 54.Sambaturu P., Adhikari B., Prakash B. A., Venkatramanan S., Vullikanti A., “Designing effective and practical interventions to contain epidemics” in Proceedings of the 19th International Conference on Autonomous Agents and Multiagent Systems, AAMAS ’20, Seghrouchni A. E. F., Sukthankar G., An B., Yorke-Smith N., Eds. (International Foundation for Autonomous Agents and Multiagent Systems, Liverpool, United Kingdom 2020), pp. 1187–1195.
- 55.Saha S., Adiga A., Prakash B. A., Vullikanti A. K. S., “Approximation algorithms for reducing the spectral radius to control epidemic spread” in Proceedings of the 2015 SIAM International Conference on Data Mining, S. Venkatasubramanian, Ye J., Eds. (Society for Industrial and Applied Mathematics, Philadelphia, 2015), pp. 568–576.
- 56.Young J. G., et al., Phase transition in the recoverability of network history. Phys. Rev. X 9, 041056 (2019). [Google Scholar]
- 57.Pinto P. C., Thiran P., Vetterli M., Locating the source of diffusion in large-scale networks. Phys. Rev. Lett. 109, 068702 (2012). [DOI] [PubMed] [Google Scholar]
- 58.Kojaku S., Hébert-Dufresne L., Mones E., Lehmann S., Ahn Y. Y., The effectiveness of backward contact tracing in networks. Nat. Phys. 17, 652–658 (2021). [DOI] [PMC free article] [PubMed] [Google Scholar]
- 59.Castellano C., Pastor-Satorras R., Relevance of backtracking paths in recurrent-state epidemic spreading on networks. Phys. Rev. E 98, 052313 (2018). [Google Scholar]
- 60.Rivers C. M., Scarpino S. V., Predict trajectory, not emergence. Nature 559, 477 (2018). [DOI] [PubMed] [Google Scholar]
- 61.Karrer B., Newman M. E., Message passing approach for general epidemic models. Phys. Rev. E Stat. Nonlin. Soft Matter Phys. 82, 016101 (2010). [DOI] [PubMed] [Google Scholar]
- 62.Shrestha M., Scarpino S. V., Moore C., Message-passing approach for recurrent-state epidemic models on networks. Phys. Rev. E 92, 022821 (2015). [DOI] [PubMed] [Google Scholar]
- 63.Milling C., Caramanis C., Mannor S., Shakkottai S., “On identifying the causative network of an epidemic” in 50th Annual Allerton Conference on Communication, Control, and Computing, Basar T., Hajek B., Eds. (IEEE, Piscataway, NJ, 2012), pp. 909–914.
- 64.Altarelli F., Braunstein A., Dall’Asta L., Lage-Castellanos A., Zecchina R., Bayesian inference of epidemics on networks via belief propagation. Phys. Rev. Lett. 112, 118701 (2014). [DOI] [PubMed] [Google Scholar]
- 65.Perl J., “Reverend Bayes on inference engines: A distributed hierarchical approach” in AAAI’82: Proceedings of the Second AAAI Conference on Artificial Intelligence, Waltz D. W., Ed. (AAAI Press, Palo Alto, CA, 1982), pp. 133–136.
- 66.Gonzalez T., Handbook of Approximation Algorithms and Metaheuristics (Chapman and Hall/CRC, Boca Raton, FL, 2018). [Google Scholar]
- 67.Shah D., Zaman T., “Detecting sources of computer viruses in networks: Theory and experiment in SIGMETRICS 2010” Proceedings of the 2010 ACM SIGMETRICS International Conference on Measurement and Modeling of Computer Systems, Misra V., Barford P., Squillante M. S., Eds. (Association for Computing Machinery, New York, 2010), pp. 203–214.
- 68.Horn A. L., Friedrich H., Locating the source of large-scale outbreaks of foodborne disease. J. R. Soc. Interface 16, 20180624 (2019). [DOI] [PMC free article] [PubMed] [Google Scholar]
- 69.Lokhov A. Y., Mézard M., Ohta H., Zdeborová L., Inferring the origin of an epidemic with a dynamic message-passing algorithm. Phys. Rev. E Stat. Nonlin. Soft Matter Phys. 90, 012801 (2014). [DOI] [PubMed] [Google Scholar]
- 70.Moon S. A., Sahneh F. D., Scoglio C., Group-based general epidemic modeling for spreading processes on networks: GroupGEM. IEEE Trans. Netw. Sci. Eng. 8, 434–446 (2021). [Google Scholar]
Associated Data
This section collects any data citations, data availability statements, or supplementary materials included in this article.
Supplementary Materials
Data Availability Statement
There are no data underlying this work.