

Abstract
Motivation
In the last decade, de novo protein structure prediction accuracy for individual proteins has improved significantly by utilising deep learning (DL) methods for harvesting the co-evolution information from large multiple sequence alignments (MSAs). The same approach can, in principle, also be used to extract information about evolutionary-based contacts across protein–protein interfaces. However, most earlier studies have not used the latest DL methods for inter-chain contact distance prediction. This article introduces a fold-and-dock method based on predicted residue-residue distances with trRosetta.
Results
The method can simultaneously predict the tertiary and quaternary structure of a protein pair, even when the structures of the monomers are not known. The straightforward application of this method to a standard dataset for protein–protein docking yielded limited success. However, using alternative methods for generating MSAs allowed us to dock accurately significantly more proteins. We also introduced a novel scoring function, PconsDock, that accurately separates 98% of correctly and incorrectly folded and docked proteins. The average performance of the method is comparable to the use of traditional, template-based or ab initio shape-complementarity-only docking methods. Moreover, the results of conventional and fold-and-dock approaches are complementary, and thus a combined docking pipeline could increase overall docking success significantly. This methodology contributed to the best model for one of the CASP14 oligomeric targets, H1065.
Availability and implementation
All scripts for predictions and analysis are available from https://github.com/ElofssonLab/bioinfo-toolbox/ and https://gitlab.com/ElofssonLab/benchmark5/. All models joined alignments, and evaluation results are available from the following figshare repository https://doi.org/10.6084/m9.figshare.14654886.v2.
Supplementary information
Supplementary data are available at Bioinformatics online.
1 Introduction
Protein structure is crucial for our understanding of biological function. However, experimentally determining the structure of a protein is still time-consuming and expensive. Therefore, computational methods will be the only method to determine the structure of most proteins in the foreseeable future. Until recently, the only method to reliably predict the structure of a protein was to model it using a homologous template. However, reliable templates are not available for close to half the residues in the human proteome (Perdigão et al., 2015).
Proteins do, however, not act alone. They function by interacting with other proteins and other molecules. Protein interaction can vary from stable interaction, present in protein complexes, to transient interactions often used for regulation. Experimentally, the study of stable protein interactions can be done using various techniques. Structural determination methods, including crystallography and Cryo-EM electron microscopy, can solve the structure of protein complexes, while other methods can be used to identify that two proteins interact without obtaining detailed structural information.
For several decades, the prediction of protein structure directly from sequence information has been an unachievable dream. Contact prediction methods based on co-evolution were introduced in the 1990s (Göbel et al., 1994), but the progress was limited even using deep learning (DL) (Eickholt and Cheng, 2012). The situation changed about a decade ago when improved methods using co-evolution achieved sufficient residue contact information to predict the structure of many proteins (Morcos et al., 2011, 2012). Later, DL (Skwark et al., 2014; Wang et al., 2017) and prediction of residue–residue distances provided further improvements (Senior et al., 2020; Xu, 2019). Today, this means that for many, if not most, individual protein domains, it is possible to predict the structure of folded domains accurately (Greener et al., 2019). Recently, Deepmind demonstrated at CASP14 that using an end-to-end learnable approach, high-quality prediction of almost all protein domains is already feasible. After submitting the initial version of this manuscript, two methods Alphafold (Jumper et al., 2021) and RoseTTAFold (Baek et al., 2021), have become available to the general public. In addition, the AlphafoldDB makes models for all proteins from 20 organisms available through EBI (Jumper et al., 2021; Tunyasuvunakool et al., 2021).
In principle, the same type of methods used for predicting the structure of a single protein can predict the interaction between two proteins (Hopf et al., 2014; Ovchinnikov et al., 2014). However, one fundamental difference is that it is necessary to create paired alignments to identify the interaction between two proteins, i.e. identifying what pairs of proteins interact in the same manner. The identification of interacting pairs is assumed to be relatively easy for pairs of proteins that only exist as single orthologs in all genomes, but the exact pairing is difficult when paralogs exist (Bitbol, 2018).
Prediction of protein interactions has been an even more significant challenge than predicting the structure of individual proteins. Many different techniques have been developed, but in short, they can be divided into four categories: (i) docking primarily based on shape complementarity (Tovchigrechko and Vakser, 2006), (ii) template-based modeling (Kundrotas and Vakser, 2009) and (iii) flexible docking (Schindler, 2016; Schueler-Furman et al., 2005). Various energy functions have also been used to identify correct docking poses (Anishchenko et al., 2018). In addition, co-evolution-based methods have also been used to predict the structure of complexes (Hopf et al., 2014; Schug et al., 2009).
Benchmarks have been developed to elucidate the advantages and disadvantages of different docking methods (Liu et al., 2008). Shape complementarity works excellently on native complexes, but the accuracy drops fast when using the structures of unbound complexes and even further if models of the proteins are used (Mintseris et al., 2005; Tovchigrechko and Vakser, 2005). Template-based modeling works excellently if a complex with significant sequence identity exists in PDB but does not work for novel complexes (Kundrotas et al., 2012; Yan et al., 2017).
Successful DCA-based methods to predict protein–protein interactions preceded the large-scale prediction of single proteins by predicting the bacterial two-component signalling in 2009 (Schug et al., 2009). These methods were then extended to several other complexes by several groups (Hopf et al., 2014; Ovchinnikov et al., 2014). However, it is still unclear how generally applicable these methods are, but the potential to vastly increase the space of known protein–protein interactions should involve using some type of co-evolution-based methods. The computational cost limits flexible docking, but a fold-and-dock protocol (Das et al., 2009) can be fast enough.
In addition to determining the structure of a protein complex, it is also crucial to determine which proteins interact. However, protein–protein interaction is not an easily defined entity. It might include anything from proteins regulating the expression of genes to proteins strongly bound to each other in a large molecular machine. Several interaction databases exist (Orchard et al., 2014; Szklarczyk et al., 2019), and co-evolution has been used to predict these interactions (Cong et al., 2019).
Here, we examine if it is possible to simultaneously fold and dock two proteins using co-evolutionary information and not only dock them. In addition, we use one of the best methods, trRosetta, instead of DCA (Morcos et al., 2011) based methods to predict intra- and inter-chain distances. One advantage of a fold-and-dock methodology is that it is not dependent on the availability of individual structures and should therefore be less sensitive to structural rearrangements upon binding. The disadvantage is that there are many more degrees of freedom in the system. We find that for several cases, it is possible to fold and dock the dimer simultaneously accurately. Although the success rate is low (<10%), this is comparable to the accuracy of other docking methods, which utilizes the structure of both individual proteins. In addition, the methods are complementary.
2 Materials and methods
2.1 Dataset
To evaluate the performance of various docking methods, we use the unbound structures for 221 hetero-dimeric only protein complexes from Dockground 4.3 (Liu et al., 2008), as we cannot use the fold-and-dock protocol for homodimers (see the figshare repository (Elofsson, 2021)). It cannot be used for homodimers because, in a homodimer, the intra- and inter-chain distances will be predicted identically, i.e. the inter-distances will be a copy of the intra-chain distances. Therefore, a different strategy to predict inter-chain distances is needed to use a fold-and-dock protocol for homodimers.
2.2 Evaluation
The main evaluation criteria to evaluate the success in docking used here were the dockQ score (Basu and Wallner, 2016; Liu et al., 2008), which gives 0 to a random prediction and 1 to a perfect prediction. Here, it should be noted that a dockQ score over 0.23 roughly corresponds to an ‘acceptable’ model in CAPRI (Lensink and Wodak, 2013), and we will therefore call all models with dockQ >0.23 as correct and all others as incorrect. To evaluate the quality of the individual models, we have used TM-score (Lensink and Wodak, 2013; Zhang, 2005). We also use MM-align for comparing docked models (Mukherjee and Zhang, 2009).
We do also analyze the accuracies of the distances predicted by trRosetta with actual distances. For simplicity, we have in several cases redefined the distances (both predicted and real) as contacts using a cutoff of 12 Å, i.e. only predicted or native distances shorter than 12 Å are included. Here, the probability distance distribution from trRosetta is converted using the weighted means of all probabilities.
2.3 Paired alignments
An overview of the method is described in Figure 1. First, two multiple sequence alignments (MSAs) are created starting from two proteins, which are assumed to interact. We search both sequences against a proteomic database using jackhmmer (Eddy, 2011; Mukherjee and Zhang, 2009). Several different alignment parameters and databases were tried; see Supplementary Table S1. The default database used is all reference proteomes from UniProt (The UniProt Consortium, 2009) as of May 2020. This dataset consists of 55 million sequences. In addition, we tried to use only bacterial proteomes (30 million sequences) or all (non-excluded) proteomes from UniProt (199 million sequences) with a few alignment parameters, see above.
Fig. 1.

Pipeline of the Fold-and-Dock protocol. First, two multiple sequence alignments are created using, for instance, jackhmmer. Second, these are merged by identifying potential pairs of orthologs. Then trRosetta is used to predict all pairwise distances. Here, the predicted (lower triangle) and actual (upper triangle) distance map for 4gmj is shown. The two blue stripes represent the poly-G linker between the two chains. Next, a model is created using pyConsfold,based on CNS (Chaudhury et al., 2010; Adams et al., 2013), or pyRosetta. Here, the natural (dark colours) and modeled (light colours) structure of the protein 4gmj is shown. The model’s accuracy is good, dockQ score 0.42, and the TM-scores for the two chains are 0.82 and 0.85, respectively. Finally, the models are scored using PconsDock, a consensus-based docking score. Here, two examples are shown 1vrs (left) where no consensus is seen and 1ay7 (right) where all five models are virtually identical
The critical component in our algorithm is the formation of paired alignments, i.e. a set of aligned protein pairs assumed to interact in the same way. Therefore, the next step is to create a paired alignment for the two protein chains. The pairing is based on all proteomes where both proteins have a hit. Here, the top hit of each protein is used to create the merged MSA. We ignored proteomes when both proteins had identical top hits, as this caused artefacts. We also tried to use a reciprocal best hit (Cong et al., 2019), i.e. only including the top hits if the original proteins also were top-ranked for these proteins in their proteome.
After the paired sequences are identified, they are merged to form a paired multiple sequence alignment. Here, 20 glycines are inserted between the two sequences to avoid edge effects. The two alignments can be merged in two different orders, and both were tried as in a few cases, one of the orders provided better predictions.
Finally, the paired alignment was ‘trimmed’ to take away sequences with too many gaps. By default, sequences with more than 25% gaps in the merged alignment were excluded, but other parameters were also tried (see Supplementary Table S1).
2.4 Distance predictions
Distance and angles were predicted using trRosetta from the paired alignment. We also tried one alternative method to predict contacts, RaptorX, to predict complex interactions (Jing et al., 2020). However, this method does not provide distances, just contacts, and therefore, it is necessary to add predicted secondary structures from psipred when using these contacts. The distances were then used in Rosetta as described in the original trRosetta protocol.
2.5 The fold-and-dock protocol
Fold and dock were performed using the same protocol and constraints as in trRosetta for the two chains separately (obviously, they were treated as two separate molecular objects). The same optimization protocol (minmover) was used. However, an additional set of inter-chain constraints was added to form a weak flat-harmonic potential between all inter-chain pairs of residues with a predicted contact probability of over 50%. These constraints were necessary to ensure that the two chains were modeled near each other; see the GitHub repository for details. We also used pyconsFold (Lamb and Elofsson, 2021) for fold-and-dock, both with distances predicted by trRosetta and with contacts predicted by RaptorX.
2.6 Shape complementarity docking
For comparison, we used the GRAMM scan stage (Lamb and Elofsson, 2021; Tovchigrechko and Vakser, 2006) with the default parameters to generate an initial set of docking decoys for the same dataset. We used the AACE18 contact potential (Anishchenko et al., 2018). In addition, we used the predicted contacts (all with probability > 0.5 and distance shorter than the predicted distance plus 2 Å) as a constraint to GRAMM. We used both trRosetta and RaptorX to predict the distances.
2.7 Template-based docking
We also used the TMdock (Kundrotas and Vakser, 2009) with the standard full-structure template library for template-based docking. To avoid including templates with high sequence identity to the target structure, we excluded all template hits where both chains in a complex have significant (E-value < 10–2) similarity to the templates. If this is not done, the performance of TMdock would be much higher.
3 Results
Our protocol described in Figure 1 starts from two multiple sequence alignments, created by searching with jackhmmer (Eddy, 2011) against all complete proteomes from UniProt (UniProt Consortium, 2019). After that, a combined multiple sequence alignment is created by including the top paired hit from each proteome. Next, 20 Glycine residues were added to separate the two sequences in the combined multiple sequence alignment. The combined alignment can be created in two orientations, A-B and B-A. In addition, a few alternative methods both for generating the alignments and selecting the sequences were tried. These are discussed below. It should be noted that the depth of the combined multiple sequence alignment is often significantly smaller than for the individual proteins.
Next, the combined multiple sequence alignment is used to predict distances and angles using trRosetta (Yang et al., 2020). These are then provided to pyRosetta (Chaudhury et al., 2010) or pyconsFold (Lamb and Elofsson, 2021) to fold and dock the two proteins.
Below, we will discuss when this methodology works, when it fails, compare the performance of different alignments, compare the performance with other docking techniques, and finally introduce a score, PconsDock, which can accurately be used to distinguish successful and unsuccessful docking attempts.
3.1 Example of successful fold and dock
First, we demonstrate that the algorithm can accurately fold and dock a pair of proteins in at least one case. Supplementary Figure S1 presents one successful example of the fold-and-dock protocol for the human protein complex between NOT1 MIF4G and CAF1 (PDB: 4gmj) (Petit et al., 2012). The prediction is built on an alignment containing 1189 sequences (Meff = 523) created by three iterations of jackhmmer (Eddy, 2011) and an E-value cutoff of 10-3 against all reference proteomes in UniProt (UniProt Consortium, 2019). Visually, it can be seen that the intra-chain distance maps are similar and most intra-chains contacts are predicted accurately (PPV > 0.90 for both chains), resulting in well-folded models of both chains (TM-score > 0.8 for both). In total, 139 out of 287 inter-chain contacts are accurately predicted (287 contacts predicted with a PPV of 49%). The final docked model is also accurate (dockQ score 0.42). However, as we will show below, unfortunately, many models are not as easy to model as 4gmj. Therefore, to test the algorithm’s performance, we have used 222 heterodimeric protein pairs from dockground 4.3 (Liu et al., 2008; UniProt Consortium, 2019).
3.2 Modeling accuracy depends on the size of the MSA; docking performance does not
The Dockground heterodimeric dataset was used to test the performance of the fold-and-dock methodology. First, we examined the dependence of the size of the multiple sequence alignment on the performance. The average TM-score for both chains increases with the size of the combined alignment (Fig. 2). At a depth of 100 sequences, the average TM-score is over 0.6, indicating that about 100 effective sequences are in most cases sufficient to obtain the fold of a protein.
Fig. 2.
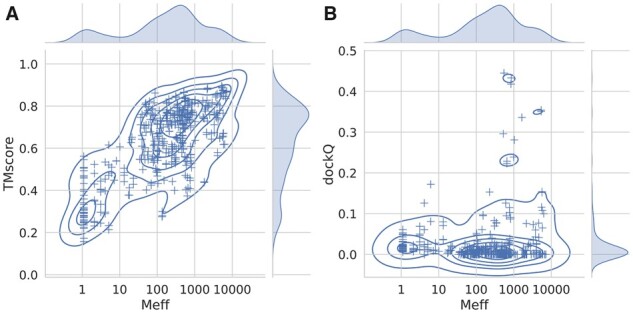
Performance of the fold-and-dock methodology versus the size of the joint alignments. Average TM-score of the two chains (A) and dockQ scores (B) plotted against the size of the multiple sequence alignment used to predict the contacts
Next, we examined the quality of the predicted dimers (Fig. 2B). A few models are docked correctly (dockQ score > 0.23). However, most protein pairs are not accurately docked (dockQ score close to 0), and the average dockQ score is only 0.02. Further, there is no apparent increase in the docking quality with more sequences in the MSA. What distinguishes the handful of docked models accurately is that they all seem to have between 100 and 1000 effective sequences in the merged alignments. However, it is also clear that many other protein pairs have MSAs of the same size but are not correctly docked. Next, we will examine how the docking is affected by the use of alternative alignments.
3.3 Different alignments sometimes produce better models
We examined different cutoffs, different minimum coverage of the alignments, and a different number of predictions to be included. We also tried to use a reciprocal best hits approach, i.e. only include proteins if orthologs, as described elsewhere (Green et al., 2021). In Figure 3, the folding and docking results for a selected subset of approaches can be seen, and for additional ones in Supplementary Table S1. It can be noted that we also tried several other combinations, including the merging of predictions from alternative alignments, but none of these provided significant improvements, and for simplicity, we, therefore, focus on the methods used in Figure 3 (marked with a * in Supplementary Table S1).
Fig. 3.
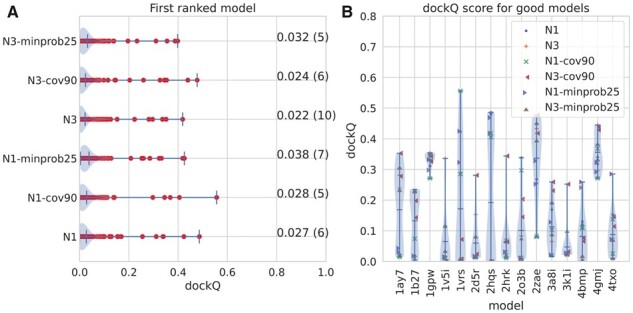
Results of Fold and Dock using different alignments. (A) dockQ scores for all models using six different alignments (see Supplementary Table S1). (B) The dockQ scores for the 15 proteins where at least one of these six alignments produce an acceptable model (dockQ > 0.23)
First, it can be noted that in some cases, one alignment methodology provides better contact maps than another. In Supplementary Figure S1, the contact maps of N- and C-terminus of redox catalyst DsbD (PDB : 1vrs) (Rozhkova et al., 2004) using one (Supplementary Fig. S1A) or three (Supplementary Fig. S1B) iterations of jackhmmer searches are shown. When using three iterations, 66 contacts are predicted, and 82% of these are correct. In contrast, when using one iteration, zero inter-chain contacts are predicted. The opposite can be noted for the RNase Sa complex with Barstar (PDB : 1ay7) (Sevcík et al., 1998), where one iteration makes a much better distance map than with three iterations (Supplementary Fig. S1C and D).
In Figure 3A, it can be seen that six different alignments methods roughly produce the same number of correctly docked models (three to ten). A similar trend can be seen for more methods in Supplementary Table S1. Further, it is not always the same method that produces the best model (see Fig. 3B). Here, it can also be seen that for most of the 15 models where at least one method produces a good model, only a few methods produce a good one. The exceptions are 1gpw, 2zae and 4gmj, where most methods produce good docking results, indicating that the fold-and-dock methodology could be improved if there was a methodology to identify the best way to generate the multiple sequence alignment.
3.4 Comparison of docking protocols
We have also developed a CNS-based method to fold-and-dock two proteins, named pyconsFold (Lamb and Elofsson, 2021). The advantage of this method is that it is about 10 times faster than trRosetta, and the docking results are similar (Fig. 4A). However, the quality of the independent proteins is less accurate, average TM-score 0.44 versus 0.63 (Fig. 4B). We also used RaptorX to predict inter-chain contacts using the web server (Jing et al., 2020). These results are also in line with the other results, and the docking results are not better than those obtained by trRosetta (Fig. 4).
Fig. 4.
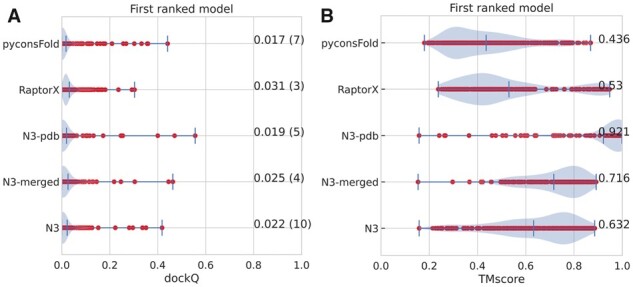
Results of alternative docking and folding protocols. Average dockQ score of the two chains (A) and TMscore scores (B). The default (N3) performance is compared with pyconsFold (uses the pyconsFold program instead of Rosetta), RaptorX (uses inter-chain contacts predicted by RaptorX instead of distances from trRosetta), RaptorX and N3-pdb use the intra-chain distances from the native structures, and N3-merged uses intra-chain distances predicted by the full alignments for each chain independently
So far, we have used the merged multiple sequence alignment to fold and dock the protein pairs. However, it is not optimal to use the multiple sequence alignment information to fold the individual chains. Instead, one can use the complete multiple sequence alignment for each of the two chains to predict the two intra-chain distance maps and then use these. Figure 4 shows that including more accurate intra-chain constraints improves the modeling of the individual chains, the average TM-score increases from 0.63 to 0.72, but the docking does not improve. Alternatively, it is also possible to use the distance from the structures, if available, of the individual proteins for the folding. Using this information improves the TM-score to 0.92, but the average docking results are not improved.
4 Discussion
So far, we have shown that for 15 out of the 222 heterodimeric models in dockground 4.3. It is possible to create an acceptable (dockQ > 0.23) model using predicted distances and a fold-and-dock protocol. However, no single alignment method does more than ten, i.e. if we can identify the optimal alignments for each target, it would be possible to improve the performance. Therefore, we first set out to identify factors that separate correct and incorrect models.
4.1 Features separating correct and incorrect models
Most protein pairs cannot be docked correctly, and often only a subset of the alignments work. What are the significant factors that distinguish the successful and unsuccessful cases? Figure 5 shows some features with some capacity for separation correct (dockQ > 0.23) and incorrect models by plotting density plots. Note that, there are many more incorrect models, so we analyze the frequency of the features and not the numbers for comparison.
Fig. 5.
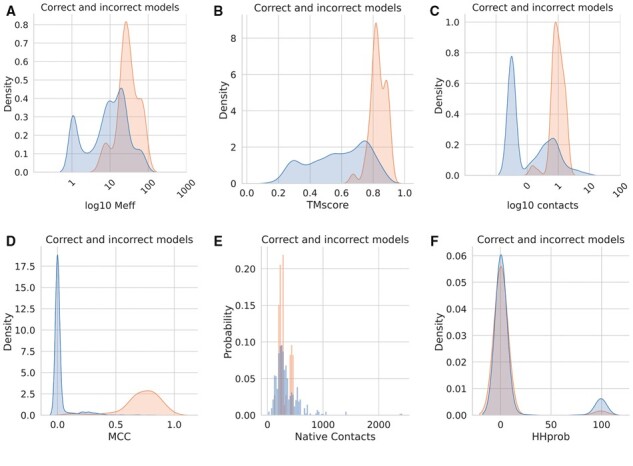
Features separating good (yellow) and bad (blue) models. Good models are defined as having a dockQ score over 0.23. All models from all the methods marked with a star in Supplementary Table S1 are included. (A) Distribution of the number of effective sequences (log10 of Meff), (B) average TM-scores of chain A and B, (C) number of inter-chain contacts predicted, (D) MCC values describing the accuracy of the inter-chain contacts, (E) number of contacts in the native interface and (F) HHprob (similarity) between chain a and chain b in the complex
First, it can be seen that the successful dockings tend to have a multiple sequence alignment of 100 or more residues (see Fig. 5A). It can be noted that about 25% of the protein pairs have less than ten effective sequences in the merged alignments and 50% less than 100. Only three proteins with 100 sequences or less have a correct model and no one with less than 35 effective sequences. The TM-score of all correctly docked models is high (>0.67), not surprisingly, as the TMscore increases with larger MSAs. However, there are also many models with good TM scores but with incorrect docking. Interestingly, many good single chain models with very few sequences in the MSA exist. The highest TM-score for a model with only one sequence in the MSA is 0.56.
Next, when studying the number of inter-chain contacts predicted, it is clear that there is a narrow range of contacts around 100 (average 125) in all successful models. These predictions are mostly correct (MCC values over 0.5). In contrast, a large set (50%) of all models have no contacts predicted. However, many incorrect models have a similar number of predicted contacts as the correct models, but these predictions are simply wrong (MCC values close to zero). Interestingly, some unsuccessful models have more contacts predicted than the successful ones, and most models (both correct and incorrect) have about 500 contacts (<12 Å) in the native structure.
Further, most correct models have high precision (∼0.8) among the predicted contacts, but the recall is low (∼0.4) (Supplementary Fig. S2). There is also a group of correct models with a PPV of ∼0.5 and a higher recall (∼0.6). However, there are also a few correct models with very few correctly predicted contacts. One model has only two inter-chain contacts predicted, and one of them is wrong, showing the even a single contact is sometimes sufficient for docking.
4.2 Pseudo homodimers and repeats can cause artefacts
As noted above, some unsuccessful models have very many inter-chain contacts predicted, caused by artefacts similar to the one shown in Figure 6A–C. This type of artefact seems to be caused by homology between the two chains (sequence identity of 29% for 3qlu). This homology generates the coevolutionary signal from the intra-chain contacts to be reproduced as inter-chain contacts. The protein 3pv6 (sequence identity 29%) is even more complicated as the artefact does not cover the entire first chain. Still, instead, the first chain contains two homologous domains and the second chain a third homologous domain. Another type of artefact is seen in 4yoc, where a larger number of incorrect predictions occur.
Fig. 6.
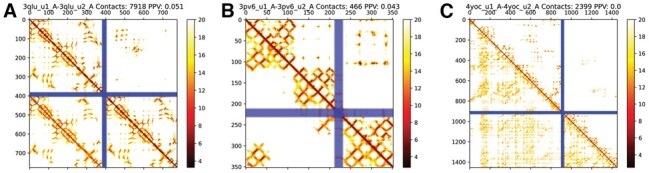
Distance maps for predicted (lower left) and native (upper right) distances for three proteins with artefacts 3qlu (A), 3pv6 (B) and 4yoc(C)
To study how similarity between the two chains affects the docking results, we used HHalign to compare the multiple sequence alignments in a complex. In Figure 5F, it can be seen that a set of (21) protein pairs exist with an HHalign probability of 99% or higher. The vast majority of these models are wrong (19), and some (9) of them have more than 1000 predicted contacts. We tried different strategies to reduce these artefacts, including reciprocal best hits (Supplementary Fig. S3). However, when this is done, the actual inter-chain contacts are also lost. It is possible that other strategies, similar to those used for homodimers (Quadir et al., 2021), could work better. Until now, we have not succeeded in getting rid of the artefacts without losing the actual contacts.
4.3 Consensus scoring can separate correct and incorrect models
Is there a possibility to distinguish between correct and incorrect models? When modeling individual proteins, it has often been useful to compare the produced models to measure their reliability. These quality estimates have been successful in CASP since CASP5 (Lundström et al., 2001; Wallner and Elofsson, 2005). Here, we estimate to use the same idea for docking.
For consensus scoring, it is necessary to have at least two models to compare and measure the similarity of models. We examined two alternative sets of models and two alternative scoring functions. We can compare the two alternative orientations of the merged alignments (chain A–B versus B–A) or generate five models with the same orientation. The models can then be compared using dockQ (Basu and Wallner, 2016) or MMscore (Mukherjee and Zhang, 2009) (see Table 1).
Table 1.
Overview of methods used to rank models
| Name | Comparison method | Models to compare | AUC | No. of correct first ranked models | Average (dockQ) of first ranked models |
|---|---|---|---|---|---|
| PconsDock-MMpair | MMscore | Reversed alignments | 0.95 | 8 | 0.036 |
| PconsDock-MMcons | MMscore | Five models | 0.98 | 9 | 0.039 |
| PconsDock-dockQpair | dockQ | Reversed alignments | 0.92 | 7 | 0.042 |
| PconsDock-dockQcons | dockQ | Five models | 0.94 | 10 | 0.040 |
| TMscore | — | Model ranked by TMscores for both chains. | N/A | 8 | 0.030 |
| N3 | — | Only first ranked model from N3 | N/A | 10 | 0.022 |
| dockQ | dockQ | Models ranked by dockQ score. | N/A | 15 | 0.069 |
Note: The four first rows represent methods based on consensus. The next three rows represent comparisons: TMscore is based on ranking by TMscore for the individual chains, dockQ is the optimal performance (best model ranked first) and N3 uses only one alignment (N3).
All four methods are excellent at separating the correct and incorrect models (AUC > 0.93) for all methods. However, the methods that use five models are slightly better (Supplementary Fig. S4) possibly due to the (few) cases where only one of the contact maps generates a good model, as in the reverse order maps, both models have the same score. All four consensus methods identify a few more correct methods than the models from the best single alignment, and the MMcons and dockQcons methods also identify one or two more correct models than dockQpair and MMpair (Supplementary Fig. S4A).
Next, we compared the quality of the first ranked models using different ranking schemes (Table 1). Consensus ranking increases the average dockQ from 0.022 to a maximum of 0.042. However, the number of correct models is not increased. Only one of the four consensus schemes identifies the same number of correct models, showing that the consensus scoring is not optimal to identify the best model, although it is an excellent measure to separate good and bad models. We also examined the possibility to use the quality of the individual models (as measured by their average TM-score), but this was not better than PconsDock (see Table 1).
4.4 Successful models for all kingdoms of life
The basic information used to dock two proteins is coevolution in conserved interaction patterns in protein–protein interfaces. Detecting inter-chain coevolutionary signals requires identifying protein pairs that interact in the same way, which is much easier if there are few (or no) paralogs and the proteins are only involved in a few (or only one) specific interaction. Presumably, this is easier for prokaryotic protein pairs as these have fewer paralogs and, therefore, the interaction partners are more likely to be conserved among the identified orthologs. However, it is also possible that using both eukaryotic and prokaryotic sequences can help (Rodriguez-Rivas et al., 2016).
Out of the 15 models with successful predictions, the majority are predominantly unique to bacteria (as defined with more than 75% of the sequences in the merged alignment being bacterial) (Fig. 7A). However, four are mixed, as defined that no kingdom has more than 74% of the sequences, three are mainly (>75%) eukaryotic, and one consist mainly of archaea. The fact that successful prediction exists in all classes shows that this methodology is not exclusively useful for bacterial protein pairs, although the performance is, on average, slightly better for the prokaryotic protein pairs (Fig. 7A).
Fig. 7.
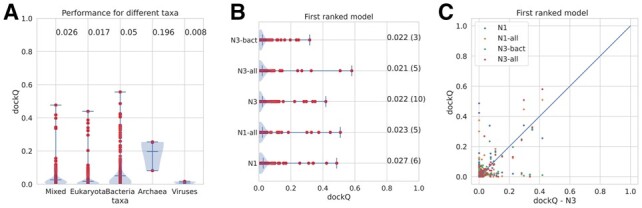
(A) Prediction qualities for models from different kingdoms of life using the N3-predictions. (B) Predictions qualities for all models using different alignments and sequence databases (see Supplementary Table S1 for details). (C) Comparison of dockQ scores for individual models compared to the N3 models
Next, we tried to use a bacterial specific sequence database for constructing the multiple sequence alignments (N3-bact) (Fig. 7B and C). Here, it can be seen that the quality of a few models got worse, and only one improved significantly. The dockQ score of 2o3b (Nuclease A from E.coli) improved from 0.00 to 0.23. The paired multiple sequence alignment for 2o3b when using all reference proteomics is mainly eukaryotic, showing that in this case, the inclusion of eukaryotic genomes generates noise, losing the signal. It also shows that a smaller (Meff = 68 versus 306) multiple sequence alignment is sometimes to prefer. One example of a lost signal is when eukaryotic proteomes are excluded from the MSA of 2zae (archaeal homolog of the human protein complex Rpp21-Rpp29), whose dockQ scores drop from 0.42 to 0.01. In the original alignment, about 70% of the sequences are eukaryotic, and the size of the MSA drops from 839 effective sequences to one sequence when eukaryotes are excluded.
In the alignments discussed above, we have only used the reference proteomes, but it is also possible to use all complete proteomes from UniProt. This dataset is more than three times larger, and most of the additional proteomes are bacterial. Figure 7 shows that the overall performance does not change significantly by using the larger database. However, there are a few targets whose performance increases significantly. The most striking improvement is obtained for 2zae, whose dockQ score increases from 0.43 to an impressive 0.58 (Fnat 0.468 iRMS 1.975 LRMS 2.745 Fnonnat 0.326). The prediction of 2zae is the best prediction obtained. Another example is 2hrk (Arc1p and MetRS from yeast) which improves from 0.07 to 0.32. Anyhow, the inclusion of many more proteomes only makes a significant impact on a few proteins.
We also examined the subcellular location of the successful targets. There is a tendency to have more membrane related (4/15 compared with 9% in the dataset) interactions. The successful targets include periplasmic (3/15), extracellular (3/15), cytoplasmic (4/15) and one nuclear target. Given the low number of successful docking cases, we cannot judge the significance of any preference for any specific localization; the methodology can be applied to targets from various locations.
4.5 Comparison to TMdock and GRAMM
How well does the fold-and-dock methodology compare with traditional docking methods? First, we compared it to one shape complementarity method, GRAMM and one template-based docking method, TMdock (see Fig. 8). In the pure numbers, it can be seen that the FFT-based GRAMM with the AACA18 potential for ranking outperforms the other methods. Further, using the contacts (either from trRosetta or RaptorX) as a scoring potential does not improve the performance of GRAMM, rather than the reverse. However, it should be noted that we only examined the most straightforward way to score the models, and some other strategy might improve the results.
Fig. 8.
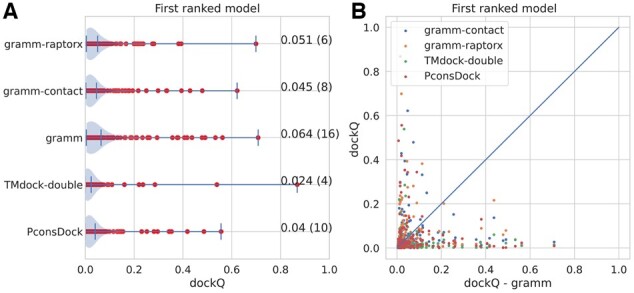
Comparison with GRAMM and TMdock. GRAMM-contact is the GRAMM-scores using predicted contacts as a constraint, GRAMM is GRAMM-docking ranked by the AACE18 scoring potential, TMdock-double is a template-based docking method
The results of TMdock are highly dependent on homology to known templates. Here, we excluded templates that were similar to the targets (see Methods). If close templates are included, the result for TMdock improves significantly.
In summary, none of the docking methods can be seen as wildly successful as all methods predict less than 10% of the first-ranked models correctly. However, there is room for improvement using a combination as the results appear complementary (Fig. 8B). No single model that GRAMM accurately predicts is accurately predicted by the Fold-and-Dock method or vice versa. Therefore, a combined method could, in the future, be used to improve the performance.
4.6 CASP14—successful prediction of H1065
We used the Fold-and-Dock approach to predict intra- and inter-distance contacts using trRosetta for all relevant targets in CASP14. For a few models, we got exciting fold-and-dock results; see the contact map in Supplementary Figure S5. These contacts were then used as a guide for further analysis and additional tests. This approach did not perform better than other methods in most models, but for one model (H1065), our third-ranked model was ranked as the best of all models submitted to CASP14. The third model was generated by TMdock (Anishchenko et al., 2017), refined using Rosetta minimization. Input monomers were selected from the models produced after the CASP modeling stage 2, considering ProQ4 scores and visual inspection. Submitted docking was obtained by running the best server models, selected by ProQ4, using TMdock against a library of interface-only structures. The selected model was the model most resembling the first ranked model from the fold-and-dock approach. According to the official CASP evaluation, the MMscore of the three models are 0.60, 0.48 and 0.84, and the global QS scores are 0.092, 0.060 and 0.685, clearly showing that the third model is better than the others. However, the structural similarity between the third and the first ranked model (generated directly by PconsDock) is high. This success shows that a potential path for further improving the fold-and-dock method includes an additional refinement protocol.
5 Conclusions
Here, we present an analysis of a fold-and-dock protocol based on predicted intra- and inter-chain distances using trRosetta. We show that it is possible to produce acceptable models using the fold-and-dock protocol for some targets. The success rate is comparable to traditional docking methods. However, we do believe that the potential of this type of fold-and-dock protocol is more extensive, as the method is not dependent on the structure of the individual protein chains, i.e. fold-and-dock methods are applicable to predict the structure of all complexes, including the ones involving flexible proteins.
One limitation of this study is that the network used here (trRosetta) is trained to predict intra-chain contacts, but we use it to predict inter-chain contacts. We trained a network specifically to predict inter-chain contacts, but the performance was not as good as trRosetta, possibly because it was trained on a significantly lower number of contacts. Further evidence is the observation that the RaptorX methodology specifically trained to predict inter-chain contacts does not perform significantly better than trRosetta.
The problem that remains unsolved is the choice of the best alignment for folding and docking. In some cases, only specific alignment gives correct folding and docking based on the proteins’ intrinsic evolutionary characteristic and interaction. Therefore, we believe that improving this methodology involves improving the merging of the two multiple sequence alignments. Alternatively, somehow, extracting additional information from the individual multiple sequence alignments. Identifying a priori the alignment containing more information is still an open challenge.
Acknowledgements
The authors thank the Swedish National Infrastructure for Computing for providing computational resources.
Funding
This work was supported by a grant VR-NT-2016-03798 from the Swedish National Research Council (www.vr.se) to A.E. Grants from the Swedish Research Council partly paid the salary of P.K., W.Z. and G.S.
Conflict of Interest: none declared.
Data Availability
All scripts for predictions and analysis are available from https://github.com/ElofssonLab/bioinfo-toolbox/trRosetta/.
Details for each run are available from https://github.com/ElofssonLab/bioinfo-toolbox/benchmark5/benchmark4.3/.
All models joined alignments, and evaluation results are available from a figshare repository (Elofsson, 2021).
Supplementary Material
Contributor Information
Gabriele Pozzati, Science for Life Laboratory and Department of Biochemistry and Biophysics, Stockholm University, 171 21 Solna, Sweden.
Wensi Zhu, Science for Life Laboratory and Department of Biochemistry and Biophysics, Stockholm University, 171 21 Solna, Sweden.
Claudio Bassot, Science for Life Laboratory and Department of Biochemistry and Biophysics, Stockholm University, 171 21 Solna, Sweden.
John Lamb, Science for Life Laboratory and Department of Biochemistry and Biophysics, Stockholm University, 171 21 Solna, Sweden.
Petras Kundrotas, Science for Life Laboratory and Department of Biochemistry and Biophysics, Stockholm University, 171 21 Solna, Sweden; Center for Computational Biology, The University of Kansas, Lawrence, KS 66047, USA.
Arne Elofsson, Science for Life Laboratory and Department of Biochemistry and Biophysics, Stockholm University, 171 21 Solna, Sweden.
References
- Adams P.D. et al. (2013) Advances, interactions, and future developments in the CNS, Phenix, and Rosetta structural biology software systems. Annu. Rev. Biophys., 42, 265–287. [DOI] [PMC free article] [PubMed] [Google Scholar]
- Anishchenko I. et al. (2018) Contact potential for structure prediction of proteins and protein complexes from Potts Model. Biophys. J., 115, 809–821. [DOI] [PMC free article] [PubMed] [Google Scholar]
- Anishchenko I. et al. (2017) Modeling complexes of modeled proteins. Proteins, 85, 470–478. [DOI] [PMC free article] [PubMed] [Google Scholar]
- Baek M. et al. (2021) Accurate prediction of protein structures and interactions using a three-track neural network. Science, 373, 871–876. [DOI] [PMC free article] [PubMed] [Google Scholar]
- Basu S., Wallner B. (2016) DockQ: a quality measure for protein–protein docking models. PLoS One, 11, e0161879. [DOI] [PMC free article] [PubMed] [Google Scholar]
- Bitbol A.-F. (2018) Inferring interaction partners from protein sequences using mutual information. PLoS Comput. Biol., 14, e1006401. [DOI] [PMC free article] [PubMed] [Google Scholar]
- Chaudhury S. et al. (2010) PyRosetta: a script-based interface for implementing molecular modeling algorithms using Rosetta. Bioinformatics, 26, 689–691. [DOI] [PMC free article] [PubMed] [Google Scholar]
- Cong Q. et al. (2019) Protein interaction networks revealed by proteome coevolution. Science, 365, 185–189. [DOI] [PMC free article] [PubMed] [Google Scholar]
- Das R. et al. (2009) Simultaneous prediction of protein folding and docking at high resolution. Proc. Natl. Acad. Sci. USA, 106, 18978–18983. [DOI] [PMC free article] [PubMed] [Google Scholar]
- Eddy S.R. (2011) Accelerated Profile HMM Searches. PLoS Comput. Biol., 7, e1002195. [DOI] [PMC free article] [PubMed] [Google Scholar]
- Eickholt J., Cheng J. (2012) Predicting protein residue–residue contacts using deep networks and boosting. Bioinformatics, 28, 3066–3072. [DOI] [PMC free article] [PubMed] [Google Scholar]
- Elofsson A. (2021) Dataset for fold and dock. https://scilifelab.figshare.com/articles/dataset/Dataset_for_fold_and_dock/14654886.
- Göbel U. et al. (1994) Correlated mutations and residue contacts in proteins. Proteins Struct. Funct. Genet., 18, 309–317. [DOI] [PubMed] [Google Scholar]
- Green A.G. et al. (2021) Large-scale discovery of protein interactions at residue resolution using co-evolution calculated from genomic sequences. Nat. Commun., 12, 1396. [DOI] [PMC free article] [PubMed] [Google Scholar]
- Greener J.G. et al. (2019) Deep learning extends de novo protein modelling coverage of genomes using iteratively predicted structural constraints. Nat. Commun., 10, 3977. [DOI] [PMC free article] [PubMed] [Google Scholar]
- Hopf T.A. et al. (2014) ESequence co-evolution gives 3D contacts and structures of protein complexes. Elife, 3, e03430. [DOI] [PMC free article] [PubMed] [Google Scholar]
- Jing X. et al. (2020) A web-based protocol for interprotein contact prediction by deep learning. Methods Mol. Biol., 2074, 67–80. [DOI] [PubMed] [Google Scholar]
- Jumper J. et al. (2021) Highly accurate protein structure prediction with AlphaFold. Nature, 596, 583–589. [DOI] [PMC free article] [PubMed] [Google Scholar]
- Kundrotas P.J. et al. (2012) Templates are available to model nearly all complexes of structurally characterized proteins. Proc. Natl. Acad. Sci. USA, 109, 9438–9441. [DOI] [PMC free article] [PubMed] [Google Scholar]
- Kundrotas P., Vakser I.A. (2009) Template-based modeling of protein–protein interfaces. Biophys. J., 96, 652a. [Google Scholar]
- Lamb J., Elofsson A. (2021) pyconsFold: a fast and easy tool for modelling and docking using distance predictions. Bioinformatics, 37, 3959–3960. [DOI] [PMC free article] [PubMed] [Google Scholar]
- Lensink M.F., Wodak S.J. (2013) Docking, scoring, and affinity prediction in CAPRI. Proteins, 81, 2082–2095. [DOI] [PubMed] [Google Scholar]
- Liu S. et al. (2008) DOCKGROUND protein–protein docking decoy set. Bioinformatics, 24, 2634–2635. [DOI] [PMC free article] [PubMed] [Google Scholar]
- Lundström J. et al. (2001) Pcons: a neural-network-based consensus predictor that improves fold recognition. Protein Sci., 10, 2354–2362. [DOI] [PMC free article] [PubMed] [Google Scholar]
- Mintseris J. et al. (2005) Protein-Protein Docking Benchmark 2.0: an update. Proteins, 60, 214–216. [DOI] [PubMed] [Google Scholar]
- Morcos F. et al. (2011) Direct-coupling analysis of residue coevolution captures native contacts across many protein families. Proc. Natl. Acad. Sci. USA, 108, E1293–301. [DOI] [PMC free article] [PubMed] [Google Scholar]
- Morcos F. et al. (2012) Estimation of residue–residue coevolution using direct coupling analysis identifies many native contacts across a large number of domain families. Biophys. J., 102, 250a. [Google Scholar]
- Mukherjee S., Zhang Y. (2009) MM-align: a quick algorithm for aligning multiple-chain protein complex structures using iterative dynamic programming. Nucleic Acids Res., 37, e83. [DOI] [PMC free article] [PubMed] [Google Scholar]
- Orchard S. et al. (2014) The MIntAct project–IntAct as a common curation platform for 11 molecular interaction databases. Nucleic Acids Res., 42, D358–63. [DOI] [PMC free article] [PubMed] [Google Scholar]
- Ovchinnikov S. et al. (2014) Robust and accurate prediction of residue-residue interactions across protein interfaces using evolutionary information. Elife, 3, e02030. [DOI] [PMC free article] [PubMed] [Google Scholar]
- Perdigão N. et al. (2015) Unexpected features of the dark proteome. Proc. Natl. Acad. Sci. USA, 112, 15898–15903. [DOI] [PMC free article] [PubMed] [Google Scholar]
- Petit A.-P. et al. (2012) The structural basis for the interaction between the CAF1 nuclease and the NOT1 scaffold of the human CCR4-NOT deadenylase complex. Nucleic Acids Res., 40, 11058–11072. [DOI] [PMC free article] [PubMed] [Google Scholar]
- Quadir F. et al. (2021) DNCON2_Inter: predicting interchain contacts for homodimeric and homomultimeric protein complexes using multiple sequence alignments of monomers and deep learning. Sci. Rep., 11, 12295. [DOI] [PMC free article] [PubMed] [Google Scholar]
- Rodriguez-Rivas J. et al. (2016) Conservation of coevolving protein interfaces bridges prokaryote–eukaryote homologies in the twilight zone. Proc. Natl. Acad. Sci. USA, 113, 15018–15023. [DOI] [PMC free article] [PubMed] [Google Scholar]
- Rozhkova A. et al. (2004) Structural basis and kinetics of inter- and intramolecular disulfide exchange in the redox catalyst DsbD. EMBO J., 23, 1709–1719. [DOI] [PMC free article] [PubMed] [Google Scholar]
- Schindler C.E.M. (2016) Flexible docking methods for investigating protein–protein interactions.
- Schueler-Furman O. et al. (2005) Progress in protein-protein docking: atomic resolution predictions in the CAPRI experiment using RosettaDock with an improved treatment of side-chain flexibility. Proteins, 60, 187–194. [DOI] [PubMed] [Google Scholar]
- Schug A. et al. (2009) High-resolution protein complexes from integrating genomic information with molecular simulation. Proc. Natl. Acad. Sci. USA, 106, 22124–22129. [DOI] [PMC free article] [PubMed] [Google Scholar]
- Senior A.W. et al. (2020) Improved protein structure prediction using potentials from deep learning. Nature, 577, 706–710. [DOI] [PubMed] [Google Scholar]
- Sevcík J. et al. (1998) Recognition of RNase Sa by the inhibitor barstar: structure of the complex at 1.7 A resolution. Acta Crystallogr. D Biol. Crystallogr., 54, 954–963. [DOI] [PubMed] [Google Scholar]
- Skwark M.J. et al. (2014) Improved contact predictions using the recognition of protein like contact patterns. PLoS Comput. Biol., 10, e1003889. [DOI] [PMC free article] [PubMed] [Google Scholar]
- Szklarczyk D. et al. (2019) STRING v11: protein-protein association networks with increased coverage, supporting functional discovery in genome-wide experimental datasets. Nucleic Acids Res., 47, D607–D613. [DOI] [PMC free article] [PubMed] [Google Scholar]
- The UniProt Consortium (2009) The Universal Protein Resource (UniProt) 2009. Nucleic Acids Res., 37, D169–D174. [DOI] [PMC free article] [PubMed] [Google Scholar]
- Tovchigrechko A., Vakser I.A. (2005) Development and testing of an automated approach to protein docking. Proteins, 60, 296–301. [DOI] [PubMed] [Google Scholar]
- Tovchigrechko A., Vakser I.A. (2006) GRAMM-X public web server for protein–protein docking. Nucleic Acids Res., 34, W310–4. [DOI] [PMC free article] [PubMed] [Google Scholar]
- Tunyasuvunakool K. et al. (2021) Highly accurate protein structure prediction for the human proteome. Nature, 596, 590–596. [DOI] [PMC free article] [PubMed] [Google Scholar]
- UniProt Consortium (2019) UniProt: a worldwide hub of protein knowledge. Nucleic Acids Res., 47, D506–D515. [DOI] [PMC free article] [PubMed] [Google Scholar]
- Wallner B., Elofsson A. (2005) Pcons5: combining consensus, structural evaluation and fold recognition scores. Bioinformatics, 21, 4248–4254. [DOI] [PubMed] [Google Scholar]
- Wang S. et al. (2017) Accurate de novo prediction of protein contact map by ultra-deep learning model. PLoS Comput. Biol., 13, e1005324. [DOI] [PMC free article] [PubMed] [Google Scholar]
- Xu J. (2019) Distance-based protein folding powered by deep learning. Proc. Natl. Acad. Sci. USA, 116, 16856–16865. [DOI] [PMC free article] [PubMed] [Google Scholar]
- Yang J. et al. (2020) Improved protein structure prediction using predicted inter-residue orientations. Proc. Natl. Acad. Sci. USA, 117, 1496–1503. [DOI] [PMC free article] [PubMed] [Google Scholar]
- Yan Y. et al. (2017) Addressing recent docking challenges: a hybrid strategy to integrate template-based and free protein-protein docking. Proteins, 85, 497–512. [DOI] [PubMed] [Google Scholar]
- Zhang Y. (2005) TM-align: a protein structure alignment algorithm based on the TM-score. Nucleic Acids Res., 33, 2302–2309. [DOI] [PMC free article] [PubMed] [Google Scholar]
Associated Data
This section collects any data citations, data availability statements, or supplementary materials included in this article.
Supplementary Materials
Data Availability Statement
All scripts for predictions and analysis are available from https://github.com/ElofssonLab/bioinfo-toolbox/trRosetta/.
Details for each run are available from https://github.com/ElofssonLab/bioinfo-toolbox/benchmark5/benchmark4.3/.
All models joined alignments, and evaluation results are available from a figshare repository (Elofsson, 2021).