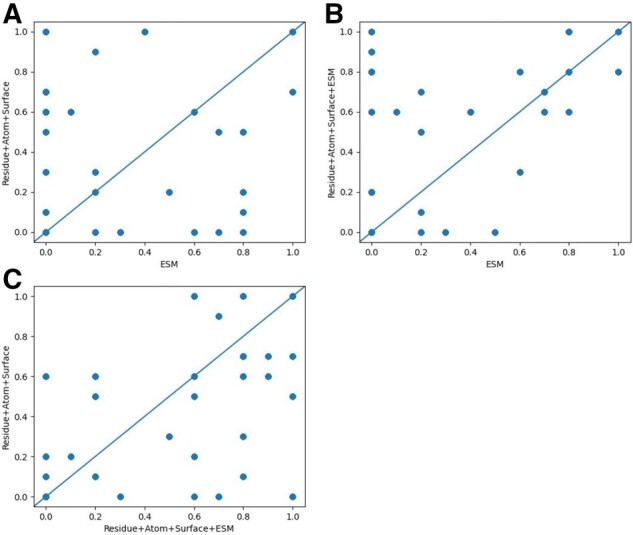
Fig. 2.

Comparison of top-10 precision of three models: ESM, Residue+Atom+Surface and Residue+Atom+Surface+ESM. (A) compares Residue+Atom+Surface and ESM, (B) compares Residue+Atom+Surface+ESM and ESM, and (C) compares Residue+Atom+Surface and Residue+Atom+Surface+ESM.
