Abstract
Background and Aims:
Acute pancreatitis (AP) is an inflammatory disease with mild to severe course that is associated with local and systemic complications and significant mortality. Uncovering inflammatory pathways that lead to progression and recovery will inform ways to monitor and/or develop effective therapies.
Methods:
We performed single-cell mass cytometry (CyTOF) analysis to identify pancreatic and systemic inflammatory signals during mild (referred as AP), severe AP (SAP) and recovery using two independent experimental models and blood from AP and recurrent AP (RAP) patients. Flowcytometric validation of monocytes subsets identified by CyTOF analysis was performed independently.
Results:
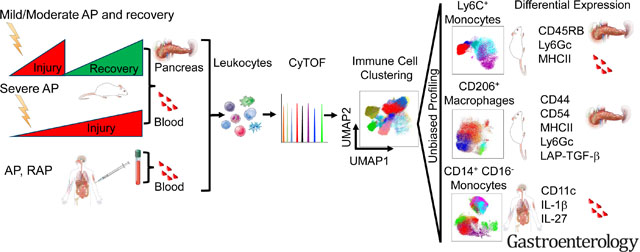
Ly6C+ inflammatory monocytes were most altered cells in the pancreas during experimental AP, recovery, and SAP. Deep profiling uncovered heterogeneity among pancreatic and blood monocytes and identified seven novel subsets during AP and recovery, and six monocyte subsets during SAP. Notably, a dynamic shift in pancreatic CD206+ macrophage population was observed during AP and recovery. Deeper profiling of the CD206+ macrophage identified seven novel subsets during AP, recovery and SAP. DE analysis of these novel monocyte and CD206+ macrophage subsets revealed significantly altered surface (CD44, CD54, CD115, CD140a, CD196, PDPN) and functional markers (IFN-γ, IL-4, IL-22, LAP-TGF-β, TNF-α, T-bet, RoRγt) that were associated with recovery and SAP. Moreover, a targeted functional analysis further revealed distinct expression of pro- and anti-inflammatory cytokines by pancreatic CD206+ macrophage subsets as the disease either progressed or resolved. Similarly, we identified heterogeneity among circulating classical inflammatory monocytes (CD14+CD16−) and novel subsets in patients with AP and RAP.
Conclusion:
We identified several novel monocyte/macrophage subsets with unique phenotype and functional characteristics that are associated with AP, recovery, and SAP. Our findings highlight differential innate immune responses during AP progression and recovery that can be leveraged for future disease monitoring and targeting.
Keywords: Acute Pancreatitis, Severe Acute Pancreatitis, CyTOF, Monocytes, Macrophages
Short Summary
Acute pancreatitis has no active therapy. Our study offers in-depth understanding of immune responses during pancreatitis progression and recovery that can be used for future monitoring and/or targeting the disease.
Graphical Abstract
Introduction
Acute pancreatitis (AP) is an inflammatory disease of the pancreas that can have a severe course with local and systemic complications 1. AP is characterized by the release of pro- and anti-inflammatory signals from injured acinar cells and leukocyte influx2. Despite disease burden, there is no FDA approved AP treatment. There is an urgent unmet need to understand disease progression and recovery immune responses in order to develop better tools to monitor and treat the disease.
Monocytes play important roles in tissue homeostasis, inflammation, and inflammatory response resolution3. Inflammatory mouse (Ly6C+)4 and human (CD14+CD16−) monocytes are induced during pancreatitis5. Earlier study suggested that activated circulating monocytes in severe AP (SAP) patients6 could be source of pancreatic macrophages. Macrophages regulate tissue regeneration following injury7. We previously defined a role for M2 macrophages in chronic pancreatitis8, and dynamic transcriptome changes occur during AP and recovery9. While these studies indicated that profiles of monocytes and macrophages are differentially altered during pancreatitis pathogenesis, the functional heterogeneity of the different circulating monocytes and pancreatic macrophages remains largely unexplored due to flow-cytometry based assay limitations.
We previously used CyTOF to define immune cell heterogeneity in IBD10. Uncovering immune signatures and inflammatory pathways could reveal markers of disease progression and recovery. We hypothesized that distinct immune signatures are associated with progression of AP from mild to severe disease or recovery. In this study, we performed CyTOF analysis to identify distinct immune responses associated with AP, recovery and progression to SAP using two independent AP mouse models (Figure 1A, 2A). CyTOF analysis identified alterations in a variety of immune cell subsets in both experimental models of mild AP (cerulein), recovery and SAP (choline-deficient DL-ethionine diet or CDE). Inflammatory monocytes (Ly6C+) were the top altered immune cell population in the pancreas during experimental AP, recovery, and SAP. In addition, we analyzed circulating monocytes from pancreatitis patients. Unbiased deep profiling of systemic and tissue monocytes and macrophages revealed novel subsets with distinct profiles. The identified novel signatures have a potential to improve our understanding and serve as monitoring tools and/or therapeutic targets.
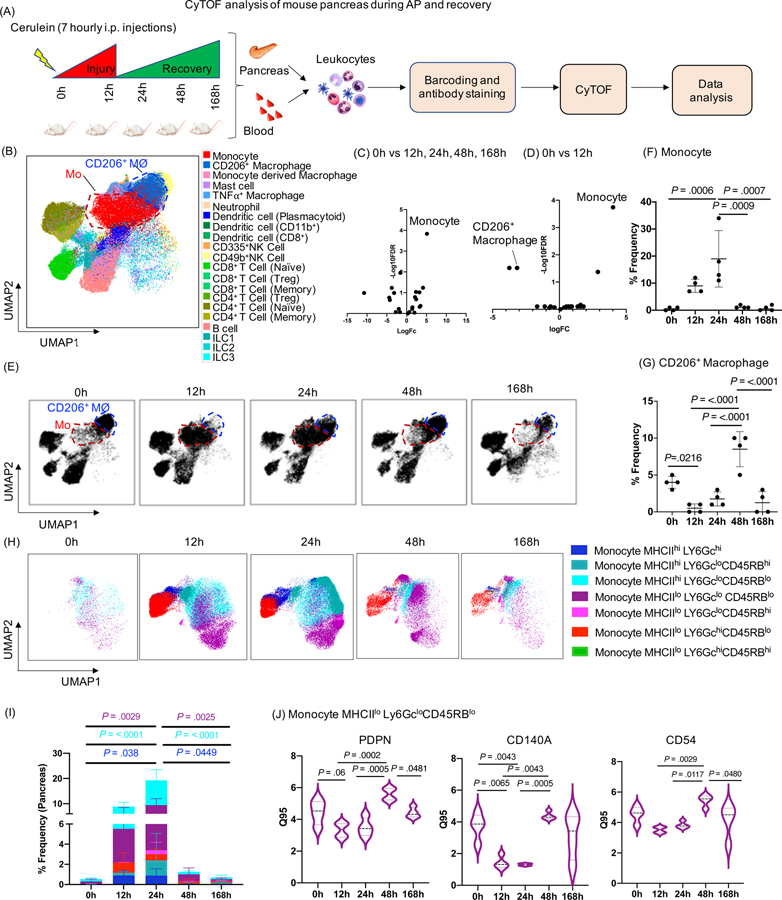
Figure 1: CyTOF analysis of mouse pancreas during AP and recovery.
(A) Experimental set up for induction of AP and recovery and CyTOF analysis of pancreas and blood. (B) UMAP plot showing various immune cell clusters in the pancreas. (C, D) Volcano plot showing differential abundance analysis of immune cells at all time points (12h, 24h, 48h, 168h) compared to control (0h) and pair wise comparison between 0h vs 12h (AP) respectively. Monocytes were labeled as the top altered immune cell followed by CD206+ macrophages. (E) UMAP plot showing clusters of monocytes (red circle) and CD206+ macrophages (blue circle) along with the kinetics of AP and recovery phase. (F, G) Frequency of monocytes and CD206+ macrophages in the pancreas. (H, I) UMAP plots showing seven novel monocyte subsets and their frequency. (J) DE analysis of monocyte MHCIIloLy6GcloCD45RBlo revealed PDPN, CD140a and CD54 were significantly altered during the AP and recovery. Mo- Monocytes; CD206+MØ - CD206+ macrophages
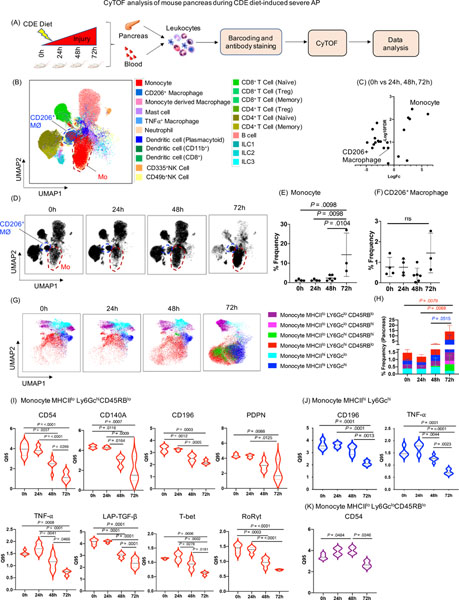
Figure 2. CyTOF analysis of mouse pancreas during CDE diet-induced SAP.
(A) Experimental set up for induction of SAP and CyTOF analysis of pancreas and blood. (B) UMAP plot showing various immune cell clusters in the pancreas. (C) Volcano plot showing differential abundance analysis of immune cells at all the time point comparisons (24h, 48h, 72h) with control mice (0h). Monocytes appeared as the top altered immune cell. (D) UMAP plot showing monocytes cluster (red circle) and CD206+ macrophages cluster (blue circle) along with the kinetics of SAP development. (E, F) Dot plot showing frequency of monocytes and CD206+ macrophages in the pancreas. (G, H) UMAP plots showing six novel monocyte subsets and their frequency. (I) DE analysis of monocyte MHCIIloLy6GchiCD45RBlo revealed reduced expression of CD54, CD140a, CD196, PDPN, TNF-α, LAP-TGF-β, T-bet, RoRγt; whereas, (J) monocyte MHCIIhi Ly6Gchi showed reduced expression of CD196, and TNF-α during SAP. (K) DE analysis of monocyte subset MHCIIlo Ly6GcloCD45RBlo revealed induced expression of CD54 at 48h and then reduced at 72h during SAP. Mo- monocytes; CD206+ MØ- CD206+ macrophages
Materials and Methods
Mice:
Female Balb/c mice were purchased from the Jackson Laboratory (Sacramento, CA). All animal experiments were approved by Stanford University institutional animal care and use committees.
Experimental models of pancreatitis
AP and recovery phase models:
Female mice (6 weeks old) were fasted overnight, and AP induced as described earlier11 by administering seven hourly intra-peritoneal injection of cerulein (50μg/kg) (SigmaAldrich, St. Louis, MO) starting at time 0h and pancreas, and blood were collected at 12h, 24h, 48h and 168h (day 7). Control mice received saline injections (Figure 1A). Four mice were included in each group.
Severe AP model:
Young female mice (4 weeks old) were fasted, then fed CDE diet or normal chow (control) and sacrificed at 0h, 24h, 48h and 72h (Figure 2A). Three to six mice were included in each group. CDE-diet (MP Biomedicals, LLC, OH) induced SAP model is selective to young female mice12. Because of this selectivity and the need to compare between severe (CDE) and mild/moderate (cerulein) AP, female mice were used in all experiments.
Human peripheral blood mononuclear cells (hPBMCs) isolation:
We utilized archived hPBMC samples collected and stored at −80°C between 2014 and 2016 from pancreatitis patients seen at Stanford Hospital with approved IRB. Patient details are provided in Supplementary Table 1. hPBMCs were thawed in RPMI (SigmaAldrich, St. Louis, MO); penicillin/streptomycin (SigmaAldrich, St. Louis, MO); and benzonase (SigmaAldrich, St. Louis, MO) containing 10% FBS and 1% penicillin/streptomycin with benzonase (25 U/ml) followed by washing with benzonase-free media and rested overnight at 37°C in CO2 incubator prior to CyTOF staining.
CyTOF cell preparation and labeling
Cell isolation:
Mouse pancreas and blood leukocytes were isolated as previous8, 13, 14. Leukocytes were incubated with Ionomycin (SigmaAldrich, St. Louis, MO); Brefeldin (Biolegend CA); phorbol myristate acetate (PMA) (SigmaAldrich, St. Louis, MO); HBSS (ThermoFisher Scientific, MA); PFA (Electron Microscopy Science, PA) (1μg/ml), Brefeldin (1μg/ml), phorbol myristate acetate (PMA) (50ng/ml) in HBSS (2%BCS) for 4h at 37°C for cytokine intracellular staining. Live/dead staining was done by using Cell-ID™ Cisplatin-198Pt (Fluidigm) and cells were fixed with 1.6% paraformaldehyde (PFA) followed by storage at −80°C until sample barcoding.
Palladium (Pd) isotope barcoding and antibody staining:
The Cell-ID™ 20-Plex Pd Barcoding Kit (Fluidigm) was used to barcode the samples from mice pancreas, blood and hPBMCs15. After sample barcoding, a cocktail of cell-surface antibodies (1:100 dilution) was added to the samples for 30 min at 4°C. Samples were washed and fixed in 100μl of 2% PFA at 4°C overnight followed by intracellular staining using a cocktail of intracellular antibodies prepared (1:100) in perm buffer (eBioscience) and incubated with samples for 45 minutes on ice. After antibody staining (Supplementary Table 2 and 3), cells were washed and incubated with Cell-ID™ Intercalator-Ir-125 (Fludigm) diluted (1:1000) in 2% PFA and incubated overnight at 4°C.
CyTOF:
Stained and intercalated cells were washed and resuspended in MilliQ water (0.5 ml), followed by adding 10% calibration beads mixture (Ce140/142, Eu 151/153, Ho 165, Lu 175/176) (Fluidigm, CA) and cell numbers were adjusted to 0.5 million cells/ml. The stained cells were analyzed on a CyTOF-2 outfitted with a Super Sampler sample introduction system at an event rate of 200–300 cells/sec at Stanford FACS core facility. Several FCS files were recorded followed by concatenation and normalization using CyTOF software v6.7.1014.
Data analysis:
FCS files were uploaded to the Astrolabe Cytometry Platform (Astrolabe Diagnostics, Inc.) for downstream analysis as previous14. Data was transformed using arcsinh with a cofactor of 5 and the marker intensities presented are all after transformation. Uniform Manifold Approximation and Projection (UMAP) is a non-linear dimensionality reduction method16 and was implemented on FlowJo 10.5.3 using the UMAP plugin. Assigned cell subsets were first manually gated, and Boolean logic was used to remove any cells that were not assigned to specific subsets. For analysis of monocytes or CD206+ macrophages the respective cell types were gated and exported prior to analysis. All gating was based on cell subset assignment values within the .fcs files obtained from Astrolabe. After gating, UMAP was run separately for each combination of disease model and tissue type. Default parameters were used, except for clustering channels, which were selected manually for each UMAP calculation.
Flow cytometry:
Flow cytometry was performed on pancreas and blood cells, isolated in a similar way as above and previous publications8, 17. All antibodies used for flow cytometry were purchased from Biolegend (Supplementary Table 4). Flow cytometry was performed on Fortessa LSRII and analyzed using FlowJo software.
Statistics:
Single-cell data clustering, cell subset definition, labeling, differential abundance, and differential expression analysis was performed as reported14. Unpaired Students t-test was used for pairwise comparison between two groups. One-way analysis of variance plus Tukey post hoc test were used to determine the difference among multiple groups, and p value less than 0.05 was considered statistically significant. GraphPad Prism 7 was used for some figures and targeted statistical tests.
Results
Immune profiling of pancreas identified highly altered monocyte clusters and dynamic changes in CD206+ macrophages during AP and recovery
Immune profiling of pancreatic leukocytes identified variety of immune cells as represented in UMAP plot 16 (Figure 1B). Unassigned cells were excluded from the analysis and the labeling strategy for each immune subset is shown in Supplementary Table 5. A variety of immune cell types were significantly altered at different time points in the pancreas (Supplementary Table 6). Volcano plot showing differential abundance analysis of all immune cells revealed that monocytes (Ly6C+, inflammatory) were the top altered immune cells compared across all time points (0h, 12h, 24h, 48h, 168h) and between 0h (control) and 12h (AP) (Figure 1C, 1D). We also observed significantly decreased CD206+ macrophages in a pairwise comparison between 0h and 12h (Figure 1D). UMAP revealed dynamic changes in monocyte and CD206+ macrophage clusters (Figure 1B, 1E). The frequency of monocytes peaked at 24h and normalized to baseline at 48h/168h (recovery phases) (Figure 1E, 1F). The frequency of CD206+ macrophages was significantly reduced at 12h (AP) and recovered at 48h (Figure 1E, 1G). These findings indicate that disease induction and recovery is associated with dynamic shifts in pancreatic monocytes and CD206+ macrophages.
Seven novel monocyte subsets were identified with altered expression of CD140a, MHCII, CD54, and podoplanin (PDPN) in the pancreas during AP and recovery
Differential expression (DE) analysis of pancreatic monocytes identified four distinct phenotypic surface markers, i.e. CD140a, MHCII, CD54, and PDPN which were reduced during AP (12h) and returned to baseline at recovery (48h to 168h) in the pancreas (Supplementary Figure 1A 1B). Previous reports from trauma patients indicate a similar reduction in HLA-DR expression on monocytes during initial injury, with potential link to clinical outcome18, 19. Unbiased profiling of pancreatic monocytes identified seven different subsets of monocytes based on differential expression of MHCII, Ly6Gc and CD45RB (Figure 1H, 1I). Some monocyte subsets expressed Ly6Gc, a neutrophil marker previously reported on murine monocytes 20. To get a deeper look at these seven monocyte subsets, we performed DE analysis and identified PDPN, CD140a and CD54 expressing MHCIIloLy6GcloCD45RBlo monocyte signatures that were reduced significantly at 12h and 24h and recovered by 48h to 168h (Figure 1 J). These novel pancreatic monocyte signatures may serve as a primer for future studies to develop immune markers of AP pathogenesis and rapid recovery.
Immune profiling of pancreas identified monocytes as top altered immune cells during SAP
Next, we analyzed the immune responses over time during SAP (Figure 2A) and CyTOF analysis identified several altered pancreatic immune cells types (Figure 2B, Supplementary Table 7). Similarly, differential abundance analysis revealed monocytes as highly altered immune cells in the pancreas during SAP (Figure 2C). Peak induction of inflammatory monocytes was observed in the pancreas of mice fed with CDE diet for 72h (Figure 2D, 2E). We noted increased frequency of CD206+ macrophages at 72h, though it did not reach significance (Figure 2C, 2D, 2F). These findings indicate that the monocytes and their tissue influx likely play an important role in the pathogenesis of both mild and SAP.
SAP is associated with novel monocyte subsets with altered expression of several phenotypic and functional markers
DE analysis of pancreatic monocytes in SAP demonstrated reduced expression of CD54, MHCII, PDPN, CD140a, CD196, transcription factors (T-bet, GATA-3 and RoRγt) and secreted less TNF-α, LAP-TGF-β and IL-10 (Supplementary Figure 2A, 2B). Unbiased profiling of the pancreatic monocytes also identified six monocyte subsets with variable MHCII, Ly6Gc, and CD45RB expressions (Figure 2G, 2H). In contrast to mild AP and recovery, DE analysis during SAP identified significantly reduced expression of surface and intracellular markers (CD54, CD140a, CD196, PDPN, TNF-α, LAP-TGF-β, T-bet, and RoRγt) on monocyte MHCIIlo Ly6Gchi CD45RBlo at 72h as compared to 0h (Figure 2I). Moreover, monocyte MHCIIhiLy6Gchi showed reduced expression of CD196 and TNF-α at 72h (Figure 2J). CD54 was increased at 48h compared to 0h and then decreased significantly at 72h on monocyte MHCIIlo Ly6Gclo CD45RBlo (Figure 2K). CD196 (CCR6), is a trafficking receptor implicated in promoting inflammation in mice 21. Thus, CD196 expression herein might suggest its involvement in monocytes recruitment in SAP. Our data also suggests that pancreatic monocytes in SAP are more heterogeneous in nature with distinct transcriptional regulation profiles and functional marker expression and associated with sustained local inflammatory responses, thereby contributing to disease progression from mild to SAP.
Seven novel subsets of CD206+ macrophage with distinct marker expression profile were identified in the pancreas during AP, recovery, and SAP
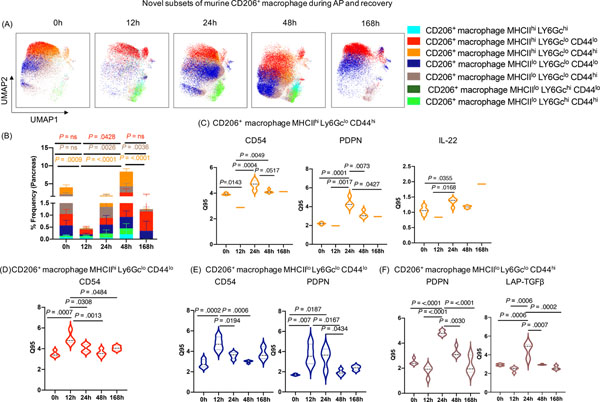
The dynamic shifts in CD206+ macrophages (Figure 1E, 1G) in the pancreas during AP and recovery prompted us to unravel their heterogeneity. DE analysis of CD206+ macrophages showed significant alterations in the expression of MHCII, CD54, CD44, PDPN, and LAP-TGF-β (Supplementary Figure 3A, 3B) during AP and recovery phase. Moreover, unbiased profiling identified seven different CD206+ macrophage subsets based on differential expression of MHCII, Ly6Gc, and CD44 (Figure 3A, 3B). MHCII is a known activation marker for macrophages 22; whereas CD44 is an adhesion molecule expressed on alveolar macrophages23. Similar to the monocyte subsets, we observed three different CD206+ macrophage subsets expressing high Ly6Gc in AP and recovery. DE analysis on the identified CD206+ macrophage clusters revealed interesting trends in expression of CD54, PDPN and IL22. MHCIIhi Ly6GcloCD44hi macrophages displayed a significant decrease in expression of CD54 and IL22 at 12h that recovered at 24–48h (Figure 3C), and striking increase in PDPN levels at 24–48h. MHCIIhiLy6GcloCD44lo and MHCIIloLy6GcloCD44lo subsets, on the other hand, showed increased CD54 and PDPN expression at 12h, which was reduced by 168h (Figure 3D, 3E). The MHCIIloLy6GcloCD44hi cluster had increased expression of PDPN similar to MHCIIhiLy6GcloCD44hi but also showed high LAP-TGF-β levels at 24h that returned to baseline at 168h (Figure 3F). To get further insights into potential functions of CD206+ macrophage subpopulations, we interrogated cytokine expression patterns on these subsets by conducting DE analysis. Our analysis revealed that most of the CD206+ macrophage subsets upregulated expression of IFN-γ, IL-4, IL-17A, IL-22, IL-10, LAP-TGF−β and Foxp3 during peak injury (12h/24h) that returned to either base line or was not detected upon recovery (48h/168h) (Supplementary Figure 3C). Unlike the other CD206+ macrophage subsets, MHCIIloLy6GchiCD44lo subset was unique in that cytokine induction only occurred during peak injury (12h/24h) (Supplementary Figure 3Cv) and based on the anti-inflammatory profile (IL-10 and TGF-β) suggests its reparatory role. Expression of IFN-γ, IL-17A and IL-10 was seen on most of the CD206+ macrophage subsets; whereas selective expression of IL-4 and especially IL-22 was noted among specific subsets (Supplementary Figure 3C). We previously showed a protective role for IL-22 in promoting acinar cell regeneration in AP17. Notably, IL-22 expression was markedly increased during recovery (168h) by the MHCIIhiLy6GcloCD44hi subset (Supplementary Figure 3Cii) suggesting an important and pro-regeneratory role for this subset. TGF-β, a pleiotropic cytokine, involved in wound healing and regulation of anti-inflammatory responses24, its upregulation was restricted to 24h regardless of the macrophage subsets indicating unique kinetic and timing associated with its role during AP (Supplementary Figure 3C). The differential phenotypic and functional marker expression patterns on distinct CD206+ macrophage clusters during disease course likely reflects functional diversification of these macrophages in response to microenvironmental cues and crosstalk between the cell populations to fulfill a tissue level need for specialized functions during disease evolution and recovery.
Figure 3: Novel subsets of pancreas CD206+ macrophages during AP and recovery.
(A, B) UMAP plot showing seven novel subsets of CD206+ macrophage and their frequency during AP and recovery. (C) DE analysis of CD206+ macrophage subset MHCIIhiLy6GcloCD44hi revealed increased expression of CD54, PDPN, and IL-22 at 24h; whereas (D) subset MHCIIhiLy6GcloCD44lo with increased expression of CD54 during AP (12h) which return to baseline during recovery (168h). (E) DE analysis of CD206+ macrophage subset MHCIIlo Ly6Gclo CD44lo display induced expression of CD54 and PDPN (12–24h); whereas (F) subset MHCIIloLy6GcloCD44hi revealed increased expression of PDPN and LAP-TGF-β at 24h which returned to base line during recovery phase (168h).
In parallel, we analyzed CD206+ macrophages in the pancreas during SAP (Figure 2C, 2D, 2F). DE analysis of CD206+ macrophages in the pancreas during SAP revealed significant increased expression of PDPN, LAP-TGF-β, CD196, and CD54 but decreased expression of MHCII on the CD206+macrophages (Supplementary Figure 4A, 4B). Further unbiased deep profiling of the CD206+ macrophages identified seven distinct subsets based on differential expression of MHCII, CD54 and TGF-β1 during SAP (Supplementary Figure 4C, 4D). Notably, these subsets are different compared to those identified in the pancreas of AP and recovery models (Figure 3A) and allude to remarkable heterogeneity/ diversification of CD206+ macrophage populations with disease progression from mild to SAP. Unlike in the mild-moderate AP, no significant alteration (FDR adjusted) in surface and functional markers was identified after DE analysis of these seven CD206+ macrophage subsets. However, a targeted DE analysis of cytokines in the CD206+ macrophages during SAP revealed similar and distinct patterns compared to AP-recovery and potentially reflects need for specialized functions depending on tissue state. We observed expression of IFN-γ, IL-4, IL-17A, IL-22, IL-10, and Foxp3 on LAP-TGF-βhi expressing CD206+ macrophage subsets (Supplementary Figure 4Eii, iv) compared to the subsets with LAP-TGF-βlo subsets (Supplementary Figure 4Eiii, v, vii) during SAP. TGF-β also regulates Foxp3 expression to induce Tregs25, thus elevated expression of Foxp3 on LAP-TGF-βhi expressing CD206+ macrophage subsets (Supplementary Figure 4E ii, iv) might suggest its regulation by TGF-β. In general, the CD206+ macrophage subsets in SAP had lower induction of similar cytokines assayed relative to the subsets in recovery and milder AP (Supplementary Figure 3C). In SAP, the MHCIIloCD54hi subset had the most abundant expression of the cytokines (Supplementary Figure 4Ei). IL-4 and IL-22 also in SAP had unique expression that peaked at 72h (Supplementary Figure 4E i, ii, iv, v). IL-4 induces polarization of macrophages with reparatory function8, 26 and together with regeneratory function of IL-22 as mentioned above, these four CD206+ macrophage subsets (Supplementary Figure 4E i, ii, iv, v) might have critical regulatory role in severe disease. However, these pilot findings will need to be followed with more detailed functional studies to confirm their role during AP progression and recovery.
Novel monocyte subsets are also present in circulation during AP, recovery and SAP
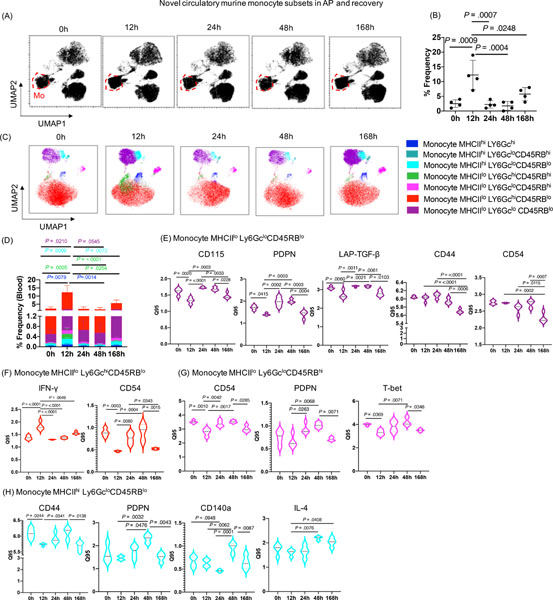
Since we identified distinct monocyte signatures in the pancreas, and access to human pancreas is a major limitation in the field, we extended our analysis to circulating monocytes in our experimental models. Notably, we observed peak induction of monocyte frequency at 12h, which returned to baseline by 168h in AP and recovery model (Figure 4A, 4B). DE analysis of monocytes identified increased expression of CD196, PDPN, and IFN-γ at 12h, as well as decreased expression of CD115 and CD54 at 12h. However, expression of CD115, TGF-β, TNF-α, and IL-4 was increased at 24h compared to 12h and returned to baseline by 168h (Supplementary Figure 5). Similar to the pancreas, unbiased profiling of blood monocytes identified their seven subsets during AP and recovery (Figure 4C). The frequency of monocyte subsets peaked at 12h in the blood (Figure 4D), whereas monocytes peaked at 24h in the pancreas (Figure 1I) and returned to baseline during recovery phase (by 168h). This shift in monocyte clusters suggests that during the onset of AP, a rapid increase in monocytes occurs in the blood by 12h, and likely migrate from the circulation to the inflamed pancreas by 24h, ultimately returning to baseline and equilibrating during recovery (by 168h) in both blood and pancreas. DE analysis of these seven novel blood monocyte subsets revealed altered CD115, PDPN, LAP-TGF-β, CD44, and CD54 expression on the monocyte MHCIIlo Ly6Gclo CD45RBlo subsets (Figure 4E); IFN-γ and CD54 expression on monocyte MHCIIlo Ly6Gchi CD45RBlo subsets (Figure 4F); CD54, PDPN, and T-bet expression on monocyte MHCIIlo Ly6Gclo CD45RBhi subsets (Figure 4G); and CD44, PDPN, CD140a, and IL-4 expression on monocyte MHCIIhi Ly6Gclo CD45RBlo subsets (Figure 4H) during AP and recovery phase.
Figure 4: Novel circulating monocyte subsets during AP and recovery.
(A) UMAP analysis demonstrating the changes in the cluster of circulatory monocytes cluster (red circle) during AP and recovery. (B) Peak induction in circulatory monocyte was observed at 12h which recover to base line at 168h. (C, D) Seven distinct subsets of monocytes identified by unbiassed profiling and their frequencies. (E) DE analysis of monocyte subset MHCIIlo Ly6GcloCD45RBlo with altered expression of CD115, PDPN, LAP-TGF-β, CD44, and CD54; whereas (F) monocyte subset MHCIIlo Ly6GchiCD45RBlo demonstrated altered expression of IFN-γ and CD54 during AP and recovery. (G) DE analysis of monocyte subset MHCIIlo Ly6GcloCD45RBhi showed significantly altered expression of CD54, PDPN, and T-bet; whereas (H) monocyte subset MHCIIhi Ly6GcloCD45RBlo revealed significant alterations in expression of CD44, PDPN, CD140a, and IL-4 during AP and recovery.
In parallel, we observed increased frequency of circulating monocytes during SAP at 72h compared to 0h (Supplementary Figure 6A, 6B). DE analysis of these monocyte clusters revealed decreased expression of MHCII and increased expression of CD54, LAP-TGF-β, and IL-4 at 72h compared 0h (Supplementary Figure 6C, 6D). However, increased expression of CD115 and CD196 on monocyte were noted only at 24h time point indicates its early induction during disease onset (Supplementary Figure 6C, 6D). Unbiased profiling identified six monocyte subsets (Supplementary Figure 6E) which were increased at 72h during SAP (Supplementary Figure 6F). However, DE analysis of circulatory monocyte subsets did not identify any significantly (FDR adjusted) altered markers in the blood of the SAP mice. Overall, these novel monocyte subsets with distinct signatures during AP progression and recovery highlight monocytes as key dynamic immune subsets in pancreas and circulation. Thus, the disease can be studied and monitored with less invasiveness via repeated blood sampling.
Flow cytometry validates novel monocyte subsets identified by CyTOF analysis in the pancreas and blood
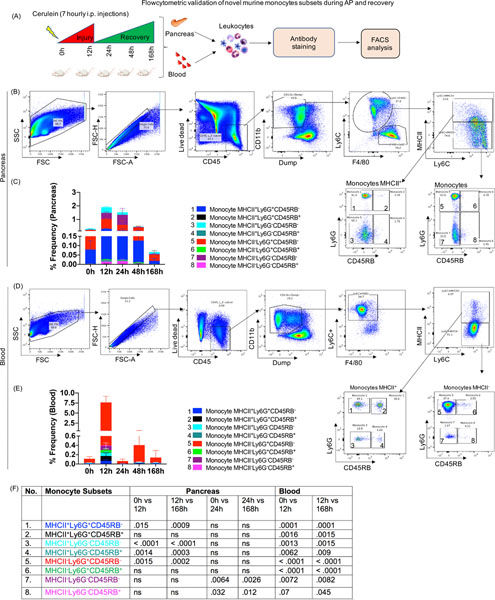
To test the validity of the monocyte subsets identified by CyTOF, we ran independent experiment of AP and recovery (Figure 5A). FACS plot show the gating scheme for identification of the novel monocyte subsets in the pancreas (Figure 5B) and blood (Figure 5D) and designated as monocyte 1–8. The color coding of each monocyte subset on the bar plots were matched with those identified by CyTOF analysis as shown in Figure 5B, 5D. Monocyte subset 2 was an additional subset of monocytes identified in the pancreas (Figure 5C) and blood (Figure 5E) but found significantly altered only in blood by FACS analysis. Similar to CyTOF analysis, the pancreatic monocyte subsets 1, 3, 4, 5, were induced at 12h and subset 7 was induced at 24h (Figure 5C, 5F). All these pancreatic monocyte subsets returned to base line at 168h (i.e recovery) (Figure 5C, 5F). Moreover, all the circulatory monocyte subsets (1, 3–8) peaked at 12h, as observed in CyTOF analysis and returned to base line at 168h (Figure 5D–5F). Thus, the flow-based study, validated and confirmed the CyTOF identified novel monocyte subsets in the pancreas and blood during AP and recovery phase.
Figure 5: Flow cytometric validation of novel monocyte subsets during AP and recovery.
(A) Experimental setup for AP and recovery phase and flowcytometric analysis of pancreas and blood (B) FACS plot showing gating scheme for identification eight different monocyte subsets in the pancreas (numbered as monocyte 1–8). (C) Stacked plot showing frequency of monocyte subsets in the pancreas and (D) Eight subsets of monocytes were identified in circulation during AP and recovery. (E) Stacked plot showing frequency of circulatory monocyte subsets. (F) P values for monocyte subsets during AP and recovery ns=non significant.
CyTOF analysis identified six novel subsets among the abundant inflammatory monocytes (CD14+CD16−) in pancreatitis patients
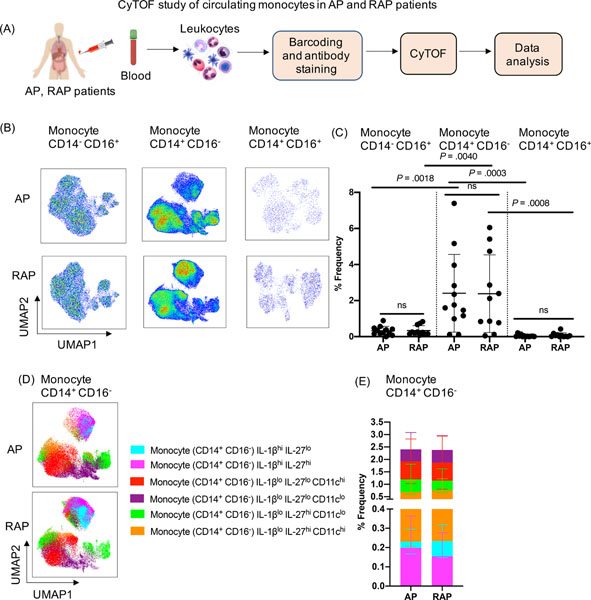
We identified novel subsets of circulatory inflammatory monocytes (Ly6C+) during mild AP and SAP using experimental models. Therefore, we sought to investigate circulating inflammatory monocyte (CD14+CD16−) in patients with pancreatitis. Since it is hard to determine the onset and induction of AP in patients, who present with variable time course and disease severity, we assayed archived PBMCs from those with AP (n=12 with first AP presentation) and RAP (n= 11 with >1 past history of AP) diagnoses. The PBMCs were isolated from blood drawn between 1–5 days of hospital presentation and CyTOF analysis of monocytes was conducted (Figure 6A). Similar to the experimental findings, UMAP plot analysis and % frequency from AP and RAP patients’ blood revealed CD14+CD16− monocytes as highly abundant compared to the other two circulating monocyte subsets (nonclassical CD14−CD16+ and intermediate CD14+CD16+) (Figure 6B, 6C). Focused unbiased in-depth analysis of the predominant CD14+CD16− inflammatory monocytes identified six novel subsets based on differential expression of IL-1β, IL-27, and CD11c (Figure 6D, 6E). Furthermore, we stratified our AP patient cohort based on disease etiology (gallstone AP n=6 versus non-gallstone AP group; medication n=1, post ERCP n=1, CF related n=1, idiopathic n=3) and analyzed the monocyte subsets between the two groups. We found patients with gallstone had increased frequency of CD14+CD16− and CD14+CD16+ monocytes compared to the non-gallstone AP (Supplementary Figure 7A, 7B). Among the six novel CD16+CD14− monocyte subsets; three were significantly increased in the gallstone AP compared to the non-gallstone AP group (Supplementary Figure 7C, 7D). The findings in human AP are similar to observations in our mouse models in that inflammatory monocytes were the most significantly altered cells during pancreatitis. It highlights monocytes as important and heterogenous subsets in mouse and human pancreatitis that can be monitored in blood. Future studies focused on circulating monocytes with frequent blood sampling from AP patients to evaluate temporal immune compartment changes during disease progression and recovery will be transformative in our understanding of AP pathogenesis.
Figure 6: CyTOF analysis of circulating monocytes in pancreatitis patients.
(A) Experimental setup for CyTOF analysis in the blood collected from AP (n=12) and RAP (n=11) patients (B) UMAP analysis of human PBMC indicates a significant increase in classical inflammatory monocytes (CD14+ CD16−) compared to nonclassical (CD14− CD16+) and intermediate (CD14+CD16+) monocytes in both AP and RAP patients. (C) Frequency (%) of each monocyte subset from AP and RAP is shown. (D, E) Unbiased profiling identified six subclusters of classical monocytes CD14+CD16− in circulation of AP and RAP patients and their % frequency.
Discussion
In this study, we report previously uncharacterized phenotypic and functional heterogeneity within inflammatory monocytes (Ly6C+) in the blood and pancreas of AP, recovery and SAP models as well as CD206+ macrophages in the pancreas during AP and recovery (Figure 7). Similar to findings in experimental models, inflammatory monocytes (CD14+CD16−) were the dominant ‘circulating’ monocyte population in AP and RAP patients. To the best of our knowledge, this is the first in-depth ‘proteomic immune profiling’ at a single cell level using CyTOF to catalog diverse systemic/pancreatic monocyte and macrophage subsets during pancreatitis and recovery. Our study has several strengths: (1) extensive different timed sampling reflecting various disease states (AP, recovery, and SAP) using two independent AP models, (2) simultaneous analysis of blood and tissue immune responses during acute injury and recovery offers unparalleled insights into local and peripheral dynamics that can be translated to human disease where tissue access is prohibitive and (3) evaluation of circulating monocytes in blood of AP and RAP patients demonstrate evidence of novel monocyte populations and heterogeneity similar to experimental models. We posit a link between incidence of the identified, unique subsets and disease activity (injury versus repair) that could reflect a ‘local’ need for specialized functions attributed to monocytes and macrophages in this disease model such as clearance of apoptotic/necrotic cells (efferocytosis), immune cell recruitment/reprogramming, reducing inflammation, prevention of fibrosis and tissue regeneration.
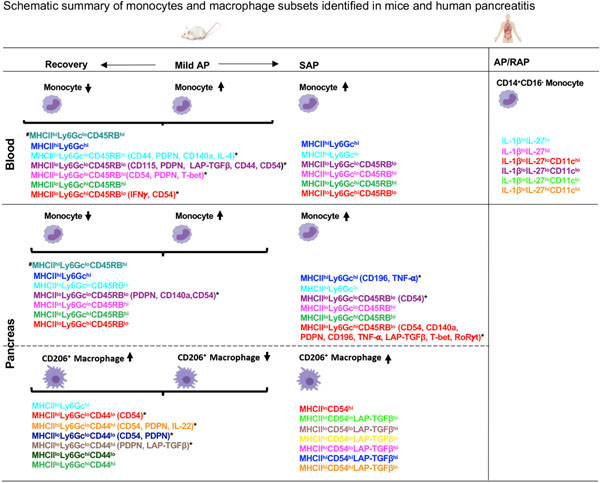
Figure 7: Summary of novel monocyte and macrophage subsets in experimental and human pancreatitis.
*Monocyte and CD206+ macrophage subsets with differentially expressed phenotypic and functional markers after FDR correction. #Monocyte subset identified in blood and pancreas in mild AP and recovery but not in SAP. AP-Acute Pancreatitis; SAP- Severe AP; RAP- Recurrent AP.
Our unbiased profiling of murine monocytes during AP and recovery revealed seven novel subsets with previously unidentified, significant changes in the expression of PDPN, CD140a, and CD54 on MHCIIloLy6GcloCD45RBlo monocytes in the pancreas. In-depth analysis of circulating monocytes from AP and recovery phase revealed four subsets with unique surface (CD115, PDPN, CD44, CD54, CD140a) and functional (eg. IFN-γ, IL-4, T-bet, LAP-TGF-β) marker profiles. Moreover, the monocytes in SAP were similar to the monocyte subsets identified during mild-moderate AP and recovery, as evidenced by MHCII, Ly6Gc, CD45RB expression patterns. Among these, three monocyte subsets (MHCIIloLy6GchiCD45RBlo, MHCIIhiLy6Gchi, MHCIIloLy6GcloCD45RBlo) in the pancreas had significantly altered expression of a variety of markers during SAP. The MHCIIloLy6GchiCD45RBlo monocyte subset was most heterogenous due to expression of various surface (CD54, CD140a, CD196, PDPN) and functional (TNF-α, LAP-TGF-β, T-bet, RoRγt) markers. The differential profiles of pancreatic monocyte subsets during SAP compared to AP and recovery could represent dynamic response to local cues (enzymes from injured acini, cytokines) or phagocytosed cargo (apoptotic/necrotic cells) which can trigger gene expression changes/functional reprogramming in the context of ongoing inflammation and warrants further investigation. Importantly, we can envision leveraging the observed changes in proteomic signatures on circulating monocytes (such as that identified in this study) to predict ‘local’ disease state in the pancreas. For instance, we could nominate the circulating monocyte cluster, MHCIIloLy6GcloCD45RBlo, as an indicator of ‘active’ tissue inflammation state versus reparative state as it shows a significant increase over baseline at 12h in the blood, at 24h in the pancreas (i.e. acute inflammation) and returns to baseline at 168h (i.e. reparative state). Furthermore, the monocytes identified in the experimental models can be used as a foundation to guide identification of allied, monocyte subsets present in blood during human disease progression that will help predict/inform local disease activity. Aligned in this direction, our initial exploration of inflammatory monocytes (CD14+CD16−) in AP and RAP patients’ blood revealed six novel subsets. Thus, heterogenous and distinct populations of circulating inflammatory monocytes were evident in human pancreatitis as in murine AP. This is consistent with observations of heterogeneity among circulating human monocytes in inflammatory diseases including coronary heart disease 27 and sepsis 28.
We previously reported important role for CD206+ macrophages (M2) during CP8, but in-depth profiling of CD206+ macrophages during AP pathogenesis is lacking. Our CyTOF analysis revealed seven subsets of pancreatic CD206+ macrophages based on MHCII, Ly6Gc, and CD44 expression in AP and recovery, similar to the heterogeneity observed among circulating monocytes. The shared expression pattern of surface markers, MHCII and Ly6Gc, on the novel macrophage and monocyte subsets identified in AP and recovery suggests the likelihood of a common origin. This premise is further supported by the fact that four of the seven CD206+ macrophage subsets showed significant differential expression of surface and functional markers such as CD54, PDPN and LAP-TGF-β, which were also expressed on the novel monocyte subsets. In addition, pancreatic CD206+ macrophages during SAP had significant alteration in MHCII, CD54, PDPN, CD196, and LAP-TGF-β. Interestingly, PDPN and LAP-TGF-β expression on pancreatic CD206+ macrophages increased during injury not only in mild-moderate AP but also in SAP. Previous reports indicate expression of PDPN and TGF-β in murine inflammatory macrophages29 and human macrophages30; and PDPN expression can be induced by inflammatory cytokines (IFN-γ , TGF-β , TNF-α) 31. Given that our results show mutually exclusive as well as concomitant increases in expression of PDPN and LAP-TGF-β on distinct CD206+ subsets, it is tempting to speculate that TGF-β may modulate PDPN expression during disease course and recovery. In summary, CD206+ macrophage subsets by secreting numerous cytokines are likely involved in tissue remodeling/regeneration after injury. Additional studies are needed to unveil their exact functional roles in the context of tissue-level changes during AP and recovery.
Our study has some limitations, including lack of repeated sampling to assess temporal progression of human AP and use of previously collected PBMCs. Second, CyTOF antibodies in mouse and human AP were not the same, as our panel design was informed by published reports on differences between mouse and human immune cells under homeostatic conditions and AP. Third, we identified an additional, significantly altered circulating monocyte subset 2 with flow cytometric validation. This subset was not identified in unbiased analysis likely due to it being statistically under powered, as our CyTOF panel included 36 markers require multiple testing and FDR correction compared to 12 flow cytometry markers.
The unprecedented diversity of monocytes and macrophages observed in our study during the inflammatory and recovery phases is consistent with emerging paradigms on monocyte/macrophage heterogeneity and plasticity in various organs including liver under homeostasis32 and other inflammatory conditions33, 34. Deeper analysis of surface and functional markers used in our study offer a glimpse into the potential functional repertoire of the unique monocyte and macrophage populations during the disease continuum and reparative phases following pancreatic injury. For e.g. monocyte subsets with high MHCII expression (e.g. MHCIIhiLy6GcloCD45RBhi) can be considered as ‘activated’ monocytes that may further differentiate into macrophages and dendritic cells to prime adaptive immune responses important for inflammation resolution and tissue repair. Similarly, MHCIIhiCD206+ macrophages are likely to be more efficient in phagocytosis and antigen presentation compared to MHCIIloCD206+ macrophages during AP and recovery. Furthermore, the expression of distinct surface (CD44, CD54, CD115, PDPN, CD140a) and effector (IFN-γ, T-bet, IL-4, IL-22, LAP-TGF-β) proteins on some of the monocyte subsets in blood, pancreas and CD206+ macrophages identified allude to their potential role in inflammatory and anti-inflammatory responses during AP and recovery respectively. While the exact function of these distinct subsets in pancreatic injury and recovery cannot be confirmed from our current studies and warrants further investigation, observations in other inflammation models offer some clues. For instance, CD54 expression on inflammatory macrophages in colitis facilitated efferocytosis of apoptotic cells and promoted wound healing35, while enhanced CD54 expression was a characteristic feature of human monocytes that migrate through endothelial monolayer pre-treated with IL1β and TNFα36. Analogous to these observations, the upregulation of CD54 on MHCIIloLy6Gclo CD45RBlo monocytes (48h) likely promotes efferocytosis/phagocytosis to clear debris during the inflammation resolution/recovery phase while its expression on MHCIIhiLy6GcloCD44hiCD206+ macrophages (24h-48h) likely enhance phagocytic and antigen presenting capacity during the acute phase in our AP models. Moreover, the expression of IFN-γ, IL-4, IL-10, IL-17A, IL-22, TGF- β, and Foxp3 on CD206+ macrophages during AP, recovery and SAP is reminiscent of previous reports on IL-437, IL-1038, IFN-γ39, IL-17A39, IL-2239, and TGF-β40 secretion from macrophages with phagocytic38, anti-inflammatory41, and tissue repair function40 in different inflammatory diseases. Thus, we speculate that the expression of these proteins in the identified CD206+ macrophage subsets may contribute to phagocytic, anti-inflammatory, and wound healing function during AP.
Functional interactions of monocyte/macrophage populations with other cells as well as with spatially defined signals in the injured/recovering pancreatic tissue microenvironment can serve to educate/reprogram tissue-resident subsets, recruit immune cells, mediate tissue regeneration and remains to be determined. Future studies using integrated proteomic and transcriptomic approaches such as surface phenotyping of unique monocyte subsets identified in this study combined with RNAseq analysis (CITEseq)42 and/or spatial localization with neighborhood analysis using surface and intracellular markers (CODEX)43 are required to deconvolve the functional phenotypes and potential plasticity of these novel monocyte/macrophage subsets during pancreatitis onset, progression and recovery in experimental models and correlates in human disease to realize the clinical utility of our findings. In this context, a larger cohort of prospectively collected, well-powered PBMC samples from healthy individuals, AP, and RAP patients with different disease etiologies (gallstone, alcohol, diabetes, smoking, hereditary) will be of great value. In sum, our studies by providing an expansive view of unique systemic and pancreatic monocyte/ macrophage proteomic signatures during AP progression and recovery serve as a valuable resource for future studies, to better elucidate novel biomarkers and targeted therapies. It offers immense translational promise in (1) utilizing the temporal systemic signatures as a surrogate to predict ‘local’ disease activity/recovery and (2) tailoring therapies to target relevant monocyte/macrophage populations to mitigate inflammation, potentiate/accelerate healing and derive maximal survival benefit.
Supplementary Material
WHAT YOU NEED TO KNOW.
BACKGROUND AND CONTEXT
Acute pancreatitis (AP) is an inflammatory disease of the pancreas with significant morbidity and mortality. Despite this burden, there is no approved therapy in part due to lack of systematic and in-depth understanding of inflammatory responses during AP and severe AP (SAP).
NEW FINDINGS
Using mass cytometry, we identified unique novel subsets of circulating monocytes in human and mouse as well as monocyte and macrophage subsets in mouse pancreas during progression and recovery of pancreatitis.
LIMITATIONS
Access to human pancreas during AP is clinicaly prohibitive and contributes to lack of correlation between mouse and human studies. As a result in this first study, we use previously archived peripheral blood mononuclear cells from AP patients.
IMPACT
This study has the potential to paradigm shift the field with in-depth and systematic understanding of immune responses and identification of novel innate immune cell subsets during progression and recovery of AP, which in turn will inform future ways to non-invasively (blood) monitor and target the disease.
Acknowledgements
This work was supported in part by National Institutes of Health R01 DK092421 (to AH), Department of Defense W81XWH-17-1-0339 (to AH), National Pancreas Foundation (to MM) grants, and by HIMC core of the Stanford Diabetes Research Center (P30DK116074). We thank all the Habtezion laboratory members for their help and suggestions.
Footnotes
Declaration of Interest
The authors declare no competing interests.
Publisher's Disclaimer: This is a PDF file of an unedited manuscript that has been accepted for publication. As a service to our customers we are providing this early version of the manuscript. The manuscript will undergo copyediting, typesetting, and review of the resulting proof before it is published in its final form. Please note that during the production process errors may be discovered which could affect the content, and all legal disclaimers that apply to the journal pertain.
References:
- 1.Petrov MS, Yadav D. Global epidemiology and holistic prevention of pancreatitis. Nat Rev Gastroenterol Hepatol. 2019;16(3):175–184. [DOI] [PMC free article] [PubMed] [Google Scholar]
- 2.Zheng L, Xue J, Jaffee EM, et al. Role of immune cells and immune-based therapies in pancreatitis and pancreatic ductal adenocarcinoma. Gastroenterology. 2013;144(6):1230–1240. [DOI] [PMC free article] [PubMed] [Google Scholar]
- 3.Wolf AA, Yanez A, Barman PK, et al. The Ontogeny of Monocyte Subsets. Front Immunol. 2019;10:1642. [DOI] [PMC free article] [PubMed] [Google Scholar]
- 4.Perides G, Weiss ER, Michael ES, et al. TNF-alpha-dependent regulation of acute pancreatitis severity by Ly-6C(hi) monocytes in mice. J Biol Chem. 2011;286(15):13327–13335. [DOI] [PMC free article] [PubMed] [Google Scholar]
- 5.Zhang R, Shi J, Zhang R, et al. Expanded CD14(hi)CD16(−) Immunosuppressive Monocytes Predict Disease Severity in Patients with Acute Pancreatitis. J Immunol. 2019;202(9):2578–2584. [DOI] [PubMed] [Google Scholar]
- 6.Dabrowski A, Osada J, Dabrowska MI, et al. Monocyte subsets and natural killer cells in acute pancreatitis. Pancreatology. 2008;8(2):126–134. [DOI] [PubMed] [Google Scholar]
- 7.Wynn TA, Vannella KM. Macrophages in Tissue Repair, Regeneration, and Fibrosis. Immunity. 2016;44(3):450–462. [DOI] [PMC free article] [PubMed] [Google Scholar]
- 8.Xue J, Sharma V, Hsieh MH, et al. Alternatively activated macrophages promote pancreatic fibrosis in chronic pancreatitis. Nat Commun. 2015;6:7158. [DOI] [PMC free article] [PubMed] [Google Scholar]
- 9.Wu J, Zhang L, Shi J, et al. Macrophage phenotypic switch orchestrates the inflammation and repair/regeneration following acute pancreatitis injury. EBioMedicine. 2020;58:102920. [DOI] [PMC free article] [PubMed] [Google Scholar]
- 10.Rubin SJS, Bai L, Haileselassie Y, et al. Mass cytometry reveals systemic and local immune signatures that distinguish inflammatory bowel diseases. Nat Commun. 2019;10(1):2686. [DOI] [PMC free article] [PubMed] [Google Scholar]
- 11.Zhao Q, Wei Y, Pandol SJ, et al. STING Signaling Promotes Inflammation in Experimental Acute Pancreatitis. Gastroenterology. 2018;154(6):1822–1835 e1822. [DOI] [PMC free article] [PubMed] [Google Scholar]
- 12.Lombardi B, Estes LW, Longnecker DS. Acute hemorrhagic pancreatitis (massive necrosis) with fat necrosis induced in mice by DL-ethionine fed with a choline-deficient diet. Am J Pathol. 1975;79(3):465–480. [PMC free article] [PubMed] [Google Scholar]
- 13.Manohar M, Kandikattu HK, Kumar Verma A, et al. IL-15 regulates fibrosis and inflammation in a mouse model of chronic pancreatitis. Am J Physiol Gastrointest Liver Physiol. 2018. [DOI] [PMC free article] [PubMed] [Google Scholar]
- 14.Gottfried-Blackmore A, Rubin SJS, Bai L, et al. Effects of processing conditions on stability of immune analytes in human blood. Sci Rep. 2020;10(1):17328. [DOI] [PMC free article] [PubMed] [Google Scholar]
- 15.Zunder ER, Finck R, Behbehani GK, et al. Palladium-based mass tag cell barcoding with a doublet-filtering scheme and single-cell deconvolution algorithm. Nat Protoc. 2015;10(2):316–333. [DOI] [PMC free article] [PubMed] [Google Scholar]
- 16.Becht E, McInnes L, Healy J, et al. Dimensionality reduction for visualizing single-cell data using UMAP. Nat Biotechnol. 2018. [DOI] [PubMed] [Google Scholar]
- 17.Xue J, Nguyen DT, Habtezion A. Aryl hydrocarbon receptor regulates pancreatic IL-22 production and protects mice from acute pancreatitis. Gastroenterology. 2012;143(6):1670–1680. [DOI] [PMC free article] [PubMed] [Google Scholar]
- 18.Hershman MJ, Cheadle WG, Wellhausen SR, et al. Monocyte HLA-DR antigen expression characterizes clinical outcome in the trauma patient. Br J Surg. 1990;77(2):204–207. [DOI] [PubMed] [Google Scholar]
- 19.Haupt W, Riese J, Mehler C, et al. Monocyte function before and after surgical trauma. Dig Surg. 1998;15(2):102–104. [DOI] [PubMed] [Google Scholar]
- 20.Yanez A, Coetzee SG, Olsson A, et al. Granulocyte-Monocyte Progenitors and Monocyte- Dendritic Cell Progenitors Independently Produce Functionally Distinct Monocytes. Immunity. 2017;47(5):890–902 e894. [DOI] [PMC free article] [PubMed] [Google Scholar]
- 21.Manthey HD, Cochain C, Barnsteiner S, et al. CCR6 selectively promotes monocyte mediated inflammation and atherogenesis in mice. Thromb Haemost. 2013;110(6):1267–1277. [DOI] [PubMed] [Google Scholar]
- 22.Reith W, LeibundGut-Landmann S, Waldburger JM. Regulation of MHC class II gene expression by the class II transactivator. Nat Rev Immunol. 2005;5(10):793–806. [DOI] [PubMed] [Google Scholar]
- 23.Katoh S, Matsubara Y, Taniguchi H, et al. Characterization of CD44 expressed on alveolar macrophages in patients with diffuse panbronchiolitis. Clin Exp Immunol. 2001;126(3):545–550. [DOI] [PMC free article] [PubMed] [Google Scholar]
- 24.Mantel PY, Schmidt-Weber CB. Transforming growth factor-beta: recent advances on its role in immune tolerance. Methods Mol Biol. 2011;677:303–338. [DOI] [PubMed] [Google Scholar]
- 25.Xu L, Kitani A, Strober W. Molecular mechanisms regulating TGF-beta-induced Foxp3 expression. Mucosal Immunol. 2010;3(3):230–238. [DOI] [PMC free article] [PubMed] [Google Scholar]
- 26.Hu F, Lou N, Jiao J, et al. Macrophages in pancreatitis: Mechanisms and therapeutic potential. Biomed Pharmacother. 2020;131:110693. [DOI] [PubMed] [Google Scholar]
- 27.Hamers AAJ, Dinh HQ, Thomas GD, et al. Human Monocyte Heterogeneity as Revealed by High-Dimensional Mass Cytometry. Arterioscler Thromb Vasc Biol. 2019;39(1):25–36. [DOI] [PMC free article] [PubMed] [Google Scholar]
- 28.Wen M, Cai G, Ye J, et al. Single-cell transcriptomics reveals the alteration of peripheral blood mononuclear cells driven by sepsis. Ann Transl Med. 2020;8(4):125. [DOI] [PMC free article] [PubMed] [Google Scholar]
- 29.Kerrigan AM, Navarro-Nunez L, Pyz E, et al. Podoplanin-expressing inflammatory macrophages activate murine platelets via CLEC-2. J Thromb Haemost. 2012;10(3):484–486. [DOI] [PMC free article] [PubMed] [Google Scholar]
- 30.Assoian RK, Fleurdelys BE, Stevenson HC, et al. Expression and secretion of type beta transforming growth factor by activated human macrophages. Proc Natl Acad Sci U S A. 1987;84(17):6020–6024. [DOI] [PMC free article] [PubMed] [Google Scholar]
- 31.Kunita A, Baeriswyl V, Meda C, et al. Inflammatory Cytokines Induce Podoplanin Expression at the Tumor Invasive Front. Am J Pathol. 2018;188(5):1276–1288. [DOI] [PubMed] [Google Scholar]
- 32.David BA, Rezende RM, Antunes MM, et al. Combination of Mass Cytometry and Imaging Analysis Reveals Origin, Location, and Functional Repopulation of Liver Myeloid Cells in Mice. Gastroenterology. 2016;151(6):1176–1191. [DOI] [PubMed] [Google Scholar]
- 33.Udalova IA, Mantovani A, Feldmann M. Macrophage heterogeneity in the context of rheumatoid arthritis. Nat Rev Rheumatol. 2016;12(8):472–485. [DOI] [PubMed] [Google Scholar]
- 34.Guilliams M, Mildner A, Yona S. Developmental and Functional Heterogeneity of Monocytes. Immunity. 2018;49(4):595–613. [DOI] [PubMed] [Google Scholar]
- 35.Wiesolek HL, Bui TM, Lee JJ, et al. Intercellular Adhesion Molecule 1 Functions as an Efferocytosis Receptor in Inflammatory Macrophages. Am J Pathol. 2020;190(4):874–885. [DOI] [PMC free article] [PubMed] [Google Scholar]
- 36.Grisar J, Hahn P, Brosch S, et al. Phenotypic characteristics of human monocytes undergoing transendothelial migration. Arthritis Res. 2001;3(2):127–132. [DOI] [PMC free article] [PubMed] [Google Scholar]
- 37.Pouliot P, Turmel V, Gelinas E, et al. Interleukin-4 production by human alveolar macrophages. Clin Exp Allergy. 2005;35(6):804–810. [DOI] [PubMed] [Google Scholar]
- 38.Chung EY, Liu J, Homma Y, et al. Interleukin-10 expression in macrophages during phagocytosis of apoptotic cells is mediated by homeodomain proteins Pbx1 and Prep-1. Immunity. 2007;27(6):952–964. [DOI] [PMC free article] [PubMed] [Google Scholar]
- 39.Hou Y, Zhu L, Tian H, et al. IL-23-induced macrophage polarization and its pathological roles in mice with imiquimod-induced psoriasis. Protein Cell. 2018;9(12):1027–1038. [DOI] [PMC free article] [PubMed] [Google Scholar]
- 40.Horibe K, Hara M, Nakamura H. M2-like macrophage infiltration and transforming growth factor-beta secretion during socket healing process in mice. Arch Oral Biol. 2021;123:105042. [DOI] [PubMed] [Google Scholar]
- 41.Morhardt TL, Hayashi A, Ochi T, et al. IL-10 produced by macrophages regulates epithelial integrity in the small intestine. Sci Rep. 2019;9(1):1223. [DOI] [PMC free article] [PubMed] [Google Scholar]
- 42.Stoeckius M, Hafemeister C, Stephenson W, et al. Simultaneous epitope and transcriptome measurement in single cells. Nat Methods. 2017;14(9):865–868. [DOI] [PMC free article] [PubMed] [Google Scholar]
- 43.Schurch CM, Bhate SS, Barlow GL, et al. Coordinated Cellular Neighborhoods Orchestrate Antitumoral Immunity at the Colorectal Cancer Invasive Front. Cell. 2020. [DOI] [PMC free article] [PubMed] [Google Scholar]
Associated Data
This section collects any data citations, data availability statements, or supplementary materials included in this article.


