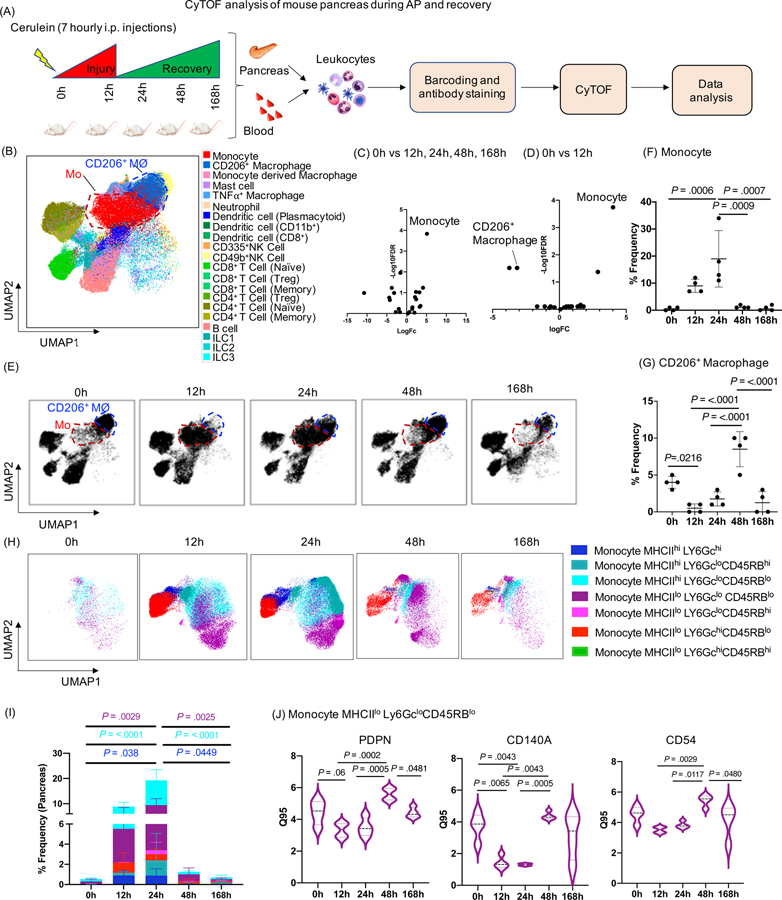
Figure 1: CyTOF analysis of mouse pancreas during AP and recovery.
(A) Experimental set up for induction of AP and recovery and CyTOF analysis of pancreas and blood. (B) UMAP plot showing various immune cell clusters in the pancreas. (C, D) Volcano plot showing differential abundance analysis of immune cells at all time points (12h, 24h, 48h, 168h) compared to control (0h) and pair wise comparison between 0h vs 12h (AP) respectively. Monocytes were labeled as the top altered immune cell followed by CD206+ macrophages. (E) UMAP plot showing clusters of monocytes (red circle) and CD206+ macrophages (blue circle) along with the kinetics of AP and recovery phase. (F, G) Frequency of monocytes and CD206+ macrophages in the pancreas. (H, I) UMAP plots showing seven novel monocyte subsets and their frequency. (J) DE analysis of monocyte MHCIIloLy6GcloCD45RBlo revealed PDPN, CD140a and CD54 were significantly altered during the AP and recovery. Mo- Monocytes; CD206+MØ - CD206+ macrophages

