Abstract
Background
Esophageal cancer is one of the most common malignant tumors. The role of tumor microenvironment in esophageal cancer is unclear.
Methods
The gene expression profiles and clinical data of 158 patients with esophageal cancer were extracted from The Cancer Genome Atlas database. Immune scores and stromal scores were calculated based on ESTIMATE algorithm. According to different immune/stromal scores, differentially expressed genes (DEGs) were identified. The function enrichment, protein interactions of shared DEGs and their associations with overall survival were analyzed.
Results
In regard to the association of the immune/stromal scores and disease stage, pathological type and overall survival, only the stromal scores among the different stages were significantly different (P=0.015). In the high immune and stromal score groups, 603 shared up-regulated genes were found. The related function and pathways included regulation of lymphocyte activation, cytokine binding and chemokine signaling pathway. Protein-protein interaction analysis showed that ITGAM had the most connections, followed by CXCL10 and CCR2. High expression of 11 genes, including MS4A7, TMIGD3, MS4A4A, EVI2A, MS4A6A, FCER1G, AIF1, GNGT2, LCP2, DNAJC5B and RNASE6, were found to be associated with shorter overall survival.
Conclusions
Microenvironment-associated functions and pathways were analyzed in esophageal cancer, and 11 microenvironment-associated genes were correlated to poor prognoses. Further studies on these genes may be helpful to understand the tumor microenvironment and provide new therapies for esophageal cancer.
Keywords: Esophageal cancer, tumor microenvironment (TME), prognosis
Introduction
Esophageal cancer is one of the most common malignant tumors in the world (1). The two main histological types of esophageal cancer are squamous cell carcinoma and adenocarcinoma, which have different clinical features and prognoses (2). Though multidisciplinary approaches are widely applied in esophageal cancer, the survival rates are dismal for advanced esophageal cancer (3,4).
The tumor microenvironment (TME), including immune cells and stromal cells, is associated with the disease progression, treatment response or prognosis of esophageal cancer (5,6). A comprehensive analysis of TME in pre-therapeutic biopsy samples has shown that tumor-infiltrating M2 macrophage predicted poor pathological response to neoadjuvant chemotherapy and unfavorable overall survival (OS) (7). In another report, cancer-associated fibroblasts in clinical samples were found to promote lymph node metastasis in esophageal cancers, which was confirmed in vitro and in vivo (8). Additionally, increases in interferon γ, activated lymphocytes and programmed death ligand-1 were shown to reshape the immune microenvironment after chemoradiation on esophageal cancers (9).
Estimation of STromal and Immune cells in MAlignant Tumors using Expression data (ESTIMATE) is a method to evaluate tumor purity by estimating stromal and immune scores using gene expression signatures (10). The ESTIMATE algorithm has been applied to analyzing gene expression profiles of bladder cancer, glioblastoma and pancreatic cancer from The Cancer Genome Atlas (TCGA) database (11-13).
In this study, we applied the ESTIMATE algorithm to the gene expression profiles of esophageal cancer from TCGA database, and found some microenvironment-associated functions or pathways. More importantly, we identified some TME-associated genes that correlated with poor esophageal cancer prognosis. We present the following article in accordance with the MDAR checklist (available at http://dx.doi.org/10.21037/tcr-20-2288).
Methods
Database
The gene expression profiles and clinical data of esophageal cancer were extracted from TCGA database (https://portal.gdc.cancer.gov/, February 16, 2020). Immune scores and stromal scores were calculated based on ESTIMATE algorithm using the “estimate” package (https://bioinformatics.mdanderson.org/estimate/rpackage.html) in R (R version 3.6.2, https://www.r-project.org/). The study was conducted in accordance with the Declaration of Helsinki (as revised in 2013). For this type of study, ethical approval and formal consent are not required.
Differentially expressed genes (DEGs)
To obtain DEGs, the “limma” package (https://bioconductor.org/packages/limma/) was used (fold change =2; adjusted P value <0.05). A heatmap of DEGs was created using the “pheatmap” package (https://CRAN.R-project.org/package=pheatmap). Shared DEGs were detected using the “VennDiagram” package (https://CRAN.R-project.org/package=VennDiagram).
Gene enrichment and protein interactions analysis
Gene Ontology (GO) and Kyoto Encyclopedia of Genes and Genomes (KEGG) analyses were performed using the “clusterProfiler” package (https://bioconductor.org/packages/clusterProfiler/). Protein-protein interaction (PPI) analysis was performed in the online STRING database (https://string-db.org/).
Survival analysis
Survival analysis was performed using the “survival” package (https://CRAN.R-project.org/package=survival).
Statistical analysis
The patients’ characteristics were described as n (%) for categorical variables and median with range for continuous variables. Comparisons of scores and comparisons of gene expressions in different groups were performed using non-parametric test. OS was defined as the time from the diagnosis of esophageal cancer to the death or the end of the study. OS was calculated using the Kaplan-Meier method and comparison of survival was conducted using the log-rank test. A P value <0.05 was considered statistically significant.
Results
Patients’ characteristics
The gene expression profiles and clinical data of 158 patients with esophageal cancer from the TCGA database were used for analysis. The patients’ characteristics are shown in Table 1. The median age was 60 years (range, 27–90 years), and 135 (85.4%) patients were male. There were 17 (10.8%), 72 (45.6%), 55 (34.8%) and 14 (8.9%) patients in stages I, II, III and IV, respectively. Seventy-eight (49.4%) patients were diagnosed with esophageal adenocarcinoma, and 80 (50.6%) were diagnosed with esophageal squamous cell carcinoma.
Table 1. Patients’ characteristics of esophageal cancer patients from TCGA.
| Characteristics | Number (%) |
|---|---|
| Total patients | 158 (100.0) |
| Age, years | |
| Median | 60 |
| Range | 27–90 |
| Gender | |
| Male | 135 (85.4) |
| Female | 23 (14.6) |
| Stage | |
| Stage I | 17 (10.8) |
| Stage II | 72 (45.6) |
| Stage III | 55 (34.8) |
| Stage IV | 14 (8.9) |
| Pathological type | |
| Adenocarcinoma | 78 (49.4) |
| Squamous cell carcinoma | 80 (50.6) |
TCGA, The Cancer Genome Atlas.
Immune scores and stromal scores
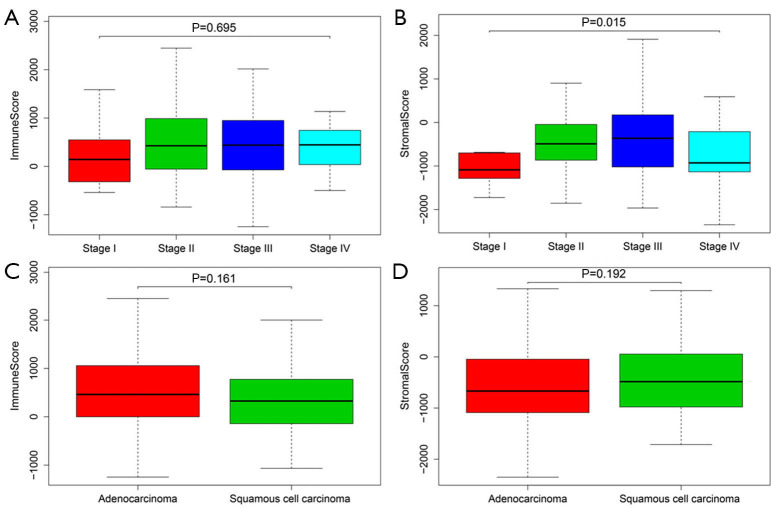
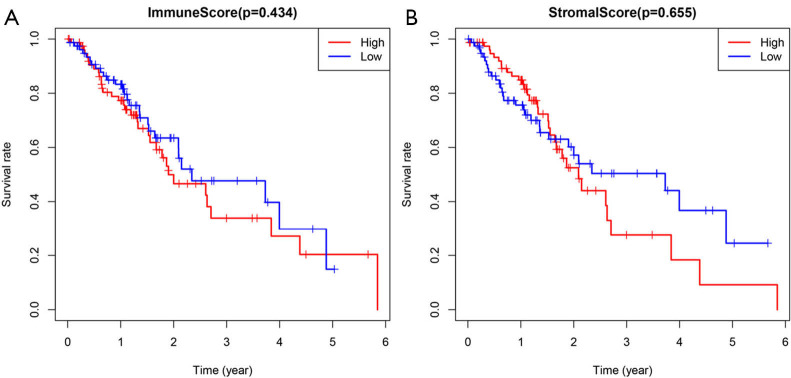
There was no significant difference in immune scores among the four disease stages (Figure 1A, P=0.695). Patients in stage III had the highest stromal scores (Figure 1B, P=0.015). Between patients with adenocarcinoma and squamous cell carcinoma, no significant difference was observed in immune scores (Figure 1C, P=0.161) or in stromal scores (Figure 1D, P=0.192). All patients were divided into high and low scores group based on the estimate scores with the median value as the cut-off. The median OS time was not significantly different between patients with high and low immune scores (Figure 2A, P=0.434), and also not different between patients with high and low stromal scores (Figure 2B, P=0.655).
Figure 1.
Associations of clinical characteristics and immune/stromal scores in esophageal cancer. (A,B) Immune scores (A) and (B) stromal scores in four different disease stages; (C,D) immune scores (C) and stromal scores (D) in two different pathological types.
Figure 2.
Over survival of esophageal cancer patients in different immune/stromal scores. (A) High immune scores vs. low immune scores; (B) high stromal scores vs. low stromal scores.
DEGs, gene enrichment and protein interactions analysis
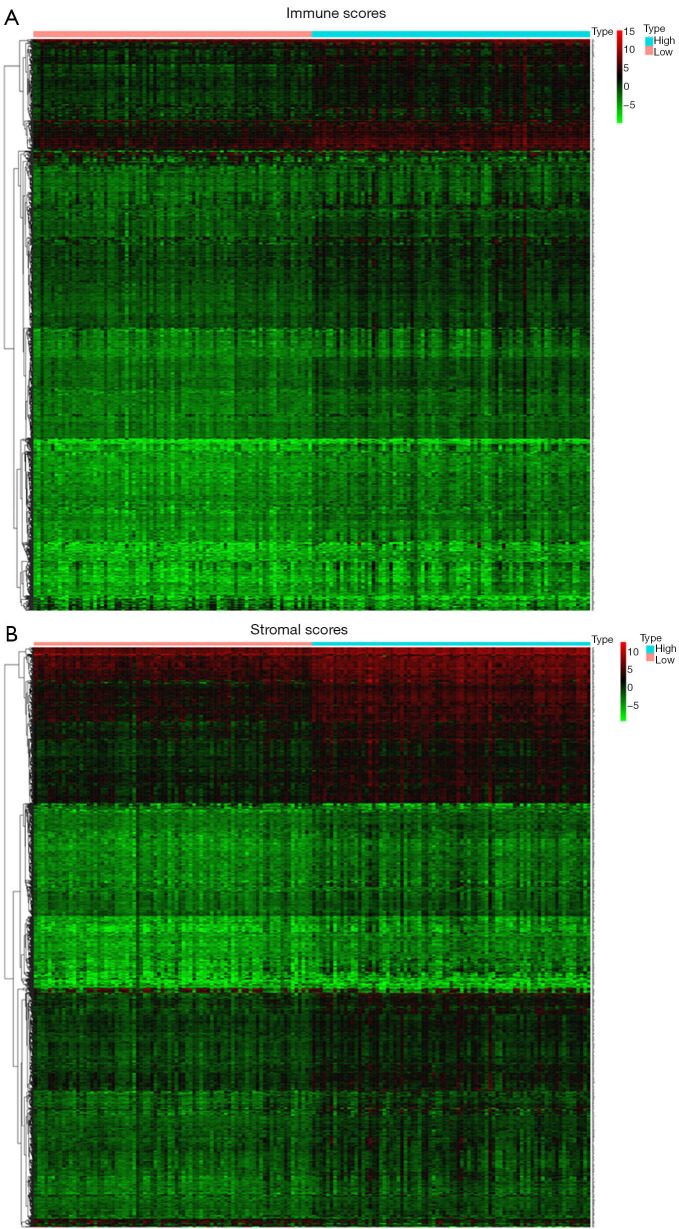
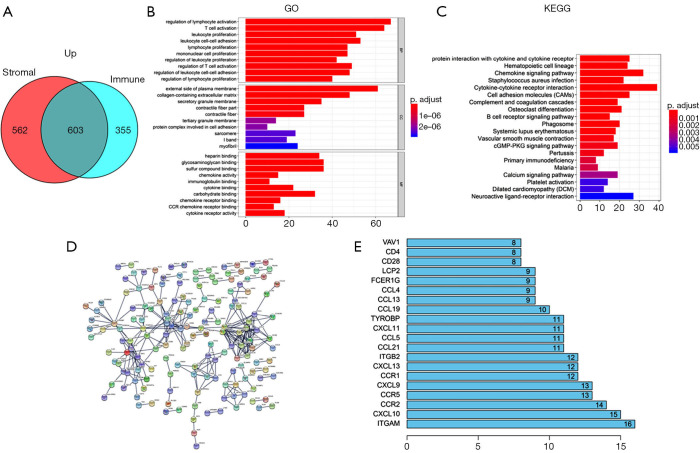
Compared with the low immune score group, 958 up-regulated genes and 62 down-regulated genes were observed in the high immune scores group. A heatmap of DEGs is shown in Figure 3A. Further, compared with the low stromal score group, 1,165 up-regulated genes and 55 down-regulated genes were observed in the high stromal score group. A heatmap of the DEGs is shown in Figure 3B. In the high immune and stromal score groups, 603 shared up-regulated genes were found (Figure 4A), and no shared down-regulated genes were found.
Figure 3.
Heatmaps of differentially expressed genes in different immune/stromal scores. (A) High immune scores vs. low immune scores; (B) high stromal scores vs. low stromal scores (fold change =2; adjust P value <0.05).
Figure 4.
Gene enrichment and protein interactions analysis. (A) Venn diagram of the 603 shared up-regulated genes; (B) top 10 GO terms; (C) top 20 KEGG pathways; (D) protein-protein interaction of differentially expressed genes; (E) the 20 genes with at least eight connections. GO, Gene Ontology; KEGG, Kyoto Encyclopedia of Genes and Genomes.
The function and pathway enrichment of the 603 shared genes were analyzed. The 10 most significant GO terms in biological process (BP), cellular component (CC) and molecular function (MF), including regulation of lymphocyte activation, external side of plasma membrane, cytokine binding, etc. are shown in Figure 4B. The 20 most significant KEGG pathways, including viral protein interaction with cytokine and cytokine receptor, hematopoietic cell lineage, chemokine signaling pathway, etc. are shown in Figure 4C.
PPI analysis was performed to elucidate the interactions of the shared DEGs. The PPI network consisted of 162 nodes and 276 edges (Figure 4D). The 20 genes with the most connections with other genes, such as ITGAM with 16 connections, CXCL10 with 15 connections and CCR2 with 14 connections, are shown in Figure 4E.
DEG expression and OS
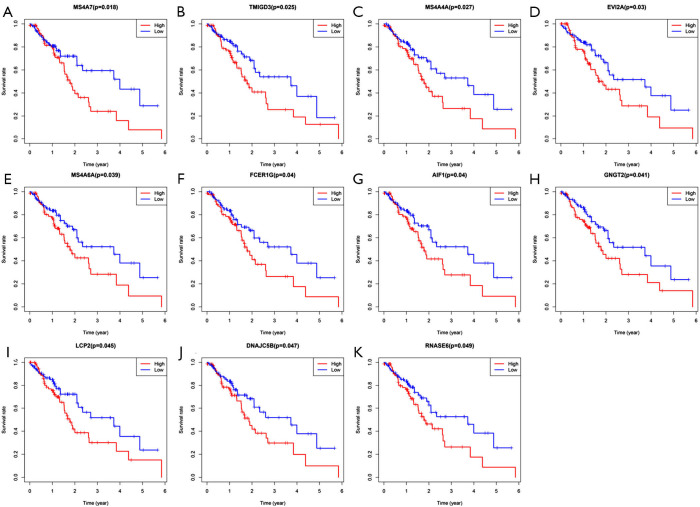
All patients were subdivided into two groups according to the expression of each of the 603 shared DEGs. Patients with higher than average of expression level of gene were regarded as the high expression group, and the other patients were regarded as the low expression group. OS comparisons were performed between the two groups for each gene. A total of 11 genes were found to be associated with OS. High expression of these genes predicted shorter OS (Figure 5). The 11 prognostic genes included MS4A7, TMIGD3, MS4A4A, EVI2A, MS4A6A, FCER1G, AIF1, GNGT2, LCP2, DNAJC5B and RNASE6.
Figure 5.
Overall survival of esophageal cancer patients in different expression levels of each gene in differentially expressed genes. (A) MS4A7; (B) TMIGD3; (C) MS4A4A; (D) EVI2A; (E) MS4A6A; (F) FCER1G; (G) AIF1; (H) GNGT2; (I) LCP2; (J) DNAJC5B; (K) RNASE6.
Discussion
M1-like macrophages and eosinophils play an important role in Barrett esophagus and chronic esophagitis, while M2-like macrophages and regulatory T cells are correlated with esophageal cancer development (14,15). The expression of RALDH2 and FOXP3 were reported to be associated with the aberrant immune microenvironment of Barrett esophagus (16). However, the role of TME in esophageal cancer is unclear.
In this study, we analyzed the gene expression profiles and clinical information of 158 patients with esophageal cancer in the TCGA database. In regard to the association of the immune/stromal scores and disease stage, pathological type and OS, only the stromal scores among the different stages were significantly different. A total of 603 shared up-regulated DEGs in the high immune and stromal score groups were found. The function and pathway enrichment, and PPI of the genes were analyzed. Moreover, high expression levels of 11 genes were found to be associated with the short survival time of esophageal cancer patients.
The stromal scores differed among the various stages, suggesting that TME plays a part in esophageal cancer development. Despite the different pathogenesis and prognosis in esophageal adenocarcinoma and esophageal squamous cell carcinoma, neither immune scores nor stromal scores were significantly different between the two pathological types in this study. The results might be explained by the similar TME in esophageal adenocarcinoma and esophageal squamous cell carcinoma (5). Besides, estimate scores were not found to be correlated with the survival of esophageal cancer patients in this study, though they have been reported to be prognostic in a few malignant tumors (12,13). Thus, further studies of immune and stromal components in TME of esophageal cancer are needed.
In the high immune and stromal scores groups, 603 shared regulated genes were identified. The shared genes underwent GO and KEGG analyses. All the GO terms in BP were associated with immune functions, involving leukocyte activation, adhesion and proliferation. Most of the other GO terms were also related to the immune system, such as chemokine activity, chemokine receptor binding, cytokine binding and cytokine receptor activity. In addition, most KEGG pathways were also associated with the immune system, such as chemokine signaling pathway, cytokine-cytokine receptor interaction, cell adhesion molecules and B cell receptor signaling pathway.
A PPI network was created to show the interactions of the shared DEGs. The genes with at least eight connections to other genes are shown in Figure 4E. ITGAM gene had the most connections, followed by CXCL10 and CCR2. ITGAM, also known as CD11B, was a risk factor of systemic lupus erythematosus (17), but its role in cancer is unclear. In patients with esophageal cancer, the lower levels of CXCL10 in the tumor tissue and serum were reported to be associated with favorable survival and better histopathological response, respectively (18). Further, CCL2-CCR2 axis was reported to increase tumor associated macrophages in esophageal carcinogenesis, and predicted adverse outcome (19).
Of the 603 shared upregulated genes, 11 were found to be correlated with the OS time of patients with esophageal cancer. We found that high expression of these genes predicted poor prognosis. In the prognostic genes, high expression of MS4A7 and MS4A4A was associated with poor prognoses in gastric cancer patients (20,21). TMIGD3 isoform 1 could suppress the malignant progression of osteosarcoma cells (22), whereas high expression of EVI2A indicated worse OS in osteosarcoma (23). MS4A6A was related to the Alzheimer’s disease risk and pathology (24). FCER1G was involved in the progression of lung adenocarcinoma and clear cell renal cell carcinoma (25,26). AIF1 was upregulated in M2-like macrophages and associated with the advanced stages and poor survival of hepatocellular carcinoma (27). GNGT2 was also detected as a prognostic marker in esophageal cancer in another report (28). LCP2, an inflammatory factor, was revealed as the potential prognostic factor in colorectal cancer and diffuse large B-cell lymphoma (29,30). In contrast to our results, the high expression levels of DHAJC5B and RNASE6 were reported to be associated with better survival in esophageal squamous cell carcinoma (31,32). In brief, the prognostic genes in our paper have not yet been thoroughly studied in previous literatures. More researches are required to elucidate and confirm the role of these genes in patients with esophageal cancer.
In conclusion, microenvironment-associated functions and pathways were analyzed in patients with esophageal cancer from the TCGA database. Moreover, we found 11 microenvironment-associated genes that were correlated to poor outcomes of esophageal cancer patients. These genes might be used as prognostic biomarkers for esophageal cancer. Further studies on these genes may be helpful to understand the TME and provide new therapies for esophageal cancer.
Acknowledgments
Funding: None.
Ethical Statement: The authors are accountable for all aspects of the work in ensuring that questions related to the accuracy or integrity of any part of the work are appropriately investigated and resolved. The study was conducted in accordance with the Declaration of Helsinki (as revised in 2013). For this type of study, ethical approval and formal consent are not required.
Footnotes
Reporting Checklist: The authors have completed the MDAR reporting checklist. Available at http://dx.doi.org/10.21037/tcr-20-2288
Conflicts of Interest: Both authors have completed the ICMJE uniform disclosure form (available at http://dx.doi.org/10.21037/tcr-20-2288). The authors have no conflicts of interest to declare.
References
- 1.Torre LA, Bray F, Siegel RL, et al. Global cancer statistics, 2012. CA Cancer J Clin 2015;65:87-108. 10.3322/caac.21262 [DOI] [PubMed] [Google Scholar]
- 2.Siewert JR, Ott K. Are squamous and adenocarcinomas of the esophagus the same disease? Semin Radiat Oncol 2007;17:38-44. 10.1016/j.semradonc.2006.09.007 [DOI] [PubMed] [Google Scholar]
- 3.Cancer Genome Atlas Research Network. Analysis Working Group : Asan University; BC Cancer Agency, et al. Integrated genomic characterization of oesophageal carcinoma. Nature 2017;541:169-75. 10.1038/nature20805 [DOI] [PMC free article] [PubMed] [Google Scholar]
- 4.Lagergren J, Smyth E, Cunningham D, et al. Oesophageal cancer. Lancet 2017;390:2383-96. 10.1016/S0140-6736(17)31462-9 [DOI] [PubMed] [Google Scholar]
- 5.Lin EW, Karakasheva TA, Hicks PD, et al. The tumor microenvironment in esophageal cancer. Oncogene 2016;35:5337-49. 10.1038/onc.2016.34 [DOI] [PMC free article] [PubMed] [Google Scholar]
- 6.Quail DF, Joyce JA. Microenvironmental regulation of tumor progression and metastasis. Nat Med 2013;19:1423-37. 10.1038/nm.3394 [DOI] [PMC free article] [PubMed] [Google Scholar]
- 7.Yamamoto K, Makino T, Sato E, et al. Tumor-infiltrating M2 macrophage in pretreatment biopsy sample predicts response to chemotherapy and survival in esophageal cancer. Cancer Sci 2020;111:1103-12. 10.1111/cas.14328 [DOI] [PMC free article] [PubMed] [Google Scholar]
- 8.Kashima H, Noma K, Ohara T, et al. Cancer-associated fibroblasts (CAFs) promote the lymph node metastasis of esophageal squamous cell carcinoma. Int J Cancer 2019;144:828-40. 10.1002/ijc.31953 [DOI] [PubMed] [Google Scholar]
- 9.Kelly RJ, Zaidi AH, Smith MA, et al. The Dynamic and Transient Immune Microenvironment in Locally Advanced Esophageal Adenocarcinoma Post Chemoradiation. Ann Surg 2018;268:992-9. 10.1097/SLA.0000000000002410 [DOI] [PubMed] [Google Scholar]
- 10.Yoshihara K, Shahmoradgoli M, Martinez E, et al. Inferring tumour purity and stromal and immune cell admixture from expression data. Nat Commun 2013;4:2612. 10.1038/ncomms3612 [DOI] [PMC free article] [PubMed] [Google Scholar]
- 11.Luo Y, Zeng G, Wu S. Identification of Microenvironment-Related Prognostic Genes in Bladder Cancer Based on Gene Expression Profile. Front Genet 2019;10:1187. 10.3389/fgene.2019.01187 [DOI] [PMC free article] [PubMed] [Google Scholar]
- 12.Jia D, Li S, Li D, et al. Mining TCGA database for genes of prognostic value in glioblastoma microenvironment. Aging (Albany NY) 2018;10:592-605. 10.18632/aging.101415 [DOI] [PMC free article] [PubMed] [Google Scholar]
- 13.Pu N, Chen Q, Gao S, et al. Genetic landscape of prognostic value in pancreatic ductal adenocarcinoma microenvironment. Ann Transl Med 2019;7:645. 10.21037/atm.2019.10.91 [DOI] [PMC free article] [PubMed] [Google Scholar]
- 14.Miyashita T, Tajima H, Shah FA, et al. Impact of inflammation-metaplasia-adenocarcinoma sequence and inflammatory microenvironment in esophageal carcinogenesis using surgical rat models. Ann Surg Oncol 2014;21:2012-9. 10.1245/s10434-014-3537-5 [DOI] [PubMed] [Google Scholar]
- 15.Straumann A, Safroneeva E. Eosinophils in the gastrointestinal tract: friends or foes? Acta Gastroenterol Belg 2012;75:310-5. [PubMed] [Google Scholar]
- 16.Lind A, Siersema PD, Kusters JG, et al. The Microenvironment in Barrett's Esophagus Tissue Is Characterized by High FOXP3 and RALDH2 Levels. Front Immunol 2018;9:1375. 10.3389/fimmu.2018.01375 [DOI] [PMC free article] [PubMed] [Google Scholar]
- 17.Ramírez-Bello J, Sun C, Valencia-Pacheco G, et al. ITGAM is a risk factor to systemic lupus erythematosus and possibly a protection factor to rheumatoid arthritis in patients from Mexico. PLoS One 2019;14:e0224543. 10.1371/journal.pone.0224543 [DOI] [PMC free article] [PubMed] [Google Scholar]
- 18.Blank S, Nienhuser H, Dreikhausen L, et al. Inflammatory cytokines are associated with response and prognosis in patients with esophageal cancer. Oncotarget 2017;8:47518-32. 10.18632/oncotarget.17671 [DOI] [PMC free article] [PubMed] [Google Scholar]
- 19.Yang H, Zhang Q, Xu M, et al. CCL2-CCR2 axis recruits tumor associated macrophages to induce immune evasion through PD-1 signaling in esophageal carcinogenesis. Mol Cancer 2020;19:41. 10.1186/s12943-020-01165-x [DOI] [PMC free article] [PubMed] [Google Scholar]
- 20.Sun L, Zhang Y, Zhang C. Distinct Expression and Prognostic Value of MS4A in Gastric Cancer. Open Med (Wars) 2018;13:178-88. 10.1515/med-2018-0028 [DOI] [PMC free article] [PubMed] [Google Scholar]
- 21.Wang H, Wu X, Chen Y. Stromal-Immune Score-Based Gene Signature: A Prognosis Stratification Tool in Gastric Cancer. Front Oncol 2019;9:1212. 10.3389/fonc.2019.01212 [DOI] [PMC free article] [PubMed] [Google Scholar]
- 22.Iyer SV, Ranjan A, Elias HK, et al. Genome-wide RNAi screening identifies TMIGD3 isoform1 as a suppressor of NF-kappaB and osteosarcoma progression. Nat Commun 2016;7:13561. 10.1038/ncomms13561 [DOI] [PMC free article] [PubMed] [Google Scholar]
- 23.Li S, Yang F, Yang YK, et al. Increased expression of ecotropic viral integration site 2A indicates a poor prognosis and promotes osteosarcoma evolution through activating MEK/ERK pathway. J Recept Signal Transduct Res 2019;39:368-72. 10.1080/10799893.2019.1669182 [DOI] [PubMed] [Google Scholar]
- 24.Lacher SE, Alazizi A, Wang X, et al. A hypermorphic antioxidant response element is associated with increased MS4A6A expression and Alzheimer's disease. Redox Biol 2018;14:686-93. 10.1016/j.redox.2017.10.018 [DOI] [PMC free article] [PubMed] [Google Scholar]
- 25.Guo T, Ma H, Zhou Y. Bioinformatics analysis of microarray data to identify the candidate biomarkers of lung adenocarcinoma. PeerJ 2019;7:e7313. 10.7717/peerj.7313 [DOI] [PMC free article] [PubMed] [Google Scholar]
- 26.Chen L, Yuan L, Wang Y, et al. Co-expression network analysis identified FCER1G in association with progression and prognosis in human clear cell renal cell carcinoma. Int J Biol Sci 2017;13:1361-72. 10.7150/ijbs.21657 [DOI] [PMC free article] [PubMed] [Google Scholar]
- 27.Cai H, Zhu XD, Ao JY, et al. Colony-stimulating factor-1-induced AIF1 expression in tumor-associated macrophages enhances the progression of hepatocellular carcinoma. Oncoimmunology 2017;6:e1333213. 10.1080/2162402X.2017.1333213 [DOI] [PMC free article] [PubMed] [Google Scholar]
- 28.Liu GM, Ji X, Lu TC, et al. Comprehensive multi-omics analysis identified core molecular processes in esophageal cancer and revealed GNGT2 as a potential prognostic marker. World J Gastroenterol 2019;25:6890-901. 10.3748/wjg.v25.i48.6890 [DOI] [PMC free article] [PubMed] [Google Scholar]
- 29.Jiang H, Dong L, Gong F, et al. Inflammatory genes are novel prognostic biomarkers for colorectal cancer. Int J Mol Med 2018;42:368-80. 10.3892/ijmm.2018.3631 [DOI] [PMC free article] [PubMed] [Google Scholar]
- 30.Li C, Zhu B, Chen J, et al. Novel prognostic genes of diffuse large B-cell lymphoma revealed by survival analysis of gene expression data. Onco Targets Ther 2015;8:3407-13. 10.2147/OTT.S90057 [DOI] [PMC free article] [PubMed] [Google Scholar]
- 31.Sun H, Cai X, Zhou H, et al. The protein-protein interaction network and clinical significance of heat-shock proteins in esophageal squamous cell carcinoma. Amino Acids 2018;50:685-97. 10.1007/s00726-018-2569-8 [DOI] [PubMed] [Google Scholar]
- 32.Yu D, Ruan X, Huang J, et al. Comprehensive Analysis of Competitive Endogenous RNAs Network, Being Associated With Esophageal Squamous Cell Carcinoma and Its Emerging Role in Head and Neck Squamous Cell Carcinoma. Front Oncol 2020;9:1474. 10.3389/fonc.2019.01474 [DOI] [PMC free article] [PubMed] [Google Scholar]


