Abstract
Background
Despite recent advances in screening, treatment, and survival, breast cancer remains the most invasive cancer in women. The development of novel diagnostic and therapeutic markers for breast cancer may provide more information about its pathogenesis and progression.
Methods
We obtained GSE86374 micro-expression matrix chip data from the Gene Expression Omnibus (GEO) database consisting of 159 samples (124 normal samples and 35 breast cancer samples). The language was then used to perform data processing and differential expression analysis. For all differentially expressed genes (DEGs), “FDR <0.01 and |logFC| ≥1” were selected as thresholds.
Results
In this study, 173 up-regulated genes and 143 down-regulated genes were selected for GO and KEGG enrichment analysis. These genes are also significantly enriched in the KEGG pathway, including phenylalanine metabolism, staphylococcus aureus infection, and the PPAR signaling pathway. The survival and prognosis of the selected eight key genes (DLGAP5, PRC1, TOP2A, CENPF, RACGAP1, RRM2, PLK1, and ASPM) were analyzed by the Kaplan-Meier plotter database.
Conclusions
Eight hub genes and pathways closely related to the onset and progression of breast cancer were identified. We found that the PPAR signaling pathway, especially PPARγ, plays an important role in breast cancer and suggest this pathway be the subject of further research.
Keywords: Breast cancer, hub genes, key pathways, survival analysis, prognostic markers
Introduction
Despite great advances in the diagnosis and treatment of cancer, breast cancer remains a major threat to women’s health. Breast cancer is the leading cause of cancer-related deaths among women worldwide, accounting for 14%, and its incidence and mortality rates are expected to gradually increase in the coming years (1). It comprises 22.9% of invasive cancers in women and 16% of all female cancers (2), and at the molecular level, is a heterogenous disease. According to its molecular characteristics, breast cancer can be divided into three types: BRCA mutation, hormone receptor (HR: estrogen receptor and progesterone receptor) activation, and human epidermal growth factor receptor 2 (HER2, encoded by ERBB2) activation (3). Through R language and related software packages, we explored potential molecular targets and signaling pathways related to the occurrence and development of breast cancer patients at the genomic level. This may provide an important theoretical basis for the discovery of new therapeutic targets for breast cancer.
With the wide applications of gene expression analysis based on microarray technology, high-throughput and powerful research methods can simultaneously detect changes of expression in thousands of genes at mRNA levels. Using microarray technology for gene expression profiling, several studies have identified differentially expressed genes (DEGs) that play a critical role in the occurrence and progression of breast cancer, which also have the potential of becoming drug targets and diagnostic markers.
In this study, we identified the associated DEGs between breast cancer tissue and normal breast tissue, and conducted continuous GO project enrichment analysis, KEGG pathway analysis, and PPI network analysis to search for hub genes and key pathways related to breast cancer. We present the following article in accordance with the MDAR checklist (available at http://dx.doi.org/10.21037/tcr-21-749).
Methods
Acquisition of microarray data
The study was conducted in accordance with the Declaration of Helsinki (as revised in 2013).
The National Center for Biotechnology Information (NCBI) gene expression in the comprehensive database (GEO, http://www.ncbi.nlm.nih.gov/geo/) stores a selection of gene expression data sets, original series, and platforms. We downloaded GSE86374, a breast cancer-related dataset submitted by Rebollar-Vega R and based on the GPL6244 platform ((HuGene-1_0-st) Affymetrix Human Gene 1.0 ST Array), from the GEO database, comprising 124 breast cancer samples and 35 normal samples.
Identification of DEGs
Statistical software R (version 3.6.2, https://www.r-project.org/) and packages of Bioconductor (http://www.bioconductor.org/) were used to perform the significance analysis of DEGs between breast cancer samples and normal samples. Firstly, the quality of microarray data was detected by normalized unscaled standard errors (NUSE) box plot to remove unqualified samples. Based on the "Limma" package, we used empirical Bayesian method to screen for significantly different genes, then used the "hugene10sttranscriptcluster" package to annotate DEGs. A P<0.05 was considered statistically significant.
GO term and KEGG pathway enrichment analysis
Through GO term enrichment analysis, including biological processes, cellular components, and molecular functions, the biological significance of DEGs was explored, based on the Bioconductor Package "ggplot2". The KEGG pathway enrichment analysis of DEGGs was performed by the Bioconductor Package "pathview" to find key pathways closely related to the occurrence and progression of breast cancer. P<0.05 was considered statistically significant and achieved significant enrichment.
Protein-protein interaction (PPI) network analysis
On an interactive level, the PPI network can help us identify hub genes and key genetic modules related to breast cancer development. PPI information of DEGs was obtained from a search tool (STRING) database (http://www.string-db.org/) that retrieved interacting genes. The PPI network was then built using Cytoscape software, and a module analysis was performed in Cytoscape through a plug-in molecular complex detection (MCODE) to clarify the biological significance of the genetic modules in breast cancer. A P<0.05 was considered to be significantly significant.
Survival analysis of critical genes
In this study, key genes were obtained by applying to The Cancer Genome Atlas (TCGA) for patients with breast cancer data in the Kaplan Meier-plotter (http://kmplot.com/analysis/) database for survival prognosis analysis.
Statistical analysis
The FC in log2FC is fold change, which represents the ratio of the expression levels between normal samples and breast cancer samples, and the logarithm to the base 2 is log2FC. Generally, by default, the absolute value of log2FC is greater than 1 as the screening criterion for differential genes; FDR stands for False Discovery Rate, which is obtained by correcting the P-value of the significance of the difference. Since the differential expression analysis of transcriptome sequencing is an independent statistical hypothesis test on a large number of gene expression values, there will be false positive problems. Therefore, in the process of differential expression analysis, the recognized Benjamini-Hochberg correction method is used to correct the original hypothesis. The significant p-value obtained by the test is corrected, and FDR is finally used as the key indicator for the screening of differentially expressed genes. Generally take FDR <0.01 or 0.05 as the default standard.
Results
The identification of DEGs
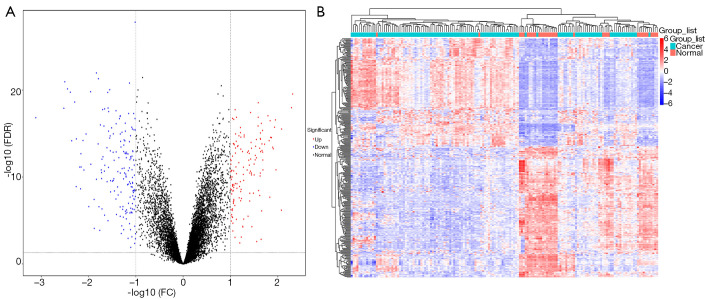
The gene expression dataset GSE86374 was downloaded from the GEO database resulting in 46 microarrays based on the GPL6244 platform, including 124 breast cancer samples and 35 normal samples. Microarray data was preprocessed and the gene differential expression analyzed by using statistical analysis software R. We then selected 316 DEGs based on cut-off criteria [false discovery rate (FDR) <0.05 and |logFC| ≥1] consisting of 143 significantly down-regulated DEGs and 173 significantly up-regulated DEGs, for the subsequent bioinformatics analysis (Figure 1A). The expression level of the top 100 DEGs with fold change >1 is displayed in Figure 1B.
Figure 1.
The identification of DEGs. (A) Volcano map with differential expression. The red represents173 up-regulated genes and the blue represents 143 down-regulated genes. (B) Heat maps of DEGs GO term enrichment analysis of DEGs. DEG, differentially expressed gene.
GO term enrichment analysis and KEGG pathway analysis of DEGs
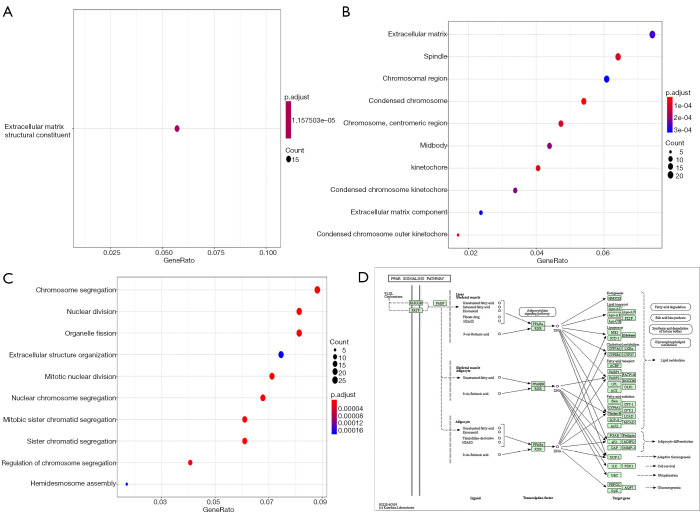
Enrichment analysis of the DEGs was obtained through the screening of the “clusterProfiler” package. Firstly, the DEGs were analyzed for molecular function, cellular component, and biological process enrichment. These genes were found to have extracellular matrix structural constituents in terms of molecular function (Figure 2A) including extracellular matrix fibrillar collagen trimer, spindle, chromosomal region, and condensed chromosome. for cellular components (Figure 2B, Table 1), and chromosome segregation, nuclear division, organelle fission, and extracellular structure organization for biological processes (Figure 2C, Table 2). Secondly, the KEGG pathway enrichment analysis of differential genes was found to be significantly enriched in phenylalanine metabolism, staphylococcus aureus infection, and PPAR signaling pathway (Figure 2D, Table 3).
Figure 2.
GO enrichment analysis result of DEGs with |logFC| ≥1: (A) molecular function; (B) cellular component; (C) biological process. (D) Visualization of KEGG pathway enrichment of DEGs in normal and breast cancer tissues (showing hsa03320 pathway). DEG, differentially expressed gene.
Table 1. Molecular function enrichment analysis of DEGs (FDR <0.05 and |logFC| ≥1) bewtween normal and breast cancer tissues.
| ID | Description | P.adjust | qvalue | Count |
|---|---|---|---|---|
| GO:0007059 | Chromosome segregation | 2.40E–09 | 2.20E–09 | 26 |
| GO:0000070 | Mitotic sister chromatid segregation | 1.02E–08 | 9.30E–09 | 18 |
| GO:0000819 | Sister chromatid segregation | 1.30E–07 | 1.19E–07 | 18 |
| GO:0140014 | Mitotic nuclear division | 3.52E–07 | 3.22E–07 | 21 |
| GO:0098813 | Nuclear chromosome segregation | 4.73E–07 | 4.33E–07 | 20 |
| GO:0000280 | Nuclear division | 3.47E–06 | 3.17E–06 | 24 |
| GO:0051983 | Regulation of chromosome segregation | 1.82E–05 | 1.66E–05 | 12 |
| GO:0048285 | Organelle fission | 1.82E–05 | 1.66E–05 | 24 |
| GO:0031581 | Hemidesmosome assembly | 0.000169 | 0.000155 | 5 |
| GO:0043062 | Extracellular structure organization | 0.000169 | 0.000155 | 22 |
| GO:0060337 | Type I interferon signaling pathway | 0.000704 | 0.000644 | 10 |
| GO:0071357 | Cellular response to type I interferon | 0.000704 | 0.000644 | 10 |
| GO:0030198 | Extracellular matrix organization | 0.000787 | 0.00072 | 19 |
| GO:0034340 | Response to type I interferon | 0.000895 | 0.00082 | 10 |
| GO:0008608 | Attachment of spindle microtubules to kinetochore | 0.001476 | 0.001352 | 6 |
| GO:0007088 | Regulation of mitotic nuclear division | 0.001536 | 0.001406 | 12 |
| GO:0000226 | Microtubule cytoskeleton organization | 0.001666 | 0.001526 | 22 |
| GO:0050000 | Chromosome localization | 0.004205 | 0.00385 | 8 |
| GO:0051303 | Establishment of chromosome localization | 0.004205 | 0.00385 | 8 |
| GO:0030574 | Collagen catabolic process | 0.004654 | 0.004261 | 6 |
| GO:0051783 | Regulation of nuclear division | 0.004654 | 0.004261 | 12 |
| GO:0051310 | Metaphase plate congression | 0.004851 | 0.004442 | 7 |
| GO:0006936 | Muscle contraction | 0.008553 | 0.007832 | 17 |
DEG, differentially expressed gene; FDR, false discovery rate.
Table 2. Cellular component enrichment analysis of DEGs (FDR <0.05 and |logFC| ≥1) between normal and breast cancer tissue.
| ID | Description | P.adjust | qvalue | Count |
|---|---|---|---|---|
| GO:0000793 | Condensed chromosome | 4.38E–05 | 3.94E–05 | 16 |
| GO:0000940 | Condensed chromosome outer kinetochore | 0.000109 | 9.84E–05 | 5 |
| GO:0000776 | Kinetochore | 0.000109 | 9.84E–05 | 12 |
| GO:0005819 | Spindle | 0.000109 | 9.84E–05 | 19 |
| GO:0000775 | Chromosome, centromeric region | 0.000113 | 0.000101 | 14 |
| GO:0030496 | Midbody | 0.000211 | 0.00019 | 13 |
| GO:0000777 | Condensed chromosome kinetochore | 0.000217 | 0.000196 | 10 |
| GO:0031012 | Extracellular matrix | 0.000273 | 0.000246 | 22 |
| GO:0098687 | Chromosomal region | 0.000308 | 0.000277 | 18 |
| GO:0044420 | Extracellular matrix component | 0.000308 | 0.000277 | 7 |
| GO:0000779 | Condensed chromosome, centromeric region | 0.000326 | 0.000294 | 10 |
| GO:0005876 | Spindle microtubule | 0.000579 | 0.000522 | 7 |
| GO:0000922 | Spindle pole | 0.000872 | 0.000785 | 11 |
| GO:0005874 | Microtubule | 0.001537 | 0.001384 | 17 |
DEG, differentially expressed gene; FDR, false discovery rate.
Table 3. KEGG pathway enrichment analysis of DEGs between normal and breast cancer tissues.
| ID | Description | P.adjust | qvalue | Count |
|---|---|---|---|---|
| hsa00360 | Phenylalanine metabolism | 0.037685 | 0.037178 | 4 |
| hsa05150 | Staphylococcus aureus infection | 0.037685 | 0.037178 | 8 |
| hsa03320 | PPAR signaling pathway | 0.037685 | 0.037178 | 7 |
DEG, differentially expressed gene.
PPI network analysis of DEGs
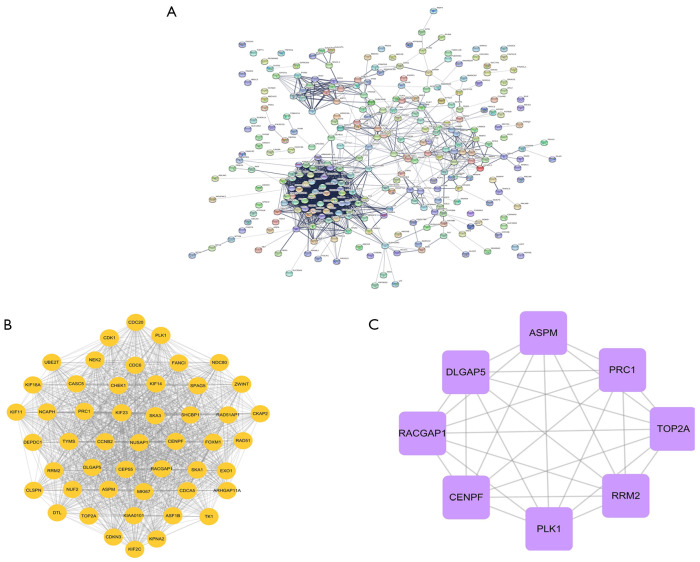
The 416 DEGs were uploaded to the STRING database (version11) to construct a differential gene PPI network (Figure 3A), and to further identify the key genes, the network map data obtained from the STRING database was uploaded to Cytoscape software (version3.7.1). Setting the combined score >0.4 and MCODE Score as the screening threshold, we obtained the network diagram of one functional module (Figure 3B). According to the connectivity and Degree Score >47, we obtained eight key genes of DLGAP5, PRC1, TOP2A, CENPF, RACGAP1, RRM2, PLK1, and ASPM (Figure 3C). All hub genes related to the prognosis of patients.
Figure 3.
Protein-protein interaction network analysis of DEGs. (A) 316 DEGs protein-protein interaction (PPI) network diagram. (B) Cluster consists of 49 nodes and 1,109 edges. (C) Screen the hub genes from DEGs and PPI. DEG, differentially expressed gene.
Survival analysis of critical genes
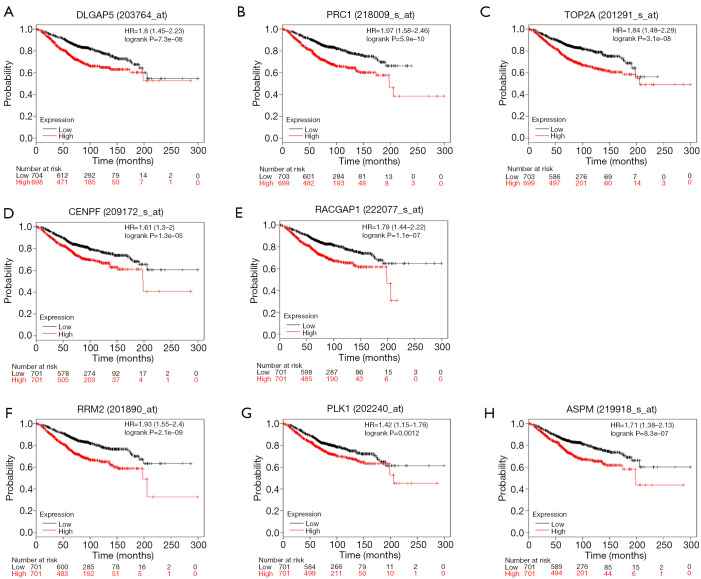
The prognostic value of the eight critical genes was analyzed in a Kaplan-Meier plotter and TCGA database was used as the reference data to obtain the overall survival time of breast cancer patients (Figure 4).
Figure 4.
Kaplan-Meier total survival analysis was performed for all DEGs in 1402 breast cancer patients from the TCGA database. (A) DLGAP5, P=7.3e−08; (B) PRC1, P=5.9e−10; (C) TOP2A, P=3.1e−08; (D) CENPF, P=1.3e−05; (E) RACGAP1, P=1.1e−07; (F) RRM2, P=2.1e−09; (G) PLK1, P=0.0012; (H) ASPM, P=8.3e−07. DEG, differentially expressed gene.
Discussion
To screen for key genes and pathways closely associated with breast cancer, we identified significant DEGs between cancer samples and normal samples, and performed a series of bioinformatics analyses. Through significant analysis of microarray data in statistical software R, we identified 316 DEGs with a |logFC| ≥1, including 173 up-regulated DEGs and 143 down-regulated DEGs. Bioinformatics analysis of DEGs, including GO item enrichment analysis, KEGG pathway analysis, and PPI network analysis, identified genes and pathways associated with breast cancer which played an important role in the occurrence and progression of cancer in different ways.
According to DEGs, GO item enrichment analysis, and PPI network analysis, eight hub genes were excavated. After further analysis, we found that all hub genes were connected with cellular component including extracellular matrix fibrillar collagen trimer, spindle, chromosomal region, and condensed chromosome, and were related to biological processes like chromosome segregation, nuclear division, organelle fission, and extracellular structure organization. By KEGG pathway analysis, these DEGs were enriched for phenylalanine metabolism, staphylococcus aureus infection, and PPAR signaling pathway.
As a nuclear hormone receptor activated by fatty acids and their derivatives, PPAR (Peroxisome proliferator-activated receptors) consists of three subtypes; PPARα, PPARβ/δ, and PPARγ, which show different expression patterns in vertebrates. Each one is encoded by a single gene and combines fatty acids with eicosanes (4). PPARα cleaves circulating or cellular lipids and acts by regulating the expression of genes involved in lipid metabolism in the liver and skeletal muscle, and PPARβ/δ plays a role in lipid oxidation and cell proliferation. PPARγ plays an important role in adipocyte differentiation by mediating adipocyte differentiation and regulating adipocyte metabolism, and has been found to be an important tumor suppressor gene in many malignancies (5). This prompted us to investigate the expression and mutational status of the PPARγ gene in cancers of a variety of tissues. Previous studies showed that PPARγ is also expressed in malignant tissue including breast cancer and that PPARγ inhibitors could inhibit proliferation and induce differentiation of transformed cells (6,7). It is also reported that PPARδ selective receptor agonists stimulate human breast cancer spreading cell line and primary endothelial cells (8).
In addition to the key signaling pathways, we analyzed the key genes that were excavated. Interestingly, all key genes, including DLGAP5, PRC1, TOP2A, CENPF, RACGAP1, RRM2, PLK1, and ASPM, were clearly related to the prognosis of patients diagnosed with breast cancer, with a P value <0.05. DLGAP5 up-regulation also has shown to be closely associated with cellular invasion (9), and is a novel cell cycle-regulated gene that can inhibit the proliferation and invasion of carcinoma cells (10). Although the gene that encodes PRC1 is not normally mutated in cancer, in many hormone-related cancers, including breast cancer, some of the typical PRC1 genes are amplified and malregulated. Hormone-associated cancers have a unique carcinogenic mechanism in which the accumulation of mutations induced by proliferation are hormone driven (11,12). As a single amplicon downstream of the HER2 amplicon, TOP2A is frequently altered in HER2-amplified tumors (13,14). A large-scale analysis showed that in ER-positive breast cancer, elevated TOP2A expression was an independent prognostic factor, strongly correlated with tumor size, grade, lymph node status, HER2 status, and Ki67 expression (13,15). Centromere protein F (CENPF) is a cell cycle-related nuclear antigen, which is maximally expressed in G2/M cells and at a low level in G0/G1 cells, and aggregates in the nuclear stroma during S phase. CENPF was identified as a marker of cell proliferation in several human malignancies, including breast cancer (16,17). RACGAP1 is a known regulator of cytokinesis, and studies have shown that knockout of RACGAP1 causes about 30–45% of basal-like breast cancer cells to fail cytoplasmic division and become multinucleated, which may be an important reason why these cells are unable to proliferate (18,19). RRM2 has been shown to be up-regulated in breast cancer, and miR-204-5p inhibited RRM2 expression by targeting RRM2 (20). Polo-like kinase 1 (Plk1) was a frequent and strong hit in basal breast cancer cell lines, indicating its importance for the growth and survival of these breast cancer cells (21). Polo-like kinase 1 (Plk1) is a key oncogenic regulator of completion of G2-M phase of the cell cycle (22), and its analysis showed that ASPM inhibition by siRNA-mediated knockdown inhibits tumor cell proliferation (23).
In summary, after a series of bioinformatics analyses of DEGs to detect differences in breast cancer samples and normal samples, we identified eight hub genes and pathways closely related to the occurrence and progression of breast cancer. We found that in the PPAR signaling pathway, PPARγ plays an important role in breast cancer. These identified genes and pathways may provide a more defined underlying molecular mechanism explaining the occurrence and progression of breast cancer, and hold promise for acting as potential biomarkers and therapeutic targets.
Acknowledgments
Funding: None.
Ethical Statement: The authors are accountable for all aspects of the work in ensuring that questions related to the accuracy or integrity of any part of the work are appropriately investigated and resolved. The study was conducted in accordance with the Declaration of Helsinki (as revised in 2013).
Reporting Checklist: The authors have completed the MDAR checklist. Available at http://dx.doi.org/10.21037/tcr-21-749
Conflicts of Interest: All authors have completed the ICMJE uniform disclosure form (available at http://dx.doi.org/10.21037/tcr-21-749). The authors have no conflicts of interest to declare.
(English Language Editor: B. Draper)
References
- 1.Anastasiadi Z, Lianos GD, Ignatiadou E, et al. Breast cancer in young women: an overview. Updates Surg 2017;69:313-7. 10.1007/s13304-017-0424-1 [DOI] [PubMed] [Google Scholar]
- 2.Balasubramanian R, Rolph R, Morgan C, et al. Genetics of breast cancer: management strategies and risk-reducing surgery. Br J Hosp Med (Lond) 2019;80:720-5. 10.12968/hmed.2019.80.12.720 [DOI] [PubMed] [Google Scholar]
- 3.Perou CM, Sørlie T, Eisen MB, et al. Molecular portraits of human breast tumours. Nature 2000;406:747-52. 10.1038/35021093 [DOI] [PubMed] [Google Scholar]
- 4.Schoonjans K, Staels B, Auwerx J. The peroxisome proliferator activated receptors (PPARS) and their effects on lipid metabolism and adipocyte differentiation. Biochim Biophys Acta 1996;1302:93-109. 10.1016/0005-2760(96)00066-5 [DOI] [PubMed] [Google Scholar]
- 5.Takahashi N, Goto T, Kusudo T, et al. The structures and functions of peroxisome proliferator-activated receptors (PPARs). Nihon Rinsho 2005;63:557-64. [PubMed] [Google Scholar]
- 6.Jiang Y, Zou L, Zhang C, et al. PPARgamma and Wnt/beta-Catenin pathway in human breast cancer: expression pattern, molecular interaction and clinical/prognostic correlations. J Cancer Res Clin Oncol 2009;135:1551-9. 10.1007/s00432-009-0602-8 [DOI] [PubMed] [Google Scholar]
- 7.Ikezoe T, Miller CW, Kawano S, et al. Mutational Analysis of the Peroxisome Proliferator-activated Receptor γ Gene in Human Malignancies. Cancer Res 2001;61:5307. [PubMed] [Google Scholar]
- 8.Stephen RL, Gustafsson MC, Jarvis M, et al. Activation of peroxisome proliferator-activated receptor delta stimulates the proliferation of human breast and prostate cancer cell lines. Cancer Res 2004;64:3162-70. 10.1158/0008-5472.CAN-03-2760 [DOI] [PubMed] [Google Scholar]
- 9.Liao W, Liu W, Yuan Q, et al. Silencing of DLGAP5 by siRNA significantly inhibits the proliferation and invasion of hepatocellular carcinoma cells. PLoS one 2013;8:e80789-e. [DOI] [PMC free article] [PubMed]
- 10.Zhang X, Pan Y, Fu H, et al. Nucleolar and Spindle Associated Protein 1 (NUSAP1) Inhibits Cell Proliferation and Enhances Susceptibility to Epirubicin In Invasive Breast Cancer Cells by Regulating Cyclin D Kinase (CDK1) and DLGAP5 Expression. Med Sci Monit 2018;24:8553-64. 10.12659/MSM.910364 [DOI] [PMC free article] [PubMed] [Google Scholar]
- 11.Kwei KA, Kung Y, Salari K, et al. Genomic instability in breast cancer: pathogenesis and clinical implications. Mol Oncol 2010;4:255-66. 10.1016/j.molonc.2010.04.001 [DOI] [PMC free article] [PubMed] [Google Scholar]
- 12.Chan HL, Beckedorff F, Zhang Y, et al. Polycomb complexes associate with enhancers and promote oncogenic transcriptional programs in cancer through multiple mechanisms. Nat Commun 2018;9:3377. 10.1038/s41467-018-05728-x [DOI] [PMC free article] [PubMed] [Google Scholar]
- 13.Chen JR, Chien HP, Chen KS, et al. Amplification of HER2 and TOP2A and deletion of TOP2A genes in a series of Taiwanese breast cancer. Medicine 2017;96:e5582. 10.1097/MD.0000000000005582 [DOI] [PMC free article] [PubMed] [Google Scholar]
- 14.Nielsen KV, Müller S, Møller S, et al. Aberrations of ERBB2 and TOP2A genes in breast cancer. Mol Oncol 2010;4:161-8. 10.1016/j.molonc.2009.11.001 [DOI] [PMC free article] [PubMed] [Google Scholar]
- 15.Rody A, Karn T, Ruckhäberle E, et al. Gene expression of topoisomerase II alpha (TOP2A) by microarray analysis is highly prognostic in estrogen receptor (ER) positive breast cancer. Breast Cancer Res Treat 2009;113:457-66. 10.1007/s10549-008-9964-x [DOI] [PubMed] [Google Scholar]
- 16.Sun J, Huang J, Lan J, et al. Overexpression of CENPF correlates with poor prognosis and tumor bone metastasis in breast cancer. Cancer Cell Int 2019;19:264-. 10.1186/s12935-019-0986-8 [DOI] [PMC free article] [PubMed] [Google Scholar]
- 17.Landberg G, Erlanson M, Roos G, et al. Nuclear autoantigen p330d/CENP-F: a marker for cell proliferation in human malignancies. Cytometry 1996;25:90-8. [DOI] [PubMed] [Google Scholar]
- 18.Lawson CD, Der CJ. Filling GAPs in our knowledge: ARHGAP11A and RACGAP1 act as oncogenes in basal-like breast cancers. Small GTPases 2018;9:290-6. 10.1080/21541248.2016.1220350 [DOI] [PMC free article] [PubMed] [Google Scholar]
- 19.Zhao WM, Fang G. MgcRacGAP controls the assembly of the contractile ring and the initiation of cytokinesis. Proc Natl Acad Sci U S A 2005;102:13158-63. 10.1073/pnas.0504145102 [DOI] [PMC free article] [PubMed] [Google Scholar]
- 20.Liang WH, Li N, Yuan ZQ, et al. DSCAM-AS1 promotes tumor growth of breast cancer by reducing miR-204-5p and up-regulating RRM2. Mol Carcinog 2019;58:461-73. 10.1002/mc.22941 [DOI] [PubMed] [Google Scholar]
- 21.Giordano A, Liu Y, Armeson K, et al. Polo-like kinase 1 (Plk1) inhibition synergizes with taxanes in triple negative breast cancer. PLoS one 2019;14:e0224420. 10.1371/journal.pone.0224420 [DOI] [PMC free article] [PubMed] [Google Scholar]
- 22.Jeong SB, Im JH, Yoon JH, et al. Essential Role of Polo-like Kinase 1 (Plk1) Oncogene in Tumor Growth and Metastasis of Tamoxifen-Resistant Breast Cancer. Mol Cancer Ther 2018;17:825-37. 10.1158/1535-7163.MCT-17-0545 [DOI] [PubMed] [Google Scholar]
- 23.Horvath S, Zhang B, Carlson M, et al. Analysis of oncogenic signaling networks in glioblastoma identifies ASPM as a molecular target. Proc Natl Acad Sci U S A 2006;103:17402-7. 10.1073/pnas.0608396103 [DOI] [PMC free article] [PubMed] [Google Scholar]


