Abstract
Background
To explore the clinical value of energy spectrum curves of dual-energy computer tomography (CT) in quantitative evaluation of different pathological grades of gastric adenocarcinoma.
Methods
A total of 62 patients with 36 poorly, 25 moderately and 1 well differentiated gastric adenocarcinomas confirmed pathologically were collected. Dual-energy CT plain and enhanced scanning were undergone before operation. Dual-Energy software was used to measure the slope of the energy spectrum curves (λ) in arterial and venous phases (VPs) after image reconstruction. Patients were divided into two groups according to the pathological results, including well and moderately differentiated gastric adenocarcinoma group and poorly differentiated gastric adenocarcinoma group. Data of each group were analyzed by independent sample t-test. Receiver operating characteristic curve (ROC) was used to evaluate the diagnostic efficiency of the corresponding parameters.
Results
There were significant differences in λ values of 40–50, 40–60, 40–80, 40–90, 40–100, 40–120, 40–130, 40–140 and 40–150 keV energy ranges in VP between the well and moderately differentiated group and poorly differentiated group (P<0.05), but no significant differences in λ values of different energy ranges in arterial phase (AP) between the two groups (P>0.05). And the area under curve in 40–120 keV energy range was the largest in VP. λ40–120keV=2.69 was selected as the diagnostic threshold with the maximum Youden index, the sensitivity and specificity were 61.1% and 76%, respectively.
Conclusions
The energy spectrum curve of dual-energy CT had certain diagnostic value in the quantitative evaluation of pathological grading of gastric adenocarcinoma.
Keywords: Computer tomography (CT), dual energy, energy spectrum curve, gastric adenocarcinoma, pathology
Introduction
Gastric cancer is the most common malignant tumor of digestive tract with the third highest mortality rate among cancer-related mortality rates (1). There are about 1 million new-onset cases of gastric cancer every year. There are regional differences in survival and prognosis of patients with gastric cancer, mainly due to differences in staging criteria. Accurate diagnosis of cancer staging and pathological differentiation is of great significance to the formulation of individualized treatment and prognosis of gastric cancer (2-4). The clinical diagnosis of gastric cancer is mainly based on gastroscopy and a definite diagnosis of the pathological differentiation degree of gastric adenocarcinoma mainly depends on postoperative pathological examinations. However, some advanced patients who cannot tolerate surgery and gastroscopy were failed to make a definite diagnosis of the degree of pathological differentiation. Therefore, it is of great clinical significance to actively explore non-invasive preoperative imaging methods to evaluate the pathological differentiation degree of gastric cancer tissues, and to provide more diagnostic basis and decision-making reference for clinical treatment.
Computer tomography (CT) staging and endoscopic ultrasonography (EUS) staging of gastric cancer were independently classified by the Alliance Against Cancer and the 8th edition American Joint Committee on Cancer (AJCC) TNM staging system (5-7). In clinical practice, CT examination has become the main means of T staging of gastric cancer before treatment because of its simplicity, rapidity and objective image advantages (8). Dual-source CT uses two sets of independent tube detector systems, which can simultaneously obtain the data of substances under high and low energy X-ray, and obtain the attenuation data of substances on X-ray under different energies. Quantitative parameters acquired from spectral imaging data based on dual-energy CT have proven to be useful for the diagnosis and staging of gastric cancer (9,10). The purpose of this study was to explore the clinical value of energy spectrum curve of dual-source CT in the quantitative evaluation of gastric adenocarcinoma with different degrees of differentiation. We present the following article in accordance with the STARD reporting checklist (available at http://dx.doi.org/10.21037/tcr-20-1269).
Methods
Patients
The study was conducted in accordance with the Declaration of Helsinki (as revised in 2013). The retrospective study was approved by institutional ethics board of Putian First Hospital of Fujian Province {No. [2019]006} and the informed consent was waived. One hundred thirty-four patients with gastric adenocarcinoma pathologically confirmed by surgery in our hospital from May 2019 to September 2019 were collected. Seventy-three patients were enrolled consecutively according to the following inclusion criteria: (I) patients undergo surgery after routinely dual-source dual-energy CT scans, with complete clinical data, pathological results; (II) interval shorter than 1 week between dual-source CT scan and surgery; (III) no radiotherapy, chemotherapy and other anti-cancer treatments were performed before enhanced CT scanning; (IV) scanning mode and imaging parameters are in accordance with the unified standard, and iodine contrast agents of the same manufacturer and concentration are used. Of the 73 retrieved patients, 11 were subsequently excluded for the exclusion criteria: (I) distant metastasis or no surgical indication; (II) suboptimal image quality for interpretation or image acquired from other institutions; (III) patients with poor gastric filling and poor lesion display. Finally, a total of 62 cases of gastric adenocarcinoma were included, including 46 males and 16 females (range, 33–86 years; mean age, 65.41±9.73 years). The patients were divided into three groups according to differentiation status: well, moderately and poorly differentiation. Of the 62 gastric adenocarcinomas, one was well differentiated adenocarcinoma, 25 were moderately differentiated adenocarcinomas and 36 were poorly differentiated adenocarcinomas (Figure 1).
Figure 1.
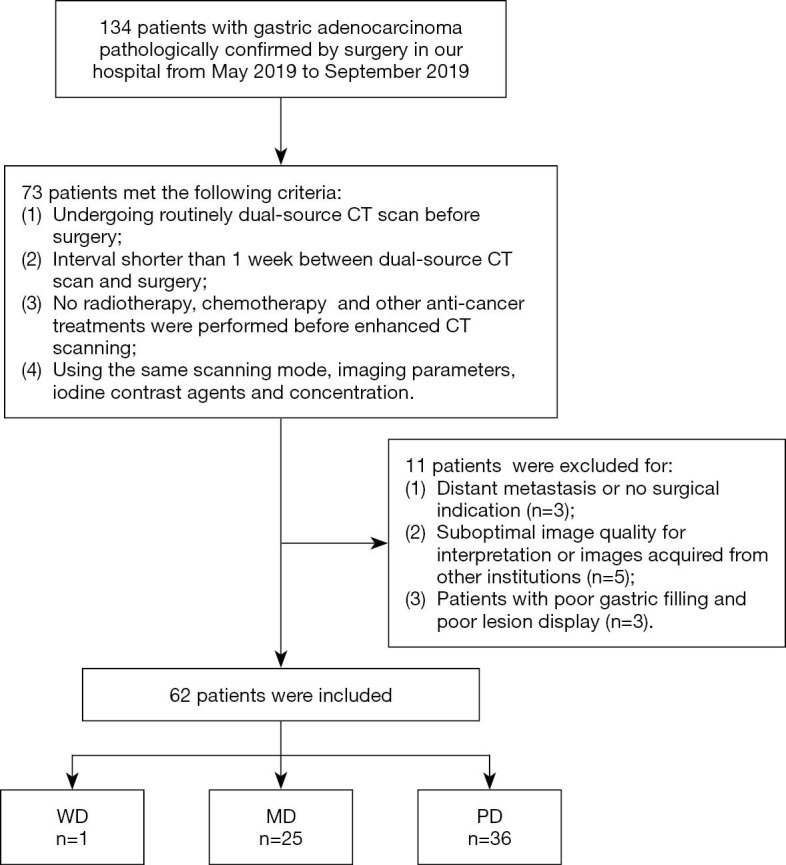
Flow diagram shows inclusion and exclusion criteria for the study. WD, well differentiated; MD, moderately differentiated; PD, poorly differentiated.
Dual-source CT scan
Dual-source dual-energy CT scanner SOMATOM Force was used. Routine plain scanning covering the entire stomach region was performed firstly for each patient in a supine position, followed by three-phase enhanced scanning by using dual-energy mode, including arterial phase (AP), venous phase (VP) and delayed phase. During enhanced scanning, a high-pressure syringe was used to inject 370 mg I/mL iopromide (1.2 mL/kg), a non-ionic contrast agent, into the antecubital vein (Ultravist, Bayer Healthcare Co., Ltd.) at a rate of 2.5–3.5 mL/s, subsequently 20 mL of saline was injected at the same rate. The automatic trigger mode was adopted in dynamic contrast-enhanced scanning, when the CT value reached 100 Hu, the AP scanning was triggered automatically. The VP and delayed phase scanning was performed 60 seconds, 180 seconds respectively after the contrast agent administration. Scanning ranged from the diaphragmatic dome to the inferior pole of kidney and all the images were archived digitally. Scans were captured during a single breath-hold with the following parameters: (I) A-tube voltage 100 kV, B-tube voltage Sn150 kV; (II) field of view (FOV) 356 mm × 356 mm; (III) pitch 0.7; (IV) tube rotation time 0.5 s/r; (V) convolution kernel Br40; (VI) reconstruction section thickness of 1 mm and slice gap 0 mm. Real-time dynamic exposure dose control (Care Dose 4D, Siemens Medical Solutions) technology was used for all data acquisition.
Quantitative Dual-Energy CT parameters
Post-processing was performed on the Dual-Energy workstation. A rounded region of interest (ROI) about 0.2–0.4 cm2 drew by two radiologists. And it was put on the largest slice of tumor lesions which was the most obvious enhancement area, avoiding necrosis, calcification, blood vessel as much as possible. After tracing out the ROI, the system automatically generated a scatter plot and a spectral curve. The following information was extracted from each lesion: Hounsfield unit (HU) at each X-ray beam value between 40 and 150 keV (with steps of 10 keV).
The slope of the spectral HU curve (λ, in HU per kiloelectron-volt), which means the difference between the CT value at two different energy divided by the energy difference, was calculated. For instance, as follows:
| [1] |
where HU40keV represents the CT value measured on 40 keV images and similarly HU150keV were obtained based on 150 keV images. Totally, 11 λ values were acquired from a spectrum curve, details are provided in Tables 1,2. λ values were captured from both arterial and VP in contrast-enhanced images.
Table 1. λ values of well and moderately differentiated and poorly differentiated gastric adenocarcinoma in arterial phase in different energy ranges.
| λ | WD and MD GA | PD GA | t | P |
|---|---|---|---|---|
| 40–50 keV | 4.0978±2.01483 | 4.6807±1.2686 | –1.378 | 0.171 |
| 40-60 keV | 3.3263±1.6202 | 3.7188±0.9935 | –1.172 | 0.246 |
| 40-70 keV | 2.69443±1.3323 | 3.0797±0.8343 | –1.389 | 0.17 |
| 40-80 keV | 2.3029±1.1202 | 2.5988±0.70188 | –1.268 | 0.21 |
| 40-90 keV | 1.9747±0.9617 | 2.231±0.6105 | –1.274 | 0.208 |
| 40-100 keV | 1.7206±0.8384 | 1.9413±0.5279 | –1.262 | 0.212 |
| 40-110 keV | 1.5227±0.7440 | 1.7313±0.4647 | –1.348 | 0.183 |
| 40-120 keV | 1.3582±0.6635 | 1.5521±0.4166 | –1.402 | 0.166 |
| 40-130 keV | 1.2378±0.5956 | 1.4007±0.3770 | –1.308 | 0.196 |
| 40-140 keV | 1.1175±0.5481 | 1.2736±0.3434 | –1.368 | 0.177 |
| 40-150 keV | 1.0115±0.5023 | 1.1542±0.3280 | –1.343 | 0.184 |
WD, well differentiated; MD, moderately differentiated; PD, poorly differentiated; GA, gastric adenocarcinoma; λ, the slope of energy spectrum curve.
Table 2. λ values of well and moderately differentiated and poorly differentiated gastric adenocarcinoma in venous phase in different energy ranges.
| λ | WD and MD GA | PD GA | t | P |
|---|---|---|---|---|
| 40–50 keV | 7.466±1.9516 | 8.9568±2.2822 | –2.658 | 0.01 |
| 40–60 keV | 5.9964±1.5829 | 7.1988±1.8393 | –2.655 | 0.01 |
| 40–70 keV | 4.900±1.3037 | 5.6482±1.6540 | –1.889 | 0.064 |
| 40–80 keV | 4.1523±1.0860 | 4.9932±1.2838 | –2.675 | 0.01 |
| 40–90 keV | 3.5598±0.9392 | 4.1900±1.1579 | –2.34 | 0.023 |
| 40–100 keV | 3.1077±0.8229 | 3.7401±0.9581 | –2.682 | 0.009 |
| 40–110 keV | 2.7370±0.7368 | 3.1490±0.9494 | –1.905 | 0.062 |
| 40–120 keV | 2.4587±0.6541 | 3.0527±0.8234 | –3.006 | 0.004 |
| 40–130 keV | 2.2281±0.6046 | 2.6726±0.6860 | –2.61 | 0.011 |
| 40–140 keV | 2.0236±0.5393 | 2.3792±0.6439 | –2.263 | 0.027 |
| 40–150 keV | 1.8364±0.5055 | 2.2391±0.5824 | –2.8 | 0.007 |
WD, well differentiated; MD, moderately differentiated; PD, poorly differentiated; GA, gastric adenocarcinoma; λ, the slope of energy spectrum curve.
Statistical analysis
SPSS 22.0 software was used for statistical analysis. According to the pathological results, the patients were divided into two groups, including well and moderately differentiated gastric adenocarcinoma group and poorly differentiated gastric adenocarcinoma group. Measurement data were expressed by mean ± standard deviation. The intraclass correlation coefficient (ICC) was used to assess interobserver agreement. For data conforming to normal distribution, t-test was used for homogeneous variance; corrected t-test was used for heterogeneity of variance. The receiver operating characteristic (ROC) curve was drawn, the area under curve (AUC) was calculated, and diagnostic efficiency of each index was analyzed. P<0.05 was considered as significant difference.
Results
Clinical data
Of the 62 patients, there were 26 cases of well and moderately differentiated gastric adenocarcinomas, including 22 males with an average age of 67.33±7.26 years, and 4 females with an average age of 65.50±13.92 years; there were 36 cases of poorly differentiated adenocarcinoma, including 24 males with an average age of 64.88±8.59 years, and 12 females with an average age of 63.08±14.11 years. No significant differences were found in age and gender between the two groups. The dose length product (DLP) of patients was 605.81±11.52 mGy*cm.
Comparison of λ values between the well and moderately differentiated group and poorly differentiated group
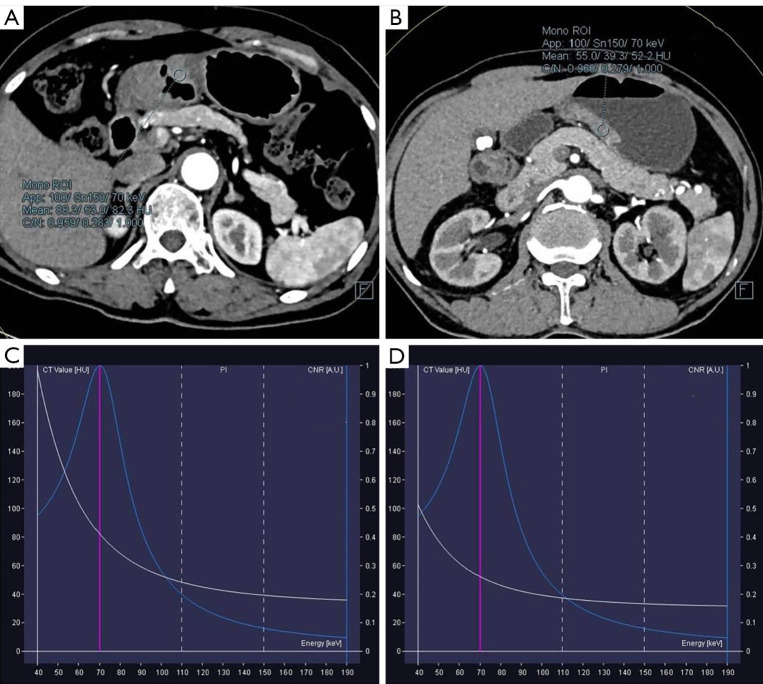
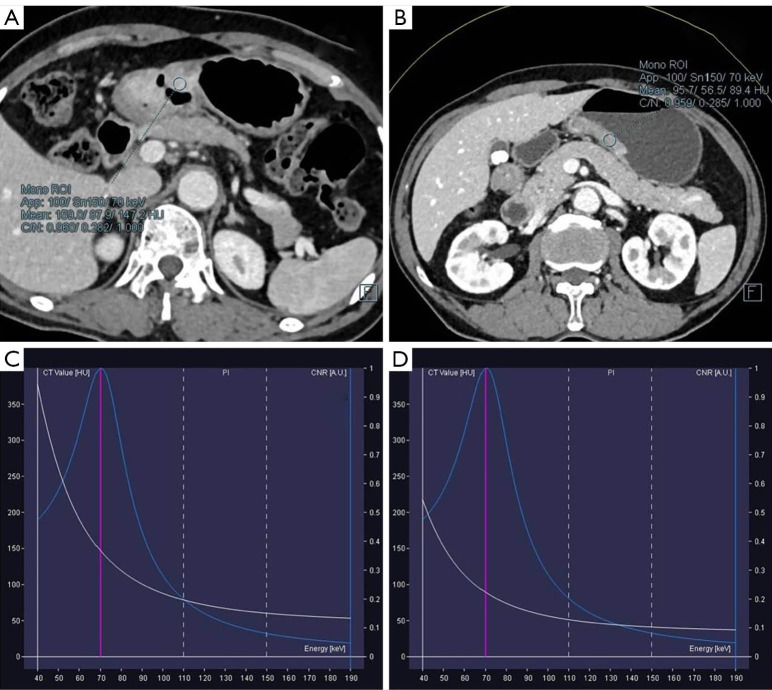
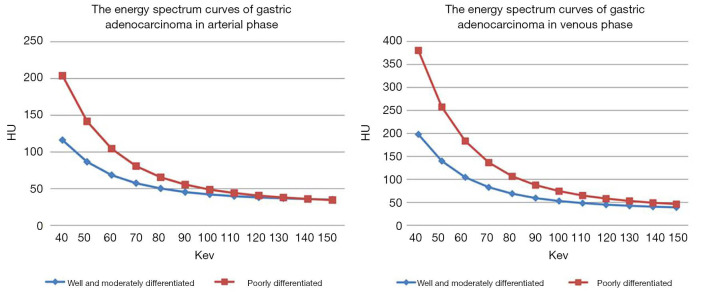
According to observation and comparison, it can be seen that energy spectrum curves of all gastric adenocarcinomas in APs (Figure 2) and VPs (Figure 3) were descending. The curves in 40–110 keV energy range varied greatly and those in 110–190 keV energy range tended to be flat in arterial and VPs (Figure 4).
Figure 2.
Patient with poorly differentiated gastric adenocarcinoma (A) and moderately differentiated gastric adenocarcinoma (B) which show the location of ROI in arterial phase. And the corresponding energy spectrum curves of poorly (C) and moderately (D) differentiated gastric adenocarcinoma were displayed.
Figure 3.
Patient with poorly differentiated gastric adenocarcinoma (A) and moderately differentiated gastric adenocarcinoma (B) in venous phase whose location of ROI was same to the arterial phase. And the corresponding energy spectrum curves of poorly (C) and moderately (D) differentiated gastric adenocarcinoma were displayed.
Figure 4.
The results showed that the energy spectrum curve of poorly differentiated gastric adenocarcinoma is higher than that of moderately differentiated gastric adenocarcinoma in arterial phase (A) and venous phase (B).
The λ values of poorly differentiated gastric adenocarcinoma group in AP were higher than those of well and moderately differentiated gastric adenocarcinoma group in different energy ranges, but the difference between the two groups was not significant (Table 1). The λ values of well and moderately differentiated gastric adenocarcinoma group in VP were lower than those of poorly differentiated gastric adenocarcinoma group in different energy ranges: there were significant differences in λ values of 40–50, 40–60, 40–80, 40–90, 40–100, 40–120, 40–130, 40–140 and 40–150 keV energy ranges (P<0.05 for all), but no significant difference in λ values of 40–70 and 40–110 keV energy ranges (Table 2). The ICC of λ values evaluated by two radiologists was all >0.9.
ROC curve analysis
The ROC curves were plotted with the λ values of 40–50, 40–60, 40–80, 40–90, 40–100, 40–120, 40–130, 40–140 and 40–150 keV energy ranges in VP. The corresponding AUCs were 0.668, 0.669, 0.633, 0.671, 0.693, 0.667, 0.634 and 0.681, respectively (Figure 5). The AUC of λ value in 40–120 keV energy range was the largest in VP, even though there was no significant difference (P>0.05). λ40-120keV =2.69 was selected as the diagnostic threshold with the maximum Youden index, the sensitivity and specificity were 61.1% and 76.0%, respectively.
Figure 5.
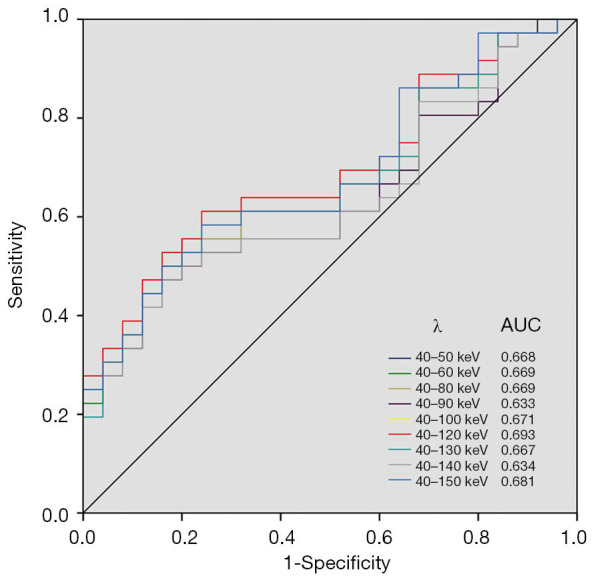
AUCs of ROC curve analysis in different energy ranges in venous phase. The AUC in λ of 40–120 keV energy range is largest.
Discussion
As we all known, the clinical diagnosis of gastric cancer is mainly based on gastroscopy, and the degree of pathological differentiation mainly depends on postoperative pathological examinations, but there were differences in biological behavior, chemotherapy sensitivity (11) and neoadjuvant therapy sensitivity among different differentiated types of gastric adenocarcinoma. Therefore, evaluating the differentiated types of gastric adenocarcinoma before operation, chemotherapy or neoadjuvant therapy has certain clinical significance for individualized treatment and precise treatment of patients. In the present study, dual-source CT scanning technology was used to explore the energy spectrum curve of different energy ranges in evaluating the pathological differentiation of gastric adenocarcinoma, which had important practical significance and clinical value in guiding clinical diagnosis, treatment and prognosis evaluation.
Lesions are showed by conventional CT scanning due to the difference of CT values mostly. Although it can clearly show the location, size, shape, density and enhancement characteristics of the lesions, it has limited ability to differentiate and diagnose substances (12). Dual-source CT scanning can simultaneously obtain the data of substances under high and low energy X-ray, obtain the attenuation data of substances under different energies, and form the energy spectrum curve of substances. The energy spectrum curve is that the CT value of ROI varies with the change of photon energy, the average CT value and standard deviation in each energy range from 40 to 190 keV can be obtained on the energy spectrum curve, which reflects the attenuation characteristics and dynamic changes of substances in different energy ranges (13). Because the energy spectrum curves of different substances show differences, differences of the energy spectrum curves in different tissue sources, characteristics and components can be estimated, which enables the differential diagnosis. It can be inferred that the energy spectrum curve can be used to differentiate the origin of tumors, benign and malignant tumors, and tumors with different differentiation degrees, moreover, the energy spectrum curve can be quantitatively analyzed to provide new diagnostic ideas (14,15).
In the present study, the slope of energy spectrum curve of poorly differentiated gastric adenocarcinoma in VP were significantly higher than those of well and moderately differentiated gastric adenocarcinoma in 40–50, 40–60, 40–80, 40–90, 40–100, 40–120, 40–130, 40–140 and 40–150 keV energy ranges, and the diagnostic efficiency was the highest in 40–120 keV energy range. Previous studies on blood perfusion in gastric cancer showed that the vascular permeability-surface value of undifferentiated gastric cancer was higher than that of differentiated gastric cancer (16), the lower the degree of differentiation, the higher the blood volume. In this study, the slope of energy spectrum curve of gastric adenocarcinoma lesions with poorer differentiation was higher, and there was a negative correlation, which indirectly proved that with the decrease of pathological differentiation of gastric cancer, the local enhancement of the lesions and the iodine contrast agent of local tumors increased. It further confirmed the feasibility and reliability of the energy spectrum curve of dual-energy CT imaging in evaluating gastric adenocarcinoma with different degrees of differentiation.
In our study, there were no significant differences in λ values of 40–50, 40–60, 40–70, 40–80, 40–90, 40–100, 40–110, 40–120, 40–130, 40–140, 40–150 keV energy ranges in AP and 40–70, 40–110 keV energy ranges in VP between well and moderately and poorly differentiated gastric adenocarcinoma, which was inconsistent with the results of Tang et al. (17) that the difference of the slope of the spectral curve in 40–70 keV energy range between the two gastric adenocarcinoma groups in arterial and VPs was statistically significant. We believed that the deviation of this result may be due to the use of different machines, scanning schemes and contrast agents, which needed further studies in the future.
There were still some limitations in this study: (I) selection bias is inevitable due to the retrospective nature of the study, although we set strict inclusion and exclusion criteria. (II) This study mainly investigated gastric adenocarcinoma, which can not reflect differences of other pathological types of gastric cancer (such as gastric signet ring cell carcinoma, gastric squamous cell carcinoma, mucinous gastric carcinoma and so on) with moderately and poorly differentiated adenocarcinoma.
In conclusion, the energy spectrum curve of dual-energy CT in different energy ranges had certain clinical significance in evaluating gastric adenocarcinoma with different degrees of differentiation.
Acknowledgments
Funding: This study has received funding by Special Fund of Fujian Provincial Department of Finance (CN) (Award Number: BPB-lym2019).
Ethical Statement: The authors are accountable for all aspects of the work in ensuring that questions related to the accuracy or integrity of any part of the work are appropriately investigated and resolved. The study was conducted in accordance with the Declaration of Helsinki (as revised in 2013). The retrospective study was approved by institutional ethics board of Putian First Hospital of Fujian Province {No. [2019]006} and the informed consent was waived.
Footnotes
Reporting Checklist: The authors have completed the STARD reporting checklist. Available at http://dx.doi.org/10.21037/tcr-20-1269
Data Sharing Statement: Available at http://dx.doi.org/10.21037/tcr-20-1269
Conflicts of Interest: All authors have completed the ICMJE uniform disclosure form (available at http://dx.doi.org/10.21037/tcr-20-1269). The authors have no conflicts of interest to declare.
References
- 1.Ferlay J, Soerjomataram I, Dikshit R, et al. Cancer incidence and mortality worldwide: sources, methods and major patterns in GLOBOCAN 2012. Int J Cancer 2015;136:E359-86. 10.1002/ijc.29210 [DOI] [PubMed] [Google Scholar]
- 2.Kim JP, Lee JH, Kim SJ, et al. Clinicopathologic characteristics and prognostic factors in 10 783 patients with gastric cancer. Gastric Cancer 1998;1:125-33. 10.1007/s101200050006 [DOI] [PubMed] [Google Scholar]
- 3.Wang Z, Xu J, Shi Z, et al. Clinicopathologic characteristics and prognostic of gastric cancer in young patients. Scand J Gastroenterol 2016;51:1043-9. 10.1080/00365521.2016.1180707 [DOI] [PubMed] [Google Scholar]
- 4.Zu H, Wang H, Li C, et al. Clinicopathologic characteristics and prognostic value of various histological types in advanced gastric cancer. Int J Clin Exp Pathol 2014;7:5692-700. [PMC free article] [PubMed] [Google Scholar]
- 5.In H, Solsky I, Palis B, et al. Validation of the 8th Edition of the AJCC TNM Staging System for Gastric Cancer using the National Cancer Database. Ann Surg Oncol 2017;24:3683-91. [DOI] [PubMed] [Google Scholar]
- 6.Li Z, Wang Y, Shan F, et al. ypTNM staging after neoadjuvant chemotherapy in the Chinese gastric cancer population: an evaluation on the prognostic value of the AJCC eighth edition cancer staging system. Gastric Cancer 2018;21:977-87. [DOI] [PubMed] [Google Scholar]
- 7.Lu J, Zheng CH, Cao LL, et al. The effectiveness of the 8th American Joint Committee on Cancer TNM classification in the prognosis evaluation of gastric cancer patients: A comparative study between the 7th and 8th editions. Eur J Surg Oncol 2017;43:2349-56. [DOI] [PubMed] [Google Scholar]
- 8.Yang L, Shi G, Zhou T, et al. Quantification of the Iodine Content of Perigastric Adipose Tissue by Dual-Energy CT: A Novel Method for Preoperative Diagnosis of T4-Stage Gastric Cancer. PLoS One 2015;10:e0136871. 10.1371/journal.pone.0136871 [DOI] [PMC free article] [PubMed] [Google Scholar]
- 9.Li J, Fang M, Wang R, et al. Diagnostic accuracy of dual-energy CT-based nomograms to predict lymph node metastasis in gastric cancer. Eur Radiol 2018;28:5241-9. 10.1007/s00330-018-5483-2 [DOI] [PubMed] [Google Scholar]
- 10.Pan Z, Pang L, Ding B, et al. Gastric cancer staging with dual energy spectral CT imaging. PLoS One 2013;8:e53651. 10.1371/journal.pone.0053651 [DOI] [PMC free article] [PubMed] [Google Scholar]
- 11.Hallinan JT, Venkatesh SK. Gastric carcinoma: imaging diagnosis, staging and assessment of treatment response. Cancer Imaging 2013;13:212-27. 10.1102/1470-7330.2013.0023 [DOI] [PMC free article] [PubMed] [Google Scholar]
- 12.Lin XZ, Wu ZY, Tao R, et al. Dual energy spectral CT imaging of insulinoma-Value in preoperative diagnosis compared with conventional multi-detector CT. Eur J Radiol 2012;81:2487-94. 10.1016/j.ejrad.2011.10.028 [DOI] [PubMed] [Google Scholar]
- 13.Karcaaltincaba M, Aktas A. Dual-energy CT revisited with multidetector CT: review of principles and clinical applications. Diagn Interv Radiol 2011;17:181-94. [DOI] [PubMed] [Google Scholar]
- 14.Wei J, Zhao J, Zhang X, et al. Analysis of dual energy spectral CT and pathological grading of clear cell renal cell carcinoma (ccRCC). PLoS One 2018;13:e0195699. 10.1371/journal.pone.0195699 [DOI] [PMC free article] [PubMed] [Google Scholar]
- 15.Yin Q, Zou X, Zai X, et al. Pancreatic ductal adenocarcinoma and chronic mass-forming pancreatitis: Differentiation with dual-energy MDCT in spectral imaging mode. Eur J Radiol 2015;84:2470-6. 10.1016/j.ejrad.2015.09.023 [DOI] [PubMed] [Google Scholar]
- 16.Liang P, Ren XC, Gao JB, et al. Iodine Concentration in Spectral CT: Assessment of Prognostic Determinants in Patients With Gastric Adenocarcinoma. AJR Am J Roentgenol 2017;209:1033-8. 10.2214/AJR.16.16895 [DOI] [PubMed] [Google Scholar]
- 17.Tang H, Deng K, Zhao Y, et al. Use of computed tomography gemstone spectral curve in evaluation on histodifferentiation of gastric cancer. Zhonghua Yi Xue Za Zhi 2014;94:3571-4. [PubMed] [Google Scholar]


