Abstract
Background
Differentiated thyroid cancer (DTC) is the most common thyroid tumor, and the cells of DTC patients can lose the ability to differentiate in their natural state or during treatment and develop radioiodine-refractory DTC (RAI-R DTC), resulting in increased malignancy. Monocarboxylate transporter-1 (MCT1) is positively correlated with the level of malignant of various tumors, and its expression in RAI-R DTC cells is correlated with their biological cell traits.
Methods
Data from 14 iodine-refractory thyroid carcinoma patients were collected, and the effective radioiodine treatment group was used as the control group. The expression of MCT1 in iodine-refractory thyroid carcinoma and its effect on biological behaviors was observed and the molecular mechanism underlying RAI-R DTC was investigated to determine the cause of the loss of sensitivity of DTC to radioactive iodine using Immunohistochemical staining, Western blot, transwell assay, wound healing assay, flow cytogram assay.
Results
Compared to radioiodine-sensitive DTC (RAI-DTC), which was responded to iodine treatment, MCT1 was highly expressed in RAI-R DTC cells. The overexpression or inhibition of MCT1 altered the biological characteristics of papillary thyroid carcinoma (TPC-1) cells. The overexpression of MCT1 in TPC-1 cells increased the invasive, proliferative, and migratory abilities of the cells. Conversely, the downregulation of MCT1 decreased the invasive, proliferative and migratory abilities of the cells.
Conclusions
The expression of MCT1 was enhanced in RAI-R DTC cells. MCT1 appears to be closely related to the invasive metastasis of RAI-R DTC cells, and it may be the cause of the loss of the iodine uptake ability of RAI-R DTC.
Keywords: Monocarboxylate transporter-1 (MCT1), iodine-refractory differentiated thyroid cancer (DTC), invasion, metastasis
Introduction
Thyroid cancer is the most common malignant tumor of the endocrine system and the head and neck system. Differentiated thyroid cancer (DTC), which has a thyroid follicular cell origin, accounts for 95% of all thyroid cancer (1). DTC treatment is performed in three steps: surgical resection, radioactive iodine therapy, and thyroid stimulating hormone (TSH) suppression therapy. Most patients have a favorable prognosis after the standard treatment. Radioactive iodine therapy, which can remove residual surgical lesions and distant metastasis, plays an important role in DTC treatment. Most patients are effectively treated with radioactive iodine, however, clinical observations have revealed that some patients with lesions are insensitive to or unable to intake radioactive iodine, which results in the lesions becoming more malignant and a poor therapeutic effect. Radioiodine-refractory DTC (RAI-R DTC) (1) refers to a type of DTC that has lost the ability to intake iodine. Monocarboxylate transporter-1 (MCT1) is a member of the monocarboxylate transporter (MCT) family of proteins that are mainly involved in lactate transport across membranes (2). Studies have confirmed that MCT1 is positively correlated to the malignancy of various tumors (2). MCT1 regulates the activity of signaling pathways and controls the exchange of monocarboxylates in aerobic glycolysis to affect tumor metabolism, proliferation and invasion. Thus, MCT1 may be associated with the malignant biological behavior of RAI-R DTC and the de-differentiation of metastatic lesions; however, this has yet to be confirmed by experiments.
The sodium/iodide symporter (NIS) is an “iodine pump” in the basement membrane of thyroid follicular cells, which takes iodine ions into the thyroid gland and participates in the synthesis of thyroxine. This study investigated the relationship between MCT1 and the biological behavior of papillary thyroid carcinoma (TPC-1), and the mechanism by which MCT1 affects the transport of iodine ions by NIS to determine the reason for the insensitivity of RAI-R DTC to iodine treatment. This study sought to examine the relationship between changes in the expression of MCT1 and the clinicopathological characteristics of RAI-R DTC by taking RAI-R DTC as clinical specimens, and applying cell isolation and cultivation, morphology, and molecular biology techniques. The results of this study provide a strong foundation for the further elucidation of the molecular mechanism underlying the expression changes of MCT1 and the malignant biological behaviors of RAI-R DTC cells and their de-differentiation, and it also provides an experimental foundation for identifying novels targets for the clinical treatment of RAI-R DTC and the development of new drugs. We present the following article in accordance with the MDAR reporting checklist (available at https://dx.doi.org/10.21037/tcr-21-2417).
Methods
Cases and inclusion criteria
The data of 45 patients with papillary thyroid cancer, who had received at least two treatments with Iodine-131(131I) at our hospital, were collected. The median follow-up time after the initial treatment (i.e., treatment with 131I after total thyroidectomy) was 30.3 months. In addition to their clinical information, the following information about patients was collected: gender, the size of the primary lesions, clinical stage, lymph node and distant metastasis sites, imaging data, and data from patients’ medical records. The DTC patients were divided into a RAI-R DTC group and a radioiodine-sensitive DTC (RAI-DTC) group according to the definition of radioiodine-refractory in the 2015 American Thyroid Association Management Guidelines for Adult Patients with Thyroid Nodules and Differentiated Thyroid Cancer: The American Thyroid Association Guidelines Task Force on Thyroid Nodules and Differentiated Thyroid Cancer.
RAI-R DTC group
Fourteen iodine-refractory patients who met the criteria were selected.
Control RAI-DTC group
The control group comprised 31 RAI-DTC patients.
Inclusion criteria
To be eligible for inclusion in this study, patients had to have a (pathologically confirmed) diagnosis of TPC or follicular carcinoma after total thyroidectomy, and had to have undergone two treatments with 131I.
Exclusion criteria
Patients with medullary thyroid carcinoma or papillary thyroid microcarcinoma who did not require 131I treatment were excluded from this study.
Diagnosis criteria of metastasis
A diagnosis of DTC metastasis was made if any one of the following criteria was met and the primary tumor at the metastatic site was excluded by other examinations: (I) DTC metastasis was confirmed by pathology results after puncture or surgery; (II) a whole-body scan (WBS) with 131I suggested distant metastasis, and an elevated thyroglobulin (Tg) level and at least 1 imaging examination of X-ray, computed tomography (CT), magnetic resonance imaging (MRI), or positron emission tomography (PET) suggested metastasis; (III) the results of the WBS with 131I were negative, and the Tg level was elevated, and the results of at least 1 fluorodeoxyglucose-PET (FDG-PET), CT, or MRI imaging examination were positive.
Judgment basis for effective isotope therapy
There are two types of effective radioactive iodine treatment: cure and improvement. Cure refers to the disappearance of both primary and metastatic lesions during a WBS and auxiliary imaging 2–7 days after the administration of iodine 131I, and suppressive Tg levels below 2 ng/mL. Improvement refers to a reduction in the size and number of metastases and a decrease in Tg levels.
RAI-R DTC criteria
The criteria for a diagnosis of RAI-R DTC criteria were as follows: (I) the metastases never had an excessive intake of iodine (i.e., there was no iodine intake outside the first diagnostic or/and therapeutic WBS thyroid bed area); (II) the metastases initially took up iodine but then lost the ability to take up iodine (i.e., there was no sustained iodine uptake); and (III) the cancer continues to progress and the Tg levels continue to rise despite significant iodine uptake.
Main reagents
This study acquired the following instruments and reagents: immunohistochemistry kit (ZSGB-BIO SP-9001), Rever Tre Ace-a-reverse transcription kit (TOYOBO Inc.), Rever Tre Ace-a-reverse transcription kit (TOYOBO Inc.), Transwell chambers (Corning Incorporation, USA), and Apoptosis detection kit (Beyotime). The human papillary thyroid cancer cell line (TPC-1) was obtained by Shanghai Cell Bank, Chinese Academy of Sciences.
Experimental methods
Immunohistochemical staining
After the clinical pathology specimens were successfully collected during surgery, they were immediately fixed with 4% paraformaldehyde, wrapped in paraffin wax, and made into wax blocks; the various specimens were marked. The selected pathological tissue specimens were frozen and sectioned, dewaxed, and hydrated, and the disposed specimens were configured in a standard antigen repair solution of Ethylene Diamine Tetraacetic Acid (EDTA) (PH =8.0) for antigen repair. Finally, antibody incubation was performed, and the slides were then dehydrated and sealed after staining. A Lycra microscope was used to make observations and take photographs, and the optical density values were measured to evaluate the staining results of the various specimens.
Papillary TPC-1 cell cultures
The cells were removed from the liquid nitrogen tank and placed in water. The mixture was stirred continuously to make cells dissolve rapidly. The cell suspension culture was then transferred to the cell culture flasks, supplemented with 4 mL of 10% fetal bovine serum (FBS) complete medium, and put into the cell culture incubator. Once the cell density was observed to be about 90% under the microscope, it was used for passaging. The cell suspension culture was divided equally into two cell culture flasks, supplemented with 10% FBS complete medium for each 5 mL per flask, and put into the cell culture incubator for cultivation. The cell suspension culture (3ml) was divided into 3 freezing tubes equally, and frozen at 4 °C for 30 min, −20 °C for 30 min, and −80 °C overnight respectively, a liquid nitrogen tank awaiting subsequent experiments.
Grouping and transfection of TPC-1 cells
The deoxyribonucleic acid (DNA) transfected mixture was added into per well and mixed gently, and the system was placed into the incubator. The mixture was transfected for 6 h, and the cells were then taken out, and the original transfection solution was removed. Next, 2 mL of complete medium was added to each well, and the mixture was placed into the incubator for 24–72 h. The samples were collected according to the purpose of the subsequent assay. Based on the different transfected plasmids, the TPC-1 cells were divided into a non-transfected group (the normal culture), a negative control group (the negative control transfection culture), a MCT1-sh-RNA group (the suppression culture), and a pcDNA3.1-MCT1 group (the overexpression culture).The MCT1 inhibition assay experiments were divided into 3 TPC-1 groups (i.e., the normal group, the negative control group, and the MCT1-sh-RNA inhibition group).
Cell invasion experiment
For each experimental of TPC-1 group (i.e., the normal group, the negative control group, and the pcDNA3.1-MCT1 overexpression group), the cells that were transfected 1 day before were taken out and digested. After digestion, the culture medium was discarded by centrifugation, washed twice with phosphate buffered solution (PBS), and resuspended in a serum-free medium. The density was adjusted to 5×10⁵/mL. The cell suspension culture was taken and added to the Transwell chambers. The complete medium was added to the lower chamber of the 24-well plate, which was placed in the incubator for cultivating. The Transwell chambers were taken out after 24 h. The culture medium in the hole was discarded and washed twice with PBS, and then fixed with 4% paraformaldehyde for 30 min. The chambers were taken out and washed in PBS twice, stained with 0.1% crystal violet for 2 min, and then washed twice with PBS. The upper layer of the unmigrated cells was gently wiped off using a cotton swab. The glycerol seal was removed from the membrane of the chamber by a scalpel blade, and photographs were taken.
Cell streaking experiment
For each experimental of TPC-1 group (i.e., the normal group, the negative control group, and the pcDNA3.1-MCT1 overexpression group), the cells that had been transfected 1 day before were taken out. First, uniform lines crossing the hole were drawn on the back of a 6-well plate with a marker pen and a ruler (at least 5 crossing lines per well were drawn). According to different group, TPC-1 (i.e., the normal group, control group, and MCT1 interference group) the cells were inoculated into a 6-well culture plate. After 24 h of cell adhesion, the cells were observed under a microscope and observed to be spreading all over the culture plate. The tip of the gun was streaked vertically (without any tilt) across the behind line along with the straightedge; the cells were washed with PBS 3 times so that the scraped cells were removed. A medium containing 1% FBS was added to the mixture, and it was placed into a 37 °C, 5% carbon dioxide (CO2) incubator for cultivating. Photographs were taken at 0 and 24 h.
Cell apoptosis experiment
For each experimental of TPC-1 group (i.e., the normal group, the negative control group, and the pcDNA3.1-MCT1 overexpression group), the cells that had been transfected 1 day before were taken out. The cells were digested and collected in centrifuge tubes. The tubes were centrifuged at 1,000 rmp for 3–5 min to precipitate the cells. The cells were then gently resuspended by PBS and counted. For example, in 1 sample, 50–100,000 resuspended cells were taken and centrifuged at 1,000 rmp for 5 minutes. The supernatant solution was then discarded, and 195 µL Annexin V-FITC conjugate was added to gently resuspend the cells. Annexin V-FITC was also added and mixed gently. Next, 10 µL propidium iodide staining solution was added and mixed gently. The mixture was incubated at room temperature (20–25 °C) for 10–20 min without light, and it was then placed in an ice bath. The cells were stained as soon as possible after the flow cytometric assay, and the flow cytometric results were analyzed.
Cell cycle experiment
For each experimental of TPC-1 group (i.e., the normal group, the negative control group, and the pcDNA3.1-MCT1 overexpression group), the transfected cells were collected in the centrifuge tube, and the cells were centrifuged at 1,000 rmp for 3–5 min and precipitated. About 1 mL of ice bath pre-cooled PBS was added to the tube. The cells were then resuspended and transferred to a 1.5-mL centrifuge tube. Next, the cells were re-centrifuged and precipitated. Ice bath pre-cooled 70% ethanol was then added and mixed well with gentle blowing and fixing at 4 °C for 30 min or longer. The cells were centrifuged at 1,000 rmp for 3–5 min and precipitated. About 1 mL of pre-cooled PBS was added to an ice bath, and the cells were resuspended. The cells were re-centrifuged and precipitated, and then dispersed by gently bouncing the bottom of the centrifuge tube to prevent the cells from clumping. The propidium iodide staining solution was prepared in accordance with the instructions in the kit. Specifically, the appropriate amount of propidium iodide staining solution was prepared according to the number of samples to be tested. About 0.5 mL of propidium iodide staining solution was added to each tube of cell samples. The cells were resuspended and precipitated slowly and adequately, and then stored in a warm bath at 37 °C for 30 min without light and then subsequently, at 4 °C or in an ice bath away from light. After the completion of the staining, flow detection was completed within 24 hours. The red fluorescence at an excitation wavelength of 488 nm and light scattering status were detected by a flow cytometer. The cellular DNA content analysis and light scattering analysis was performed using the appropriate analysis software.
Statistical processing
Univariate and multifactorial regression analyses were performed according to age, gender, the pathological grading of patients, the presence of lymph node metastasis, and the sensitivity of 131I treatment. GraphPad Prism software was used for the data analysis in this study. The measurement data are expressed as the mean ± standard deviation (). One-way analysis of variance was used for comparisons among multiple groups. The t-test was used for comparisons between two groups. P value <0.05 was considered statistically significant.
Ethical statement
All procedures performed in this study involving human participants were in accordance with the Declaration of Helsinki (as revised in 2013). The study was approved by institutional ethics board of Chongqing University Central Hospital/Chongqing Emergency Medical Center (approval No. 2019-120) and informed consent was taken from all the patients.
Results
Comparison of patients with iodine-refractory DTC in relation to different clinical and pathological characteristics
For this study, we extracted the clinicopathological information of all patients with papillary thyroid cancer from a public data platform database, and analyzed the relationship between age, gender, mass size, lymph node metastasis and disease stage in iodine-refractory patients. The results revealed that there was no direct relationship between iodine-refractory papillary thyroid cancer and gender or age (P>0.05), but there was a correlation between mass size, disease stage, and lymph node metastasis site (P<0.05). The analysis showed that the larger the mass, the more advanced the lymph node stage, and the more lymph node metastases, the more likely it was that the cells would lose differentiation (see Table 1).
Table 1. Clinicopathological information of patients with papillary thyroid cancer.
| Item | Number of cases | Number of cases with loss of differentiation | χ2 value | P value |
|---|---|---|---|---|
| Gender | 0.461 | 0.497 | ||
| Male | 13 | 5 | ||
| Female | 32 | 9 | ||
| Age (years) | 0.353 | 0.553 | ||
| <45 | 13 | 5 | ||
| ≥45 | 32 | 9 | ||
| Clinical stage | 7.106 | 0.008 | ||
| I–II | 26 | 4 | ||
| III–IV | 19 | 10 | ||
| Lymph node metastasis | 11.029 | 0.001 | ||
| Anterior lymph node metastasis only | 23 | 2 | ||
| Regional lymph node metastasis | 22 | 12 | ||
| Size of mass (cm) | 11 | 0.001 | ||
| ≤2 | 26 | 3 | ||
| >2 | 19 | 11 |
MCT1 immunohistochemistry
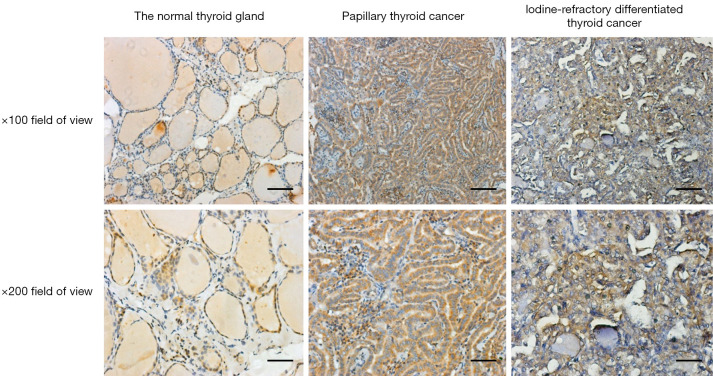
The experimental results confirmed that MCT1 was expressed in both normal thyroid tissues and thyroid cancer tissues. MCT1 was weakly expressed in the cytoplasm of cells in the normal thyroid group. Conversely, in thyroid cancer and iodine-refractory thyroid carcinoma tissues, MCT1 was mainly expressed in the cytoplasm and nucleus of the tumor cells. The results of the image analysis demonstrated that the expression of MCT1 was significantly higher in iodine-refractory TPC tissues than normal thyroid tissues (P<0.05), and was also significantly higher in iodine-refractory thyroid carcinoma tissues than DTC tissues (P<0.05) (see Figure 1 and Table 2).
Figure 1.
H&E staining of MCT1 in each group ×100 and ×200. Bars: top line =50 µm; bottom line =25 µm. MCT1, monocarboxylate transporter-1.
Table 2. IOD values of MCT1 in each group ().
| Groups | MCT1 |
|---|---|
| Normal thyroid gland | 34.87±3.36 |
| Papillary thyroid cancer | 42.9±7.5 |
| Iodine-refractory DTC cancer | 54.48±9.76 |
IOD, integrated optical density; DTC, differentiated thyroid cancer
Western blot of MCT1
The Western blot results demonstrated that MCT1 and NIS bands were visible in all groups of TPC-1 cells. The band analysis and statistical results demonstrated that compared to the control group, after transfection with short hairpin ribonucleic acid (sh-RNA) to interfere with MCT1 expression, the expression of MCT1 in the transfected group was significantly lower than that in the control and non-transfected groups (P<0.05), and the expression of NIS (SLC9A1) in the sh-RNA transfected group was significantly higher than that of the control and non-transfected groups (P<0.05; see Figures 2,3). After plasmid pcDNA3.1 was transfected to generate the overexpression of MCT1, the expression of MCT1 in the transfected group was significantly higher than that of the control group and non-transfected group (P<0.05), and the expression of NIS (SLC9A1) in the MCT1 overexpressed group was significantly lower than that of the control group and the non-transfected group (P<0.05; see Figures 4,5).
Figure 2.
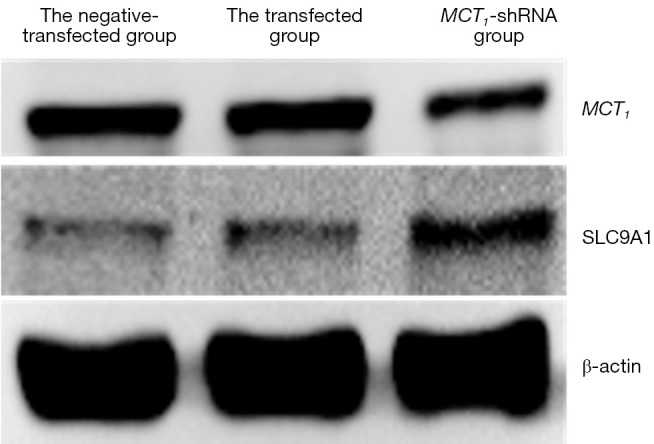
The expression of MCT1 and NIS in each group of TPC-1 cells after Western blot detection of sh-RNA interference. MCT1, monocarboxylate transporter-1; NIS, sodium/iodide symporter.
Figure 3.
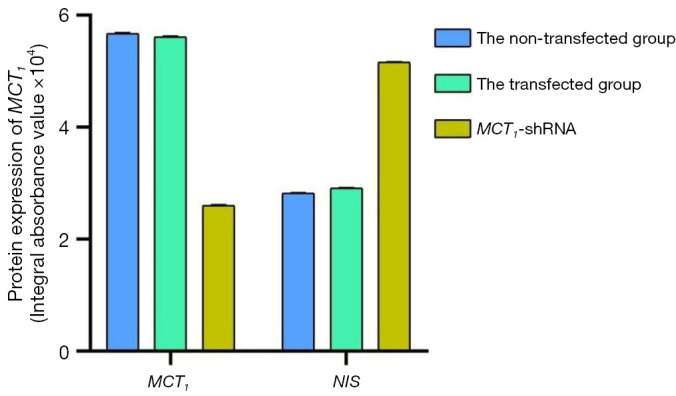
Expression of MCT1 and NIS in each group of TPC-1 cells after sh-RNA interference. MCT1, monocarboxylate transporter-1; NIS, sodium/iodide symporter.
Figure 4.
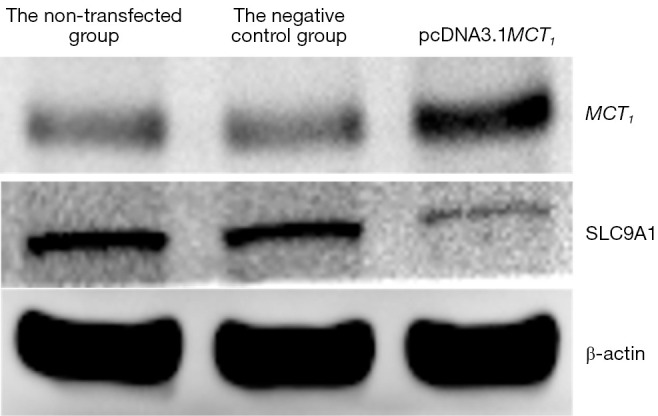
Western blot detection of MCT1 and NIS expression in each group of TPC-1 cells after the transfection of plasmid pcDNA3.1. MCT1, monocarboxylate transporter-1.
Figure 5.
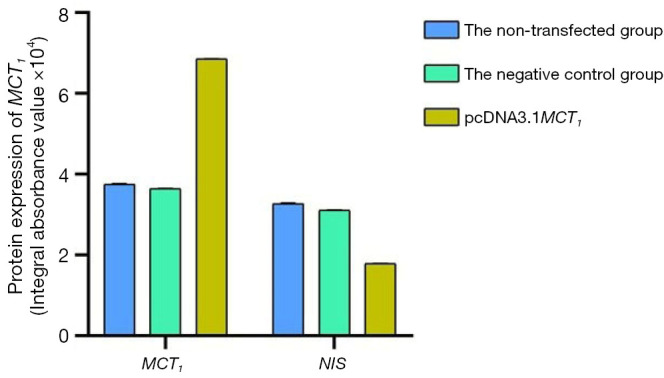
The expression of MCT1 and NIS in each group after the transfection of plasmid pcDNA3.1. NIS, sodium/iodide symporter.
The results of these experiments indicated that the sodium-iodine exchanger signaling pathway was negatively correlated with the high expression of MCT1. The higher the expression of MCT1, the greater the inhibition of the cellular signaling pathway of NIS, and the lower cellular ability to transport iodine.
Changes in the biological activity of cells after the downregulation of MCT1
MCT1 inhibits papillary thyroid cancer cells and causes cell cycle arrest
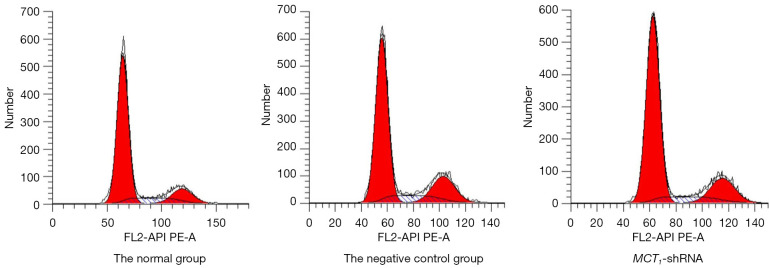
After the TPC-1 cells were transfected with sh-RNA plasmid, changes in cell proliferation levels were verified, and the results showed that the transfected PTC-1 cells increased the number of cells in the GO/C1 phase after 48 h of culture (i.e., the cell cycle arrest of PTC-1 occurred in the CO/G1 phase) (see Figure 6). Thus, the inhibition of MCT1 expression was shown to inhibit the proliferation of PTC-1 cells and cause cell cycle arrest, which had the effect of a cancer suppressor.
Figure 6.
Flow cytogram of cell cycles between groups.
The flow cytometry results demonstrated that the percentage of PTC-1 cells in the negative control group were not statistically significant (P>0.05) compared to that of the non-transfected group, but the percentage of PTC-1 cells in the G0/G1 phase was significantly higher in the MCT1-siRNA (small interfering RNA, siRNA) group compared to the control group, while the percentage of PTC-1 cells in the S phase was significantly lower than the control group (P<0.05; see Table 3).
Table 3. Comparison of the cell cycle distribution between groups.
| Groups | N | G0/G1 | S | G2/M |
|---|---|---|---|---|
| Normal group | 3 | 43.87±6.36 | 26.5±5.6 | 29.63±5.81 |
| Negative control group | 3 | 42.9±7.5a | 23.13±6.61a | 33.97±4.23 |
| MCT1-sh-RNA group | 3 | 68.23±9.76b | 11.6±5.61b | 20.17±6.32 |
“a” indicates a P>0.05 compared to the normal group; “b” indicates a P<0.05 compared to the normal group.
Interfering with MCT1 expression inhibits the streaking healing of PTC-1 cells
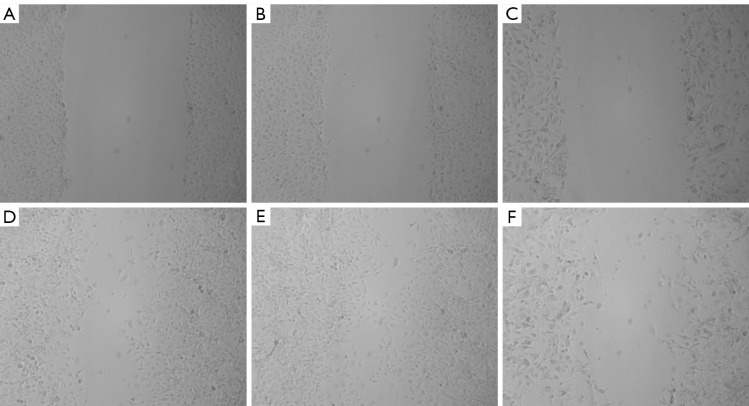
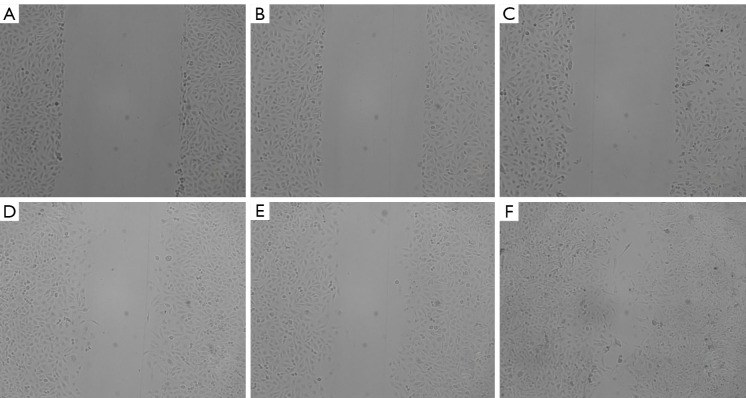
The results of the streaking experiments showed that the migration ability of TPC-1 cells was significantly inhibited after sh-RNA transfection interfered with MCT1 expression, and the streaking healing rate of cells in the 24-hour MCT1-sh-RNA group (59.76%±11.26%) was significantly lower than that in the normal group (69.8%±7.2%) and the negative control group (59.05%±10.13%) (P<0.05; see Figure 7).
Figure 7.
The results of the streaking healing assay in PTC-1 cells after interfering with MCT1 expression. (A-C) 0 h; (D-F) (A) and (D) normal group at 24 h, (B) and (E) negative control group, (C) and (F) MCT1-sh-RNA (×100). MCT1, monocarboxylate transporter-1.
Interfering with MCT1 expression promotes the apoptosis of PTC-1 cells
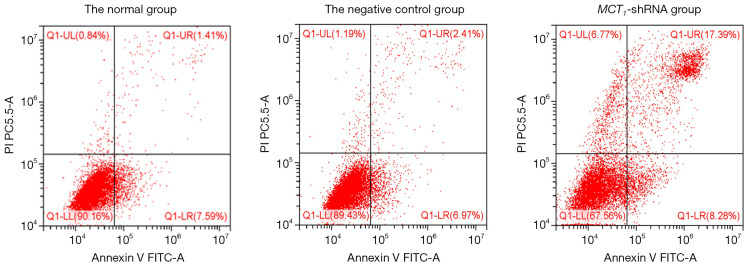
The results of the cell apoptosis assay showed that the apoptosis rate of TPC-1 cells after sh-RNA transfection interfered with MCT1 expression was significantly higher (16.23%±0.26%) than the normal group (1.59%±0.12%) and the negative control group (2.98%±0.13%) (P<0.05; see Figure 8).
Figure 8.
The cell apoptosis rate of U118 MG cells in each group detected by flow cytometry.
Downregulating the expression of MCT1 reduces the invasiveness of PTC-1 cells
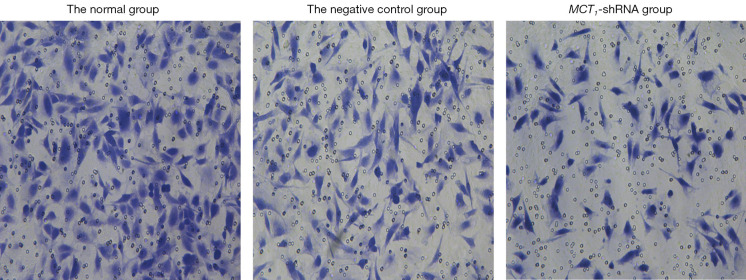
The invasive effect of TPC-1 cells was decreased by downregulating the expression of MCT1. Compared to the normal and negative control groups, the number of invasive cells decreased after sh-RNA transfection interfered with MCT1 expression (P<0.05). Thus, downregulating the expression of MCT1 reduced the invasive ability of TPC-1 cells (see Figures 9,10).
Figure 9.
The effect of inhibiting MCT1 on cellular invasiveness (crystal violet staining, ×400). MCT1, monocarboxylate transporter-1.
Figure 10.
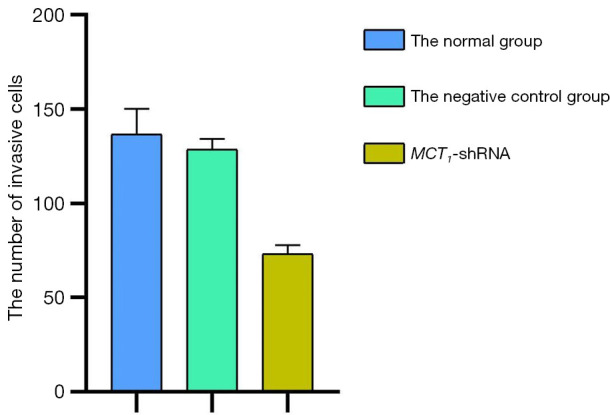
Quantization Histogram showing the effect of inhibiting MCT1 on cellular invasiveness. MCT1, monocarboxylate transporter-1.
The overexpression of MCT1 changes the biological activity of cells
The inhibition of MCT1 inhibits the proliferation and migration invasion ability of TPC-1 cells. To increase the persuasion and preciseness of our data, the effect of MCT1 overexpression on the proliferation, invasion, and migration ability of TPC-1 cells was further investigated. Specifically, we transfected the TPC-1 cells with the overexpression plasmid and compared them with empty and normal cultured TPC-1 cells. First, a Western blot analysis confirmed that the protein expression level of MCT1 was increased in the MCT1 overexpression group. Additionally, as expected, the opposite trend was found in the MCT1 knockout group. The subsequent correlation experiments further confirmed that the overexpression of MCT1 in TPC-1 cells enhanced TPC-1 cell’s migration, proliferation, and invasion abilities.
The overexpression of MCT1 promotes TPC-1 cell proliferation
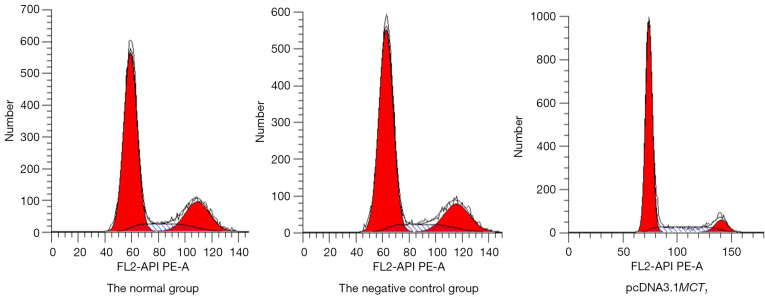
The results of the flow cytometry cell cycle analysis showed that the number of overexpressing MCT1 in TPC-1 cells lingering in the G0/G1 phase was significantly reduced, and cell cycle arrest was not observed. The flow cytometry results also demonstrated that the percentages of the PTC-1 cells in different phases in the negative control group were not significantly different to those of the normal non-transfected group (P>0.05), but the percentages of pcDNA3.1-MCT1 PTC-1 cells in the G0/G1 phase were reduced in the overexpression group, while the percentages in the S phase and G2 phase were significantly increased (P<0.05). Thus, the upregulation of MCT1 promoted the proliferation of TPC-1 cell line (see Figure 11 and Table 4).
Figure 11.
Flow cytogram of the cell cycle in the MCT1 overexpression group. MCT1, monocarboxylate transporter-1.
Table 4. Comparison of the cell cycle distribution of MCT1 overexpression between the groups.
| Groups | N | G0/G1 | S | G2/M |
|---|---|---|---|---|
| Normal group | 3 | 68±5.24 | 11.23±3.56 | 20.72±3.12 |
| Negative control group | 3 | 70.24±3.5 | 10.13±5.69a | 18.17±3.96a |
| MCT1-sh-RNA group | 3 | 76.03±5.42 | 14.98±6.52b | 8.19±6.32b |
“a” indicates a P>0.05 compared to the normal group; “b” indicates a P<0.05 compared to the normal group.
MCT1 overexpression promotes streaking healing in PTC-1 cells
The results of the streaking assay demonstrated that the migration ability of the TPC-1 cells was significantly enhanced after pcDNA3.1 transfection with MCT1 overexpression, and the streaking healing rate of cells in the 24-hour MCT1-sh-RNA group (79.01%±1.91%) was significantly higher than that in the normal group (43.7%±5.739%) and the negative control group (43.53%±2.544%) (P<0.05; see Figure 12).
Figure 12.
Streaking healing assay results of PTC-1 cells after MCT1 overexpression. (A-C) 0 h; (D-F) (A) and (D) normal group at 24 h, (B) and (E) negative control group, (C) and (F) pcDNA3.1-MCT1 (×100). MCT1, monocarboxylate transporter-1.
Upregulating the expression of MCT1 reduces the apoptosis of PTC-1 cells
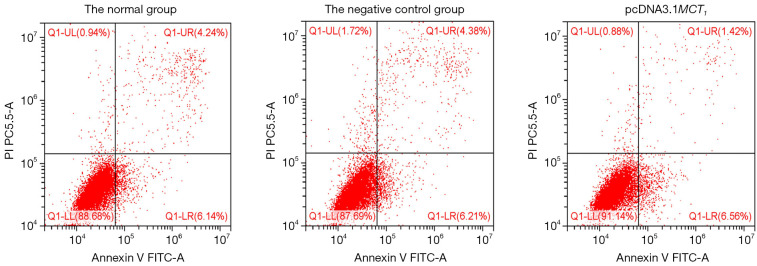
The results of the cell apoptosis assay demonstrated that the apoptosis rate of the TPC-1 cells after upregulating the expression of MCT1 was significantly (1.39%±0.26%) lower in the transfected group than that of the normal group (4.06%±0.12%) and the negative control group (3.95%±0.23%) (P<0.05; see Figure 13).
Figure 13.
Apoptosis assay results of PTC-1 cells after MCT1 overexpression. MCT1, monocarboxylate transporter-1.
Upregulating the expression of MCT1 increases the invasiveness of PTC-1 cells
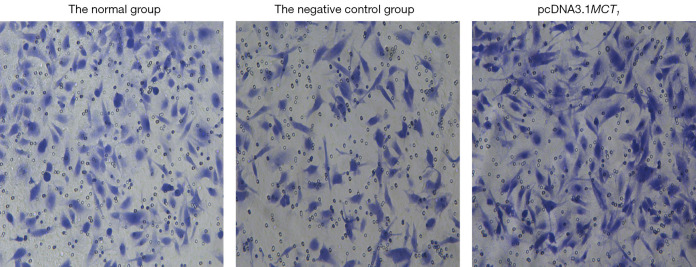
The invasive effect of TPC-1 cells was increased by upregulating the expression of MCT1. Compared to the normal group and the negative control group, the number of invasive cells increased after upregulating the expression of MCT1 (P<0.05). Thus, upregulating the expression of MCT1 increased the invasive ability of the TPC-1 cells (see Figures 14,15).
Figure 14.
Effect of upregulating MCT1 on cellular invasiveness (crystal violet staining, ×400). MCT1, monocarboxylate transporter-1.
Figure 15.
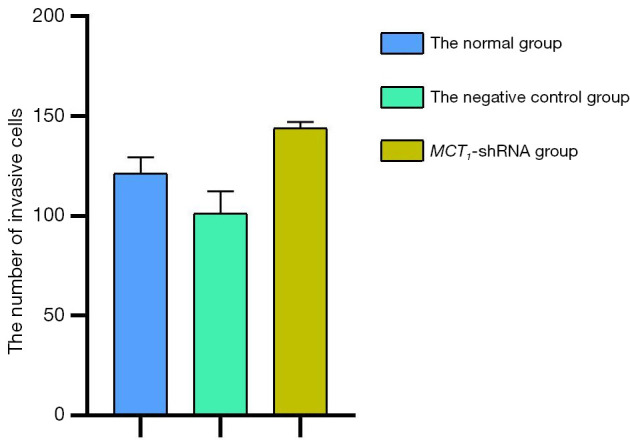
Quantization Histogram showing the effect of upregulating MCT1 on cellular invasiveness. MCT1, monocarboxylate transporter-1.
Discussion
Thyroid cancer is the most common malignant tumor of the endocrine system and the head and neck system. DTC accounts for more than 90% of all thyroid cancer pathologies (1). The prognosis of patients with DTC is generally good with conventional treatment (surgical resection and postoperative therapy with 131I and endocrine suppression therapy). The 10-year survival rate of such patients can reach more than 90% (3), and some patients even survive for a long time without symptoms (4). However, clinical observations have revealed that following conventional treatment, a proportion of patients have poor treatment outcomes and a poor prognosis. In-depth studies have found that most of these patients have distant metastatic lesions that are insensitive to radioiodine therapy (1). Patients with distant metastasis of DTC and a loss of iodine uptake have so-called RAI-R DTC (1).
Based on a WBS with other imaging methods after iodine treatment (under the condition of appropriate TSH and in preparation for treatment with 131I), patients with RAI-R DTC can be classified into 1 of the following four categories: (I) the metastases never had an excessive intake of iodine (i.e., there was no iodine intake outside the first diagnostic or/and therapeutic WBS thyroid bed area); (II) the metastases initially took up iodine but then lost the ability to take up iodine (i.e., there was no sustained iodine uptake). This often occurs due to the presence of multiple large metastases, the elimination of differentiated cells that take in iodine, and a failure to eliminate cells that do not take iodine in a poorly differentiated state; and (III) some metastases have the ability to take up iodine, but others do not. In this case, a comparison of 18F-FDG-PET/CT imaging and a radioiodine WBS is required to detect the metastases, which are commonly observed in patients with multiple large metastases. Metastases that do not take in iodine are likely to progress, and patient prognosis cannot be improved even after radioactive iodine treatment; and (IV) the cancer continues progressing and Tg levels continue to rise despite significant iodine uptake. The definition of iodine-refractory DTC is met if any of the above diagnostic criteria are met (5).
It has been clinically observed that the lesions of RAI-R DTC patients often have an increased degree of malignancy, increased tumor aggressiveness, and a decreased sensitivity to both radiotherapy and chemotherapy compared to other thyroid cancer patients, and thus a poorer prognosis. To date, the molecular mechanism of iodine resistance in patients with RAI-R DTC has been unclear. Thus, this study sought to clarify whether the molecular mechanism of iodine resistance in patients with RAI-R DTC has important theoretical significance and clinical application value for the individualized diagnosis and treatment of RAI-R DTC patients.
Most previous studies on the mechanism of iodine resistance in RAI-R DTC have focused on the NIS, which is an “iodine pump” present in the basement membrane of thyroid follicular cells that actively transports iodine to the thyroid gland, resulting in a 20- to 40-fold higher iodine concentration than in plasma (6,7). It is believed that the iodine resistance of RAI-R DTC is mainly caused by the decrease of NIS, and many cells that promote iodine resistance by increasing the expression of NIS protein in cells increase their iodine uptake capacity. However, there are still various issues. First, some scholars transfected the NIS gene or thyroid-specific transcription factor 1 (TTF-1) and Paired box 8 (PAX-8) gene into thyroid cancer cells, and while this could promote the iodine uptake of the cells, the rapid outflow of the uptaken 131I (8,9), and the retention time of 131I in the cells is too short to kill the tumor cells in the tumor-bearing animals. Second, some scholars have also used drugs, such as vincristine and troglitazone (10,11), to upregulate NIS expression, and while this could only improve the iodine uptake ability of some cells, it also fails to solve the problem that thyroid cancer cells have a stable increase in iodine uptake. Thus, the upregulation of TTF-1 and PAX-8 gene does not appear to effectively solve the problem of iodine resistance in patients with RAI-R DTC. Thus, the authors believe that it is necessary to find novel ways to explore the molecular mechanism underlying iodine resistance in RAI-R DTC patients to determine the real reason for the decrease of NIS iodine uptake, and enable novel targets for the treatment of patients to be identified.
MCTs are channel proteins located in the cell membrane that are responsible for the transport of monocarboxylic acids, such as lactate and H+, across the membrane. In addition to monocarboxylic acid transport, MCTs play an important role in catalyzing the transport of monocarboxylic acids, such as lactate, a product of glycolysis, and in the regulation of intracellular pH. To date, the more in-depth studies on the members of the MCTs gene family are MCT1 and MCT2. MCT1 is mainly involved in the transmembrane transport of lactate. Malignant tumor cells often show a large increase in glucose uptake and select glycolysis as the main mode of Adenosine triphosphate (ATP) production even under aerobic conditions (the Warburg effect) (12). The Warburg effect is accompanied by an excessive intracellular production of lactate, which needs to be excreted from the cell via MCTs (mainly MCT1). Studies have confirmed that MCT1 is highly expressed in all tumors and is positively correlated with the pathological grade of the tumor. De Saedeleer et al. found that MCT1 can promote lactate entry into tumor cells for cellular respiration and also induce tumor angiogenesis and enhance invasiveness by promoting vascular endothelial cell migration in various human tumor cell lines (13). Some scholars have confirmed that the inhibition of the glycolytic process can reverse Adriamycin resistance and radiotherapy tolerance in breast cancer and other tumors (14). The authors also confirmed previously that MCT1 is positively correlated with the pathological grade of invasive ductal carcinoma of the breast. However, the lesions of patients with RAI-R DTC displayed increased malignancy and tumor aggressiveness. Thus, we hypothesized that MCT1 is associated with invasiveness, distant metastatic ability, and tumor iodine resistance in RAI-R DTC. The inhibition of MCT1 may also inhibit the development of distant metastasis of RAI-R DTC cells and their iodine resistance. However, this hypothesis needs to be tested in future experiments.
The question arises as to what kind of mechanism allows MCT1 to interfere with the uptake of radioactive iodine by NIS. The authors believe that energy acquisition in tumor cells is mainly achieved by anaerobic glycolysis, and this metabolic feature inevitably leads to an increase in the production of lactic acid and other acidic substances in tumor cells, which results in the acidification of the intracellular environment (15). However, compared to normal cells, the pH in tumor cells is higher, and the intracellular environment can even reach neutral or alkalescent. Cells always tend to maintain intracellular pH within a certain physiological range, which is essential for physiological processes, such as cell growth and differentiation, intracellular enzyme activity, and cytoskeleton assembly and depolymerization. As MCT1 transports large amounts of lactic acid out of cells, it inevitably causes a large amount of H+ outflow, accompanied by a large amount of Na+ outflow. The realization of ion exchange is regulated by the ion transporter on the cell membrane: Na+/H+ exchange (NHE) is an important ion transporter NHE can pump out the H+ produced by tumor cells for hypermetabolism to reverse the pH gradient inside and outside tumor cells and form an external acidic and internal alkaline local microenvironment. Additionally, the intracellular alkaline environment is conducive to cell metabolism and promotes tumor cell proliferation, while the extracellular acidic microenvironment is also able to significantly enhance the infiltrative metastatic ability of tumor cells (16). In the presence of NHE, extracellular Na+ reduces. However, the uptake of iodine ions by thyroid cells cannot be separated from the cotransport of Na+. In the presence of Na+, anions can be co-transported by NIS in the following order: I– ≥ SeCN– > SCN– > ClO4– > NO3–. Na+ and anions are transported simultaneously at a 2:1 ratio (17). Thus, a decrease in extracellular Na+ inevitably leads to a decrease in the co-transportation of anions. Further, a decrease in the cellular uptake of iodine results in a greater likelihood of cellular iodine resistance. Consequently, the reduced iodine uptake capacity of NIS in response to the combined effect of MCT1 and NHE may also be responsible for the iodine resistance of DTC cells.
In this study, the clinical specimens and cultured cells of RAI-R DTC were taken as research objects, and the correlations between changes in MCT1 expression and iodine resistance of RAI-R DTC and its biological behaviors were studied using cell isolation, culture, morphology, and molecular biology techniques. The results of this study demonstrated that MCT1 is highly expressed in RAI-R DTC cells. Further, the inhibition of MCT1 expression decreased the invasiveness, migration ability, and proliferation ability of papillary thyroid cancer cells, while the overexpression of MCT1 produced the opposite results. Thus, if MCT1 is positively correlated with the invasiveness and distant metastatic ability of RAI-R DTC and is the cause of the decreased iodine uptake ability of RAI-R DTC, than the inhibition of MCT1 expression should improve the iodine uptake ability of RAI-R DTC, which could provide an experimental basis for finding novel targets and developing novel drugs for the clinical treatment of RAI-R DTC.
Conclusions
MCT1 appears to be closely related to the invasive metastasis of RAI-R DTC cells, and it may be the cause of the loss of the iodine uptake ability of RAI-R DTC.
Acknowledgments
Funding: This study was supported by the Natural Science Foundation of Chongqing Municipal Science and Technology Commission (cstc2018jcyjAX0819).
Ethical Statement: The authors are accountable for all aspects of the work in ensuring that questions related to the accuracy or integrity of any part of the work are appropriately investigated and resolved. All procedures performed in this study involving human participants were in accordance with the Declaration of Helsinki (as revised in 2013). The study was approved by institutional ethics board of Chongqing University Central Hospital/Chongqing Emergency Medical Center (approval No. 2019-120) and informed consent was taken from all the patients.
Reporting Checklist: The authors have completed the MDAR reporting checklist. Available at https://dx.doi.org/10.21037/tcr-21-2417
Data Sharing Statement: Available at https://dx.doi.org/10.21037/tcr-21-2417
Conflicts of Interest: All authors have completed the ICMJE uniform disclosure form (available at https://dx.doi.org/10.21037/tcr-21-2417). All authors report that this study was funded by Natural Science Foundation of Chongqing Municipal Science and Technology Commission (cstc2018jcyjAX0819). The authors have no other conflicts of interest to declare.
(English Language Editor: L. Huleatt)
References
- 1.Shi YX, Chen L, Liu YC, et al. Differences among the Thyroid Imaging Reporting and Data System proposed by Korean, the American College of Radiology and the European Thyroid Association in the diagnostic performance of thyroid nodules. Transl Cancer Res 2020;9:4958-67. 10.21037/tcr-19-2870 [DOI] [PMC free article] [PubMed] [Google Scholar]
- 2.Jackson VN, Halestrap AP. The kinetics, substrate, and inhibitor specificity of the monocarboxylate (lactate) transporter of rat liver cells determined using the fluorescent intracellular pH indicator, 2',7'-bis(carboxyethyl)-5(6)-carboxyfluorescein. J Biol Chem 1996;271:861-8. 10.1074/jbc.271.2.861 [DOI] [PubMed] [Google Scholar]
- 3.Kazaure HS, Roman SA, Sosa JA. Aggressive variants of papillary thyroid cancer: incidence, characteristics and predictors of survival among 43,738 patients. Ann Surg Oncol 2012;19:1874-80. 10.1245/s10434-011-2129-x [DOI] [PubMed] [Google Scholar]
- 4.Woodrum DT, Gauger PG. Role of 131I in the treatment of well differentiated thyroid cancer. J Surg Oncol 2005;89:114-21. 10.1002/jso.20185 [DOI] [PubMed] [Google Scholar]
- 5.Elboğa U, Özkaya M, Sayiner ZA, et al. Lu-177 labelled peptide treatment for radioiodine refractory differentiated thyroid carcinoma. BMJ Case Rep 2016;2016:bcr2015213627. 10.1136/bcr-2015-213627 [DOI] [PMC free article] [PubMed] [Google Scholar]
- 6.Dai G, Levy O, Carrasco N. Cloning and characterization of the thyroid iodide transporter. Nature 1996;379:458-60. 10.1038/379458a0 [DOI] [PubMed] [Google Scholar]
- 7.Venkataraman GM, Yatin M, Ain KB. Cloning of the human sodium-iodide symporter promoter and characterization in a differentiated human thyroid cell line, KAT-50. Thyroid 1998;8:63-9. 10.1089/thy.1998.8.63 [DOI] [PubMed] [Google Scholar]
- 8.Lee WW, Lee B, Kim SJ, et al. Kinetics of iodide uptake and efflux in various human thyroid cancer cells by expressing sodium iodide symporter gene via a recombinant adenovirus. Oncol Rep 2003;10:845-9. 10.3892/or.10.4.845 [DOI] [PubMed] [Google Scholar]
- 9.Grey A, Bolland M, Gamble G, et al. The peroxisome proliferator-activated receptor-gamma agonist rosiglitazone decreases bone formation and bone mineral density in healthy postmenopausal women: a randomized, controlled trial. J Clin Endocrinol Metab 2007;92:1305-10. 10.1210/jc.2006-2646 [DOI] [PubMed] [Google Scholar]
- 10.Kim WG, Kim EY, Kim TY, et al. Redifferentiation therapy with 13-cis retinoic acids in radioiodine-resistant thyroid cancer. Endocr J 2009;56:105-12. 10.1507/endocrj.K08E-254 [DOI] [PubMed] [Google Scholar]
- 11.Rivera M, Ghossein RA, Schoder H, et al. Histopathologic characterization of radioactive iodine-refractory fluorodeoxyglucose-positron emission tomography-positive thyroid carcinoma. Cancer 2008;113:48-56. 10.1002/cncr.23515 [DOI] [PubMed] [Google Scholar]
- 12.Hainaut P, Plymoth A. Targeting the hallmarks of cancer: towards a rational approach to next-generation cancer therapy. Curr Opin Oncol 2013;25:50-1. 10.1097/CCO.0b013e32835b651e [DOI] [PubMed] [Google Scholar]
- 13.De Saedeleer CJ, Copetti T, Porporato PE, et al. Lactate activates HIF-1 in oxidative but not in Warburg-phenotype human tumor cells. PLoS One 2012;7:e46571. 10.1371/journal.pone.0046571 [DOI] [PMC free article] [PubMed] [Google Scholar]
- 14.Zhao F, Ming J, Zhou Y, et al. Inhibition of Glut1 by WZB117 sensitizes radioresistant breast cancer cells to irradiation. Cancer Chemother Pharmacol 2016;77:963-72. 10.1007/s00280-016-3007-9 [DOI] [PubMed] [Google Scholar]
- 15.Stubbs M, Rodrigues L, Howe FA, et al. Metabolic consequences of a reversed pH gradient in rat tumors. Cancer Res 1994;54:4011-6. [PubMed] [Google Scholar]
- 16.Putney LK, Denker SP, Barber DL. The changing face of the Na+/H+ exchanger, NHE1: structure, regulation, and cellular actions. Annu Rev Pharmacol Toxicol 2002;42:527-52. 10.1146/annurev.pharmtox.42.092001.143801 [DOI] [PubMed] [Google Scholar]
- 17.Haugen BR, Alexander EK, Bible KC, et al. 2015 American Thyroid Association Management Guidelines for Adult Patients with Thyroid Nodules and Differentiated Thyroid Cancer: The American Thyroid Association Guidelines Task Force on Thyroid Nodules and Differentiated Thyroid Cancer. Thyroid 2016;26:1-133. 10.1089/thy.2015.0020 [DOI] [PMC free article] [PubMed] [Google Scholar]


