Abstract
Background
Exportin 1 (XPO1), a nuclear export protein, participates in many biological processes, including mRNA transport, nucleocytoplasmic transport, nuclear protein export, regulation of mRNA stability, and drug response. XPO1 plays key roles in many cancer types and may serve as a potential biomarker. It is significant to systematically elucidate the roles of XPO1 in various cancer types in terms of function, molecular biology, immunology, and clinical relevance.
Methods
Data from UCSC Xena, CCLE, and CBioPortal were analyzed for the investigation of the differential expression of XPO1 across multiple cancer types. Clinical data were acquired to analyze the influence of XPO1 on the clinical characteristics of patients, such as survival outcome and clinical stage. The roles of XPO1 in the onset and progression of multiple cancers were expounded in terms of genetic changes at the molecular level [including tumor mutational burden (TMB), microsatellite instability (MSI), copy number variation (CNV), methylation, and gene co-expression], biological pathway changes, and the immune microenvironment.
Results
XPO1 was overexpressed in various tumor types, which may be related to CNV. Clinical data analysis revealed that XPO1 may serve as a risk factor in tumors, such as adrenocortical carcinoma, liver hepatocellular carcinoma, and low-grade glioma, thereby affecting patient prognosis. XPO1 in multiple tumor types was also substantially correlated with clinical stage, patient gender, and patient age. In certain tumors, the expression level of XPO1 exerted a greater influence on TMB and MSI. It was also found that XPO1 inhibited the activity of immune cells in the tumor immune microenvironment, such as CD8+ T cells, and affected biological pathways, such as the cell cycle and oxidative phosphorylation, and drove the expression of cancer driver genes, immune checkpoint genes, and highly mutated genes.
Conclusions
XPO1 is a potential pan-cancer risk factor as it may jointly promote tumor onset and progression by inhibiting the immune response, influencing relevant biological pathways, and promoting mutations in other genes.
Keywords: Exportin 1 (XPO1), pan-cancer, tumor mutational burden (TMB), microsatellite instability (MSI), immune microenvironment
Introduction
The nuclear export protein Exportin 1 (XPO1) plays a key role in the onset and progression of both solid tumors and hematological malignancies and is associated with a poor prognosis in patients with various cancers, including pancreatic, lung, gastric, prostate, and colorectal cancers (1). Selective inhibitors of XPO1, with selinexor being one of the most representative drugs, have been widely tested in solid tumors and hematological malignancies and approved for the treatment of relapsed/refractory multiple myeloma and diffuse large B-cell lymphoma (2,3). Some studies have suggested that XPO1 may promote tumor cell proliferation by influencing the sub-cellular localization of nuclear export signal-containing oncogenes, tumor suppressor proteins, control of the mitotic apparatus, chromosome segregation, stability of nuclear and chromosomal structures (4). Notably, XPO1 is the major transporter of many types of nuclear proteins, including tumor suppressor proteins and oncoproteins, such as Rb, APC, p53, p21, p27, BRCA1/2, eIF4E, and survivin (1,4,5). This indicates that XPO1 plays a critical role in the progression of many tumors. Besides directly influencing the expression of proto-oncogenes and tumor suppressor genes, XPO1 can also indirectly promote tumor onset and progression by affecting vascular endothelial growth factor, epidermal growth factor receptor, Cox-2, c-Myc, and HIF-1 (5). Based on these findings, it is evident that XPO1 does not affect tumor progression by a single route but exerts biological effects on tumors through multiple pathways. Therefore, elucidating the roles of XPO1 in various tumors based on clinical-omics and genomics is essential to provide theoretical guidance for future drug development and clinical treatment.
We present the following article in accordance with the REMARK reporting checklist (available at https://dx.doi.org/10.21037/tcr-21-1646).
Methods
Data sources
The mRNA expression data, clinical data, and methylation data of 33 tumor types and normal tissues were downloaded from UCSC Xena (https://xena.ucsc.edu/). The tumor types investigated in this study included adrenocortical carcinoma (ACC), urothelial bladder carcinoma (BLCA), infiltrating ductal carcinoma (BRCA), cervical squamous cell carcinoma and endocervical adenocarcinoma (CESC), cholangiocarcinoma (CHOL), colon adenocarcinoma (COAD), diffuse large B-cell lymphoma (DLBC), esophageal carcinoma (ESCA), glioblastoma multiforme (GBM), head and neck squamous cell carcinoma (HNSC), kidney chromophobe renal cell carcinoma (KICH), kidney clear cell renal cell carcinoma (KIRC), kidney renal papillary cell carcinoma (KIRP), acute myeloid leukemia (LAML), low-grade glioma (LGG), liver hepatocellular carcinoma (LIHC), lung adenocarcinoma (LUAD), lung squamous cell carcinoma (LUSC), mesothelioma (MESO), ovarian serous cystadenocarcinoma (OV), pancreatic adenocarcinoma (PAAD), pheochromocytoma/paraganglioma (PCPG), prostate adenocarcinoma (PRAD), rectum adenocarcinoma (READ), sarcoma (SARC), skin cutaneous melanoma (SKCM), stomach adenocarcinoma (STAD), testicular germ cell tumor (TGCT), thyroid carcinoma (THCA), thymic carcinoma (THYM), uterine corpus endometrial carcinoma (UCEC), uterine carcinosarcoma (UCS), and uveal melanoma (UVM). The mRNA expression data of various cancer cell lines were downloaded from CCLE (https://portals.broadinstitute.org/ccle), and the copy number variation (CNV) data of XPO1 in the 33 types of tumors were downloaded from CBioPortal (https://www.cbioportal.org/). All procedures performed in this study involving human participants were in accordance with the Declaration of Helsinki (as revised in 2013).
Differential expression of XPO1
To determine the differential expression of XPO1 in normal and tumor tissues, the data of XPO1 expression in the 33 tumor types downloaded from UCSC Xena were first transformed to the normalized transcripts per million format, and boxplots were plotted using the ggpubr and ggplot2 R packages (6). The statistical significance of differential XPO1 expression in the various tumors was determined using the Wilcoxon signed-rank test.
Correlations of XPO1 with clinical characteristics
To evaluate the effects of XPO1 expression on overall survival (OS), disease-specific survival (DSS), disease-free interval (DFI), and progression-free interval (PFI) in patients, tumor samples were divided into the two following groups: the high expression group and low expression group, based on the median XPO1 expression level among the various tumor types. Subsequently, survival analysis was performed using the log-rank test in the survival R package, and results were visualized using the survminer R package. A Cox proportional hazards model was also computed in the survival R package for survival analysis, and forest plots were drawn using the forestplot R package for the visualization of analysis results. The influence of XPO1 on patient survival in various cancers was investigated using the Kaplan-Meier Plotter (https://kmplot.com/analysis/) (7).
Correlations of XPO1 with patient age (≤18 years: adolescence; 19–30 years: adulthood; 31–50 years: middle-aged; >51 years: older), sex, and clinical stage were investigated. Boxplots were drawn using the ggpubr and ggplot2 R packages (6), and the statistical significance of the potential clinical correlations was determined using the Wilcoxon signed-rank test.
Characteristics of molecular-level changes of XPO1 and their molecular effects
Data regarding the CNVs of XPO1, including amplifications and deletions, were downloaded from CBioPotal (https://www.cbioportal.org/) for the calculation of CNV frequency among the various tumor types. Correlations between CNV and XPO1 expression level were determined using the Wilcoxon signed-rank test and visualized using the ggpubr R package. The Spearman’s rank correlation coefficients for correlations of XPO1 expression with tumor mutational burden (TMB) and microsatellite instability (MSI) in the various tumors were separately calculated, and radar charts were plotted using the fmsb R package. The statistical significance of differences in XPO1 methylation level in normal and tumor tissues was determined using the Wilcoxon signed-rank test, and results were visualized using the ggplot2 R package (6). Based on the median XPO1 methylation level, tumor samples were divided into the two following groups: the high methylation group and low methylation group, and survival analysis was performed using the survival R package. Mutations of XPO1 in the 33 tumor types were recorded, and the Spearman’s rank correlation coefficients between XPO1 expression and the expression of the top 30 highly mutated genes among the various tumor types were separately calculated.
Effects of XPO1 on the immune microenvironment
To determine the effects of XPO1 on the immune microenvironment in various tumor types, the stromal and immune scores of the tumors were evaluated using the ESTIMATE algorithm (8). The Spearman’s rank correlation coefficients for correlations of XPO1 expression with the stromal scores and the immune scores were separately calculated. Relative contents of 22 types of immune cells in the various tumor types were calculated using the CIBERSORT algorithm (9). Then the Spearman’s rank correlation coefficients between XPO1 expression and the various immune cell types were calculated.
Co-expression of XPO1 and specific genes
Co-expression analyses of XPO1 with immune-related genes and cancer driver genes were separately performed for further determination of XPO1 functions. The Pearson correlation coefficients between expression levels of XPO1 and the various immune checkpoint genes were calculated. We used the edgeR R package (10,11) to perform differential analysis between normal and tumor group. Next, we chose five genes with the highest log FC values among the 568 driver genes (12) for each tumor type, and the driver genes with the greatest difference were determined through the union of data for the various tumor types. The Pearson correlation coefficients between XPO1 expression and the driver genes with the greatest difference were calculated. Based on the median value of XPO1 expression, tumor samples were divided into the high expression group and low expression group, and differential analysis was performed using the edgeR R package (10,11). Gene set enrichment analysis (GSEA) was subsequently performed using the clusterProfiler R package (13). The top five genes with the highest absolute values for the normalized enrichment score and P<0.05 were identified for each tumor type, and the results were visualized.
Statistical analysis
All analyses were carried out in R version 3.6.1 and corresponding packages.
Results
XPO1 expression
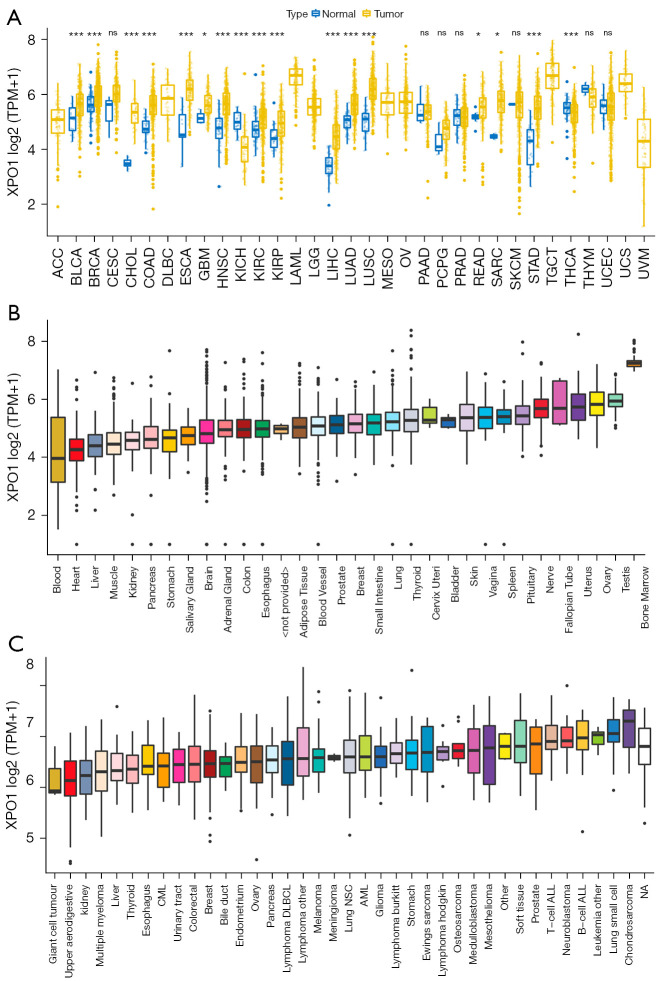
Differential expression analysis was performed between tumor tissue and the adjacent normal tissue for each tumor type to investigate the changes in XPO1 expression patterns. Results indicated that XPO1 was significantly overexpressed in most tumor types and significantly underexpressed in a small number of tumors. XPO1 was significantly overexpressed in BLCA, BRCA, CHOL, COAD, ESCA, GBM, HNSC, KIRC, KIRP, LIHC, LUSC, READ, SARC, and STAD and significantly underexpressed in KICH and THCA (Figure 1A). This indicated that XPO1 played different roles in different tumor types and might provide promoting or inhibiting effects during different stages of tumor onset and progression. With selective gene expression, the expression of the same gene in different tissues may not be completely identical, and differences may exist in the biological effects of the gene on various tissues. By utilizing GTEx sample data stored at UCSC Xena, we analyzed the expression of XPO1 in normal tissues. Results indicated that XPO1 expression was relatively higher in the ovary, uterus, bone marrow, testis, and nerve tissues, and relatively lower in the heart and blood tissues (Figure 1B). The analysis of XPO1 expression in tumor cell lines revealed that XPO1 was significantly overexpressed in B-cell acute lymphoblastic leukemia (B-ALL), T-cell ALL, small-cell lung carcinoma and neuroblastoma. This suggested that XPO1 might play a key role in lung cancer, ALL, and neuroblastoma (Figure 1C).
Figure 1.
XPO1 expression in normal tissues, tumor tissues, and cancer cell lines. (A) Differential expression analysis of XPO1 in normal and tumor samples of 33 tumor types (*, P<0.05; ***, P<0.001. The P value of each tumor: BLCA: 5.61e-04; BRCA: 2.97e-09; CESC: 0.08; CHOL: 2.26e-09; COAD: 4.87e-16; ESCA: 1.2e-06; GBM: 0.013; HNSC: 7.85e-15; KICH: 6.58e-09; KIRC: 3.14e-08; KIRP: 2.35e-05; LIHC: 1.73e-20; LUAD: 2.22e-18; LUSC: 1.71e-25; PAAD: 0.966; PCPG: 0.265; PRAD: 0.852; READ: 0.02; SARC: 0.023; SKCM: 0.883; STAD: 1.27e-15; THCA: 7e-04; THYM: 0.251; UCEC: 0.98). (B) XPO1 expression in normal tissues (based on data from the GTEx database). (C) XPO1 expression in tumor cell lines (based on data from the CCLE database). XPO1, Exportin 1; BLCA, bladder carcinoma; BRCA, infiltrating ductal carcinoma; CHOL, cholangiocarcinoma; COAD, colon adenocarcinoma; ESCA, esophageal carcinoma; GBM, glioblastoma multiforme; HNSC, head and neck squamous cell carcinoma; KICH, kidney chromophobe renal cell carcinoma; KIRC, kidney clear cell renal cell carcinoma; KIRP, kidney renal papillary cell carcinoma; LIHC, liver hepatocellular carcinoma; LUAD, lung adenocarcinoma; LUSC, lung squamous cell carcinoma; PAAD, pancreatic adenocarcinoma; PCPG, pheochromocytoma/paraganglioma; PRAD, prostate adenocarcinoma; READ, rectum adenocarcinoma; SARC, sarcoma; SKCM, skin cutaneous melanoma; STAD, stomach adenocarcinoma; THCA, thyroid carcinoma; THYM, thymic carcinoma; UCEC, uterine corpus endometrial carcinoma.
Correlations of XPO1 with clinical characteristics
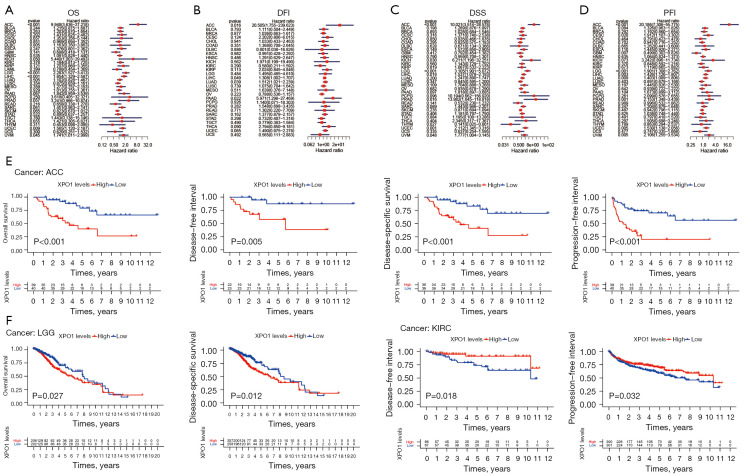
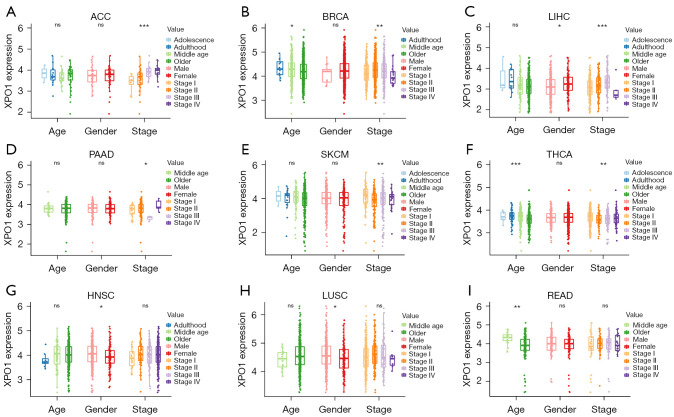
To investigate the correlations of XPO1 expression with patient prognosis, we performed survival analysis on OS, DSS, DFI, and PFI using the two following methods: the log-rank test and Cox proportional hazards model (Figure 2A-2G, Figure S1A-S1I). When the analysis results of the two methods were consolidated, we observed the following: (I) XPO1 was a risk factor for OS in ACC, LGG, and LIHC, higher XPO1 expression was associated with shorter OS; (II) XPO1 underexpression in ACC, LGG, LIHC, PRAD was associated with longer DSS, but shorter in THYM; (III) XPO1 underexpression in ACC, LIHC, LUAD, and PRAD was associated with longer PFI, and GBM was converse; and (IV) XPO1 underexpression in ACC was associated with longer DFI. Kaplan-Meier Plotter also got similar results (Figure S2A-S2L). To further elucidate the relationships between XPO1 and the various clinical characteristics, the effects of XPO1 on patient age, sex, and clinical stage were investigated (Figure 3A-3I). Results indicated that XPO1 expression was closely related to clinical stage in ACC, BRCA, LIHC, PAAD, SKCM, and THCA. Differences existed in XPO1 expression in BRCA, THCA, and READ among the different age groups, and significant differential expression of XPO1 in LIHC, HNSC, and LUSC also existed between the two sexes. These results suggested that XPO1 expression exerted certain effects on cancer progression, which was in agreement with the observations of XPO1 overexpression in the majority of tumor types.
Figure 2.
Expression levels and prognostic values of XPO1 in tumor and normal tissues. Survival analysis of XPO1 using the Cox proportional hazards model based on (A) OS, (B) DFI, (C) DSS, and (D) PFI. (E) Kaplan-Meier analysis of the correlations of XPO1 expression in ACC with (from left to right) OS, DFI, DSS, and PFI. (F) Kaplan-Meier analysis of the correlations of XPO1 expression in LGG with OS (left) and DSS (right). (G) Kaplan-Meier analysis of the correlations of XPO1 expression in KIRC with DFI (left) and PFI (right). XPO1, Exportin 1; OS, overall survival; DFI, disease-free interval; DSS, disease-specific survival; PFI, progression-free interval; ACC, adrenocortical carcinoma; KIRC, kidney clear cell renal cell carcinoma.
Figure 3.
Correlations of XPO1 expression with clinical characteristics. Correlations of XPO1 expression in (A) ACC, (B) BRCA, (C) LIHC, (D) PAAD, (E) SKCM, (F) THCA, (G) HNSC, (H) LUSC, and (I) READ with patient age, sex, and clinical stage (*, P<0.05; **, P<0.01; ***, P<0.001, ns: not statistically significant. The P value of age in each tumor: ACC: 0.623; BRCA: 0.029; LIHC: 0.265; PAAD: 0.961; SKCM: 0.393; THCA: 3.65e-04; HNSC: 0.284; LUSC: 0.217; READ: 0.001. The P value of gender in each tumor: ACC: 0.697; BRCA: 0.286; LIHC: 0.033; PAAD: 0.649; SKCM: 0.739; THCA: 0.952; HNSC: 0.014; LUSC: 0.026; READ: 0.79. The P value of stage in each tumor: ACC: 9.66e-04; BRCA: 0.002; LIHC: 7.71e-04; PAAD: 0.035; SKCM: 0.01; THCA: 0.001; HNSC: 0.399; LUSC: 0.192; READ: 0.906). XPO1, Exportin 1; ACC, adrenocortical carcinoma; BRCA, infiltrating ductal carcinoma; LIHC, liver hepatocellular carcinoma; PAAD, pancreatic adenocarcinoma; SKCM, skin cutaneous melanoma; THCA, thyroid carcinoma; HNSC, head and neck squamous cell carcinoma; LUSC, lung squamous cell carcinoma; READ, rectum adenocarcinoma.
Characteristics of molecular-level changes of XPO1 and their correlations with TMB and MSI
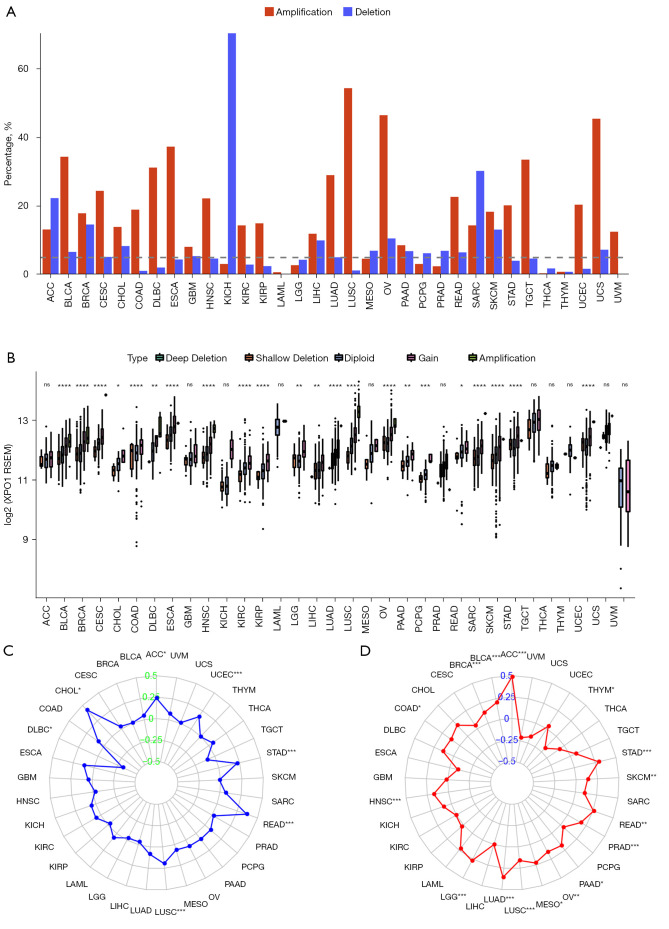
We determined the CNV (including amplifications and deletions) frequencies of XPO1 to investigate the diversity of genetic variations of XPO1 among the various tumor types. Results indicated that XPO1 had relatively high CNV frequencies (>5%), with the frequencies of copy number amplifications being generally higher than that of copy number deletions (Figure 4A). When the effects of CNV on XPO1 expression were investigated, we found that XPO1 expression was generally significantly correlated with CNV in tumors, such as BLCA, BRCA, CESC, KIRC, and LICH. Therefore, XPO1 overexpression appeared to be intricately linked to copy number amplification (Figure 4B). Notably, the frequency of copy number deletions of XPO1 in KICH was substantially higher than amplifications, which was consistent with the significant underexpression of XPO1 in KICH mentioned earlier. When the effects of XPO1 on MSI in the various tumor types were investigated, it was found that XPO1 was significantly positively correlated with MSI in ACC, STAD, READ, and CHOL (P<0.05, Spearman’s rank correlation coefficient >0.25) and significantly negatively correlated with MSI in DLBC (P<0.05, Spearman’s rank correlation coefficient <−0.25) (Figure 4C). As many studies have reported an important relationship between TMB and the outcome of immune checkpoint inhibitor therapy, we also performed a correlation analysis of XPO1 and TMB in various tumor types and found that XPO1 expression was significantly positively correlated with TMB in ACC, STAD, READ, LUAD, and LGG (P<0.05, Spearman’s rank correlation coefficient >0.25) (Figure 4D). The results described above further demonstrated that CNV was closely associated with XPO1 overexpression and suggested that XPO1 might affect the prognosis of various cancers through TMB and MSI.
Figure 4.
Characteristics of molecular-level changes of XPO1. (A) Somatic CNV frequencies of XPO1 in the 33 tumor types. (B) Correlation of XPO1 CNV type with XPO1 expression (*, P<0.05; **, P<0.01; ***, P<0.001; ****, P<0.0001; ns, not statistically significant. The P value of each tumor: ACC: 0.83; BLCA: 7.34e-11; BRCA: 2.58e-23; CESC: 2.54e-08; CHOL: 0.043; COAD: 3.7e-05; DLBC: 0.007; ESCA: 2.12e-05; GBM: 0.289; HNSC: 3.66e-13; KICH: 0.081; KIRC: 4.21e-06; KIRP: 3.62e-05; LAML: 0.517; LGG: 0.008; LIHC: 0.002; LUAD: 5.13e-11; LUSC: 5.13e-32; MESO: 0.056; OV: 1.39e-12; PAAD: 0.008; PCPG: 1.77e-04; PRAD: 0.057; READ: 0.012; SARC: 3.66e-05; SKCM: 8.48e-05; STAD: 1.02e-06; TGCT: 0.198; THCA: 0.197; THYM: 0.514; UCEC: 9.26e-11; UCS: 0.18; UVM: 0.919). (C) Correlation of XPO1 expression with TMB (*, P<0.05; ***, P<0.001. The P value of each tumor: ACC: 5.28e-06; BLCA: 3.42e-05; BRCA: 5.05e-05; CESC: 0.441; CHOL: 0.299; COAD: 0.013; DLBC: 0.413; ESCA: 0.221; GBM: 0.805; HNSC: 1.02e-04; KICH: 0.44; KIRC: 0.911; KIRP: 0.622; LAML: 0.078; LGG: 5.35e-10; LIHC: 0.989; LUAD: 1.58e-16; LUSC: 3.82e-04; MESO: 0.047; OV: 0.01; PAAD: 0.026; PCPG: 0.592; PRAD: 8.87e-05; READ: 0.003; SARC: 0.118; SKCM: 0.004; STAD: 1.48e-08; TGCT: 0.414; THCA: 0.112; THYM: 0.037; UCEC: 0.449; UCS: 0.207; UVM: 0.059). (D) Correlation of XPO1 expression with MSI (*, P<0.05; **, P<0.01; ***, P<0.001. The P value of each tumor: ACC: 0.034; BLCA: 0.323; BRCA: 0.902; CESC: 0.577; CHOL: 0.01; COAD: 0.077; DLBC: 0.028; ESCA: 0.125; GBM: 0.54; HNSC: 0.565; KICH: 0.652; KIRC: 0.229; KIRP: 0.636; LAML: 0.615; LGG: 0.562; LIHC: 0.521; LUAD: 0.055; LUSC: 1.31e-05; MESO: 0.562; OV: 0.176; PAAD: 0.257; PCPG: 0.249; PRAD: 0.668; READ: 3.66e-06; SARC: 0.297; SKCM: 0.777; STAD: 2.21e-05; TGCT: 0.225; THCA: 0.216; THYM: 0.951; UCEC: 9.09e-05; UCS: 0.966; UVM: 0.529). XPO1, Exportin 1; CNV, copy number variation; ACC, adrenocortical carcinoma; BLCA, bladder carcinoma; BRCA, infiltrating ductal carcinoma; CESC, cervical squamous cell carcinoma and endocervical adenocarcinoma; CHOL, cholangiocarcinoma; COAD, colon adenocarcinoma; DLBC, diffuse large B-cell lymphoma; ESCA, esophageal carcinoma; GBM, glioblastoma multiforme; HNSC, head and neck squamous cell carcinoma; KICH, kidney chromophobe renal cell carcinoma; KIRC, kidney clear cell renal cell carcinoma; KIRP, kidney renal papillary cell carcinoma; LAML, acute myeloid leukemia; LGG, low-grade glioma; LIHC, liver hepatocellular carcinoma; LUAD, lung adenocarcinoma; LUSC, lung squamous cell carcinoma; MESO, mesothelioma; OV, ovarian serous cystadenocarcinoma; PAAD, pancreatic adenocarcinoma; PCPG, pheochromocytoma/paraganglioma; PRAD, prostate adenocarcinoma; READ, rectum adenocarcinoma; SARC, sarcoma; SKCM, skin cutaneous melanoma; STAD, stomach adenocarcinoma; TGCT, testicular germ cell tumor; THCA, thyroid carcinoma; THYM, thymic carcinoma; UCEC, uterine corpus endometrial carcinoma; UCS, uterine carcinosarcoma; UVM, uveal melanoma.
Clinical prognostic value of XPO1 methylation
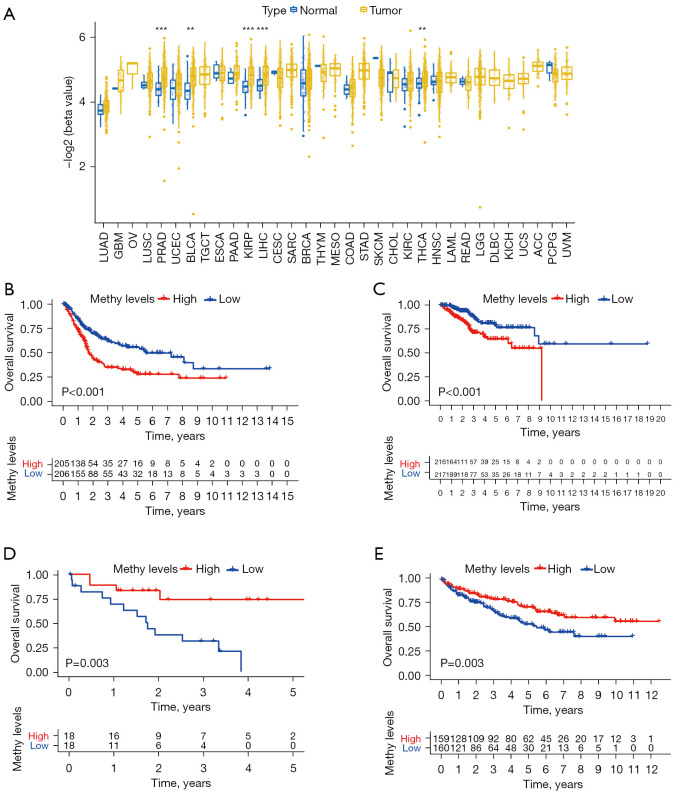
XPO1 methylation in normal and tumor tissues was measured. The result showed that XPO1 in BLCA, KIRP, LIHC, PRAD and THCA was highly methylated compared with XPO1 in normal tissues (Figure 5A). In particular, survival rate was better with low-methylated XPO1 than with high-methylated XPO1 in BLCA and UCEC (Figure 5B,5C); the converse was found to be true in CHOL and KIRC (Figure 5D,5E).
Figure 5.
Differences and prognostic value of XPO1 methylation. (A) Differences in the negative log (methylation β-value) of XPO1 in the normal and tumor tissues of the 33 tumor types (**, P<0.01; ***, P<0.001. The P value of each tumor: BLCA: 0.001; BRCA: 0.08; CESC: 0.423; CHOL: 1; COAD: 0.623; ESCA: 0.601; GBM: 0.665; HNSC: 0.808; KIRC: 0.237; KIRP: 2.18e-05; LIHC: 3.47e-06; LUAD: 0.062; LUSC: 0.321; PAAD: 0.354; PCPG: 0.275; PRAD: 1.15e-06; READ: 0.836; SKCM: 0.115; THCA: 0.003; THYM: 0.344; UCEC: 0.079). Kaplan-Meier analysis of OS with XPO1 methylation in (B) BLCA, (C) UCEC, (D) CHOL and (E) KIRC. XPO1, Exportin 1; BLCA, bladder carcinoma; BRCA, infiltrating ductal carcinoma; CESC, cervical squamous cell carcinoma and endocervical adenocarcinoma; CHOL, cholangiocarcinoma; COAD, colon adenocarcinoma; ESCA, esophageal carcinoma; GBM, glioblastoma multiforme; HNSC, head and neck squamous cell carcinoma; KIRC, kidney clear cell renal cell carcinoma; KIRP, kidney renal papillary cell carcinoma; LIHC, liver hepatocellular carcinoma; LUAD, lung adenocarcinoma; LUSC, lung squamous cell carcinoma; PAAD, pancreatic adenocarcinoma; PCPG, pheochromocytoma/paraganglioma; PRAD, prostate adenocarcinoma; READ, rectum adenocarcinoma; SARC, sarcoma; SKCM, skin cutaneous melanoma; THCA, thyroid carcinoma; THYM, thymic carcinoma; UCEC, uterine corpus endometrial carcinoma.
Correlations of XPO1 with genomic mutations
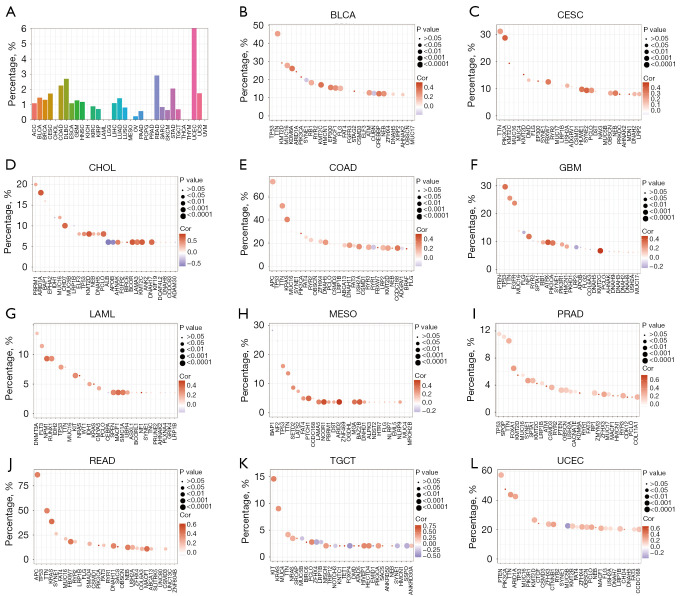
The occurrence of malignancies usually involves mutations in multiple genes. The mutation frequencies of XPO1 in the various tumors were generally low (except for a mutation frequency of >5% in UCEC) (Figure 6A). Recently, there was a report in the literature that XPO1 pathogenic mutations could contribute to a poor survival in NSCLC (14). To further elucidate the potential biological roles of XPO1 in genomic mutations, we analyzed the co-expression of XPO1 and highly mutated genes of the various tumor types. The result suggested that XPO1 expression generally showed significantly positive correlations with the highly mutated genes of the different tumors (Figure 6B-6L, Figure S3A-S3V). This suggested that XPO1 could indirectly promote tumor onset and progression by influencing mutation in other genes.
Figure 6.
Genetic mutations of XPO1. (A) Mutation frequencies of XPO1 in the 33 tumor types. Correlations of XPO1 expression with expression levels of the top 30 highly mutated genes in (B) BLCA, (C) CESC, (D) CHOL, (E) COAD, (F) GBM, (G) LAML, (H) MESO, (I) PRAD, (J) READ, (K) TGCT, and (L) UCEC. Circle size indicates the magnitude of the P value and shade indicates the magnitude of the Spearman’s rank correlation coefficient. XPO1, Exportin 1; BLCA, bladder carcinoma; CESC, cervical squamous cell carcinoma and endocervical adenocarcinoma; CHOL, cholangiocarcinoma; COAD, colon adenocarcinoma; GBM, glioblastoma multiforme; LAML, acute myeloid leukemia; MESO, mesothelioma; PRAD, prostate adenocarcinoma; READ, rectum adenocarcinoma; TGCT, testicular germ cell tumor; UCEC, uterine corpus endometrial carcinoma.
Potential significance of XPO1 in immune microenvironment changes
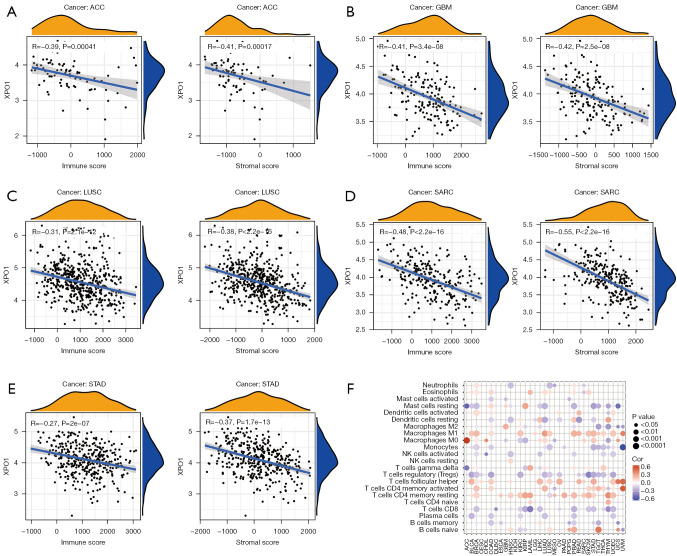
The immune microenvironment plays a crucial role in tumor onset and progression as well as patient prognosis. Therefore, correlation analysis was performed on XPO1 expression and the stromal and immune scores of the various tumor types were calculated using the ESTIMATE algorithm. We found that XPO1 expression exhibited negative correlations with both the stromal and immune scores. In particular, XPO1 was significantly negatively correlated with both the stromal and immune scores of ACC, GBM, LUSC, SARC, and STAD (P<0.05, R<−0.25) (Figure 7A-7E), significantly negatively correlated with immune score in CESC, ESCA, KIRP, LAML, PCPG, UCS, and MESO (P<0.05, R<−0.25), and significantly negatively correlated with stromal score in OV and TGCT (P<0.05, R<−0.25) (Figure S4A-S4R). The result obtained from the CIBERSORT algorithm showed that XPO1 was generally negatively correlated with the various immune cell contents (except for M1 macrophages, activated memory Th cells and resting memory Th cells) (Figure 7F). Therefore, XPO1 could also promote tumor onset and progression by influencing the tumor immune microenvironment.
Figure 7.
Effects of XPO1 on the tumor immune microenvironment. Correlations of XPO1 expression with ESTIMATE-calculated immune score (left) and stromal score (right) in (A) ACC, (B) GBM, (C) LUSC, (D) SARC, and (E) STAD. (F) Correlations of XPO1 expression with the CIBERSORT-calculated contents of 22 immune cell types in the various tumor types. XPO1, Exportin 1; ACC, adrenocortical carcinoma; GBM, glioblastoma multiforme; LUSC, lung squamous cell carcinoma; SARC, sarcoma; STAD, stomach adenocarcinoma.
Interactions of XPO1 with other genes and XPO1 molecular functions
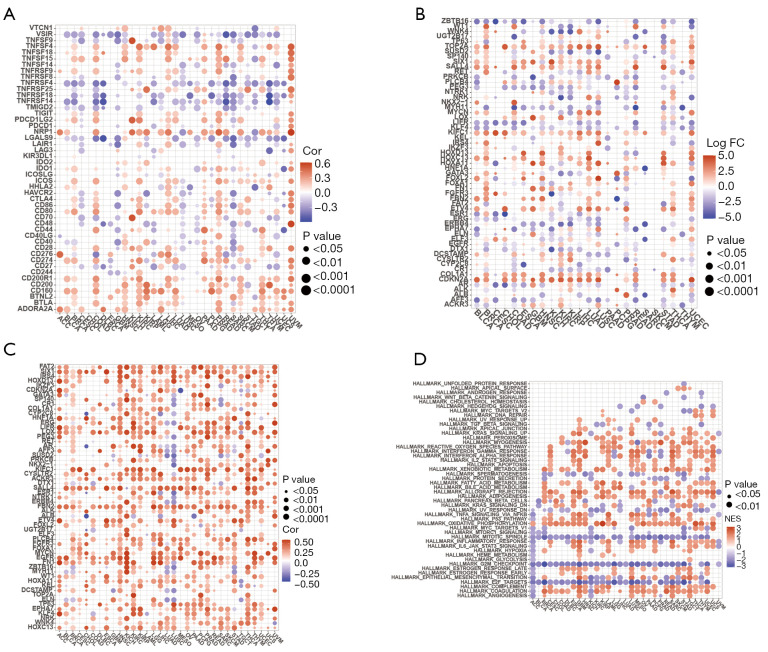
To further investigate the molecular mechanisms by which XPO1 affected the tumor microenvironment, we performed co-expression analyses of XPO1 with immune checkpoint genes and cancer driver genes. XPO1 generally showed significantly positive correlations with the expression of immune co-inhibitory receptors, such as ADOPA2A, BTLA, CD160, CD200, CD200R1, PDCD1LG2, and CTLA4, and negative correlations with immune co-stimulatory receptors, such as TNFRSF14, TNFRSF18, TNFRSF4, and TMIGD2 (Figure 8A). Mutations in cancer driver genes favor the promotion of tumor onset and progression. To further investigate the effects of XPO1 on gene mutations, co-expression analysis was performed with XPO1 and driver genes with high differential expression. XPO1 expression was highly positively correlated with driver gene expression, which indicated that XPO1 may serve as a potential driving factor of tumor onset and progression (Figure 8B,8C). GSEA revealed that cell cycle-targeting genes encoding E2F transcription factors, G2/M checkpoint genes, and genes associated with the assembly of the mitotic spindle apparatus were downregulated in the XPO1 overexpression group. Genes related to coagulation system components, genes encoding complement system components, genes related to oxidative phosphorylation, genes encoding proteins involved in the processing of drugs and other xenobiotics, and genes that upregulate adipocyte differentiation were upregulated in the XPO1 underexpression group (Figure 8D). Therefore, XPO1 might affect the tumor immune microenvironment by regulating the expression of immune checkpoint genes and served as a driving factor for the promotion of mutations in cancer driver genes, thereby promoting tumor onset. The effects of XPO1 on the tumor microenvironment might also be exerted through influences on biological processes, such as the cell cycle and oxidative phosphorylation.
Figure 8.
Co-expression analyses of XPO1 and specific genes. (A) Co-expression analysis of XPO1 and immune checkpoint genes. (B) Differential expression of the top five driver genes in each tumor type with the most significant differences, which were determined from the grouping of genes based on the median XPO1 expression level after the elimination of normal samples. (C) Co-expression analysis of XPO1 and driver genes with the most significant differences. (D) Co-expression analysis of XPO1 and the top five most-correlated biological pathway-related genes calculated based on GSEA results. XPO1, Exportin 1; GSEA, gene set enrichment analysis.
Discussion
The inhibition of XPO1 expression can serve as a potential treatment strategy for a wide variety of tumors, such as malignant tumors of the bladder, FLT3 mutation-induced acute myeloid leukemia, melanoma, stomach cancer, cervical cancer, ovarian cancer, pancreatic ductal adenocarcinoma, glioma, and osteosarcoma (15-17). In this study, we performed a systematic description of XPO1 expression across multiple cancer types by analyzing the transcriptome expression data of 33 types of tumors from the UCSC Xena database. Our results indicated that XPO1 was significantly overexpressed in BLCA, BRCA, CHOL, COAD, ESCA, GBM, HNSC, KIRC, KIRP, LIHC, LUSC, READ, SARC, and STAD. To further determined if XPO1 was generally overexpressed in tumors, we described XPO1 expression by utilizing normal tissue transcriptome data from GTEx and tumor cell line transcriptome data from CCLE. The mean expression of XPO1 in the various tumor cell lines was higher than that of normal tissues. XPO1 overexpression is a key characteristic of lung cancer, osteosarcoma, glioma, pancreatic ductal adenocarcinoma, cervical cancer, ovarian cancer, renal cell carcinoma, esophageal cancer, stomach cancer, hepatocellular carcinoma, acute myeloid/lymphocytic leukemia, multiple myeloma, and colon cancer. XPO1 plays a crucial role in tumor progression by influencing p53 phosphorylation or survivin protein expression (17-29). Our results also indicated that XPO1 overexpression was an important characteristic of many tumor types and might influence tumor progression.
TMB, which refers to the number of gene mutations present in tumor cells, can be utilized as a biomarker of certain tumor types and predicts the effects of immunotherapy. TMB has been used as a novel biomarker for the prediction of the clinical benefits of nivolumab combined with ipilimumab in the treatment of non-small cell lung cancer (30). MSI is present in various cancers, such as colon, endometrial, cervical, esophageal, skin, and breast cancers (31). Patients with colon cancer with characteristics of MSI have a better prognosis compared with those without MSI, and differences exist in the response to chemotherapy between the two groups (32). Our results indicated that XPO1 expression was significantly correlated with the presence of TMB and MSI in many tumor types, such as ACC and STAD. Therefore, we deduced that the molecular mechanisms of the effects of XPO1 on tumors might be related to its role in nuclear protein transport. By affecting or altering the transport of certain proteins, XPO1 might exert effects on biological processes, such as the cell cycle, DNA replication, and transcription, thereby indirectly inducing mutations and changes in expression in certain genes.
The results of GSEA indicated that XPO1 expression affected genes related to the G2/M checkpoints and oxidative phosphorylation, causing disturbances to related signaling pathways or biological processes. XPO1 expression also showed significantly positive correlations with the expression of highly mutated genes and cancer driver genes, suggesting that XPO1 could play a role in the early stages of tumor onset. Therefore, the early use of XPO1 inhibitors might provide better prognostic effects.
During the tumor onset and development process, tumor progression is determined by the continuous interactions between the tumor and host immune response (33). In other words, the progression and survival outcome of a tumor is largely dictated by its immune microenvironment. To elucidate the relationships of XPO1 with host immunity, we utilized the ESTIMATE and CIBERSORT algorithms to evaluate immunity-related characteristics and found that XPO1 expression was generally negatively correlated with immune and stromal scores, negatively correlated with the contents of regulatory T cells, CD8+ T cells, and plasma cells, and positively correlated with M1 macrophages, Tfh cells, and activated and resting CD4+ T cells. Correlation analysis of the expression of XPO1 and immune checkpoint genes revealed that XPO1 was generally positively correlated with immune co-inhibitory receptors and negatively correlated with immune co-stimulatory receptors. This indicated that XPO1 overexpression could regulate the tumor immune microenvironment and inhibited the host immune response, ultimately causing tumor immune evasion and progression.
Conclusions
We utilized pan-cancer data for the multi-dimensional analysis of the expression and molecular mechanisms of XPO1 in clinical characteristics and genomics. We also systematically elucidated the biological roles of XPO1 in various cancers. The results of this study provided a theoretical basis for clinical applications of XPO1 inhibitors.
Acknowledgments
Thank all the datasets’ owners who made the valuable data public.
Funding: None.
Ethical Statement: The authors are accountable for all aspects of the work in ensuring that questions related to the accuracy or integrity of any part of the work are appropriately investigated and resolved. All procedures performed in this study involving human participants were in accordance with the Declaration of Helsinki (as revised in 2013).
Footnotes
Reporting Checklist: The authors have completed the REMARK reporting checklist. Available at https://dx.doi.org/10.21037/tcr-21-1646
Conflicts of Interest: All authors have completed the ICMJE uniform disclosure form (available at https://dx.doi.org/10.21037/tcr-21-1646). The authors have no conflicts of interest to declare.
References
- 1.Azizian NG, Li Y. XPO1-dependent nuclear export as a target for cancer therapy. J Hematol Oncol 2020;13:61. 10.1186/s13045-020-00903-4 [DOI] [PMC free article] [PubMed] [Google Scholar]
- 2.XPO1 Inhibitor Approved for Multiple Myeloma . Cancer Discov 2019;9:1150-1. 10.1158/2159-8290.CD-NB2019-085 [DOI] [PubMed] [Google Scholar]
- 3.Azmi AS, Uddin MH, Mohammad RM. The nuclear export protein XPO1 - from biology to targeted therapy. Nat Rev Clin Oncol 2021;18:152-69. 10.1038/s41571-020-00442-4 [DOI] [PubMed] [Google Scholar]
- 4.Gravina GL, Senapedis W, McCauley D, et al. Nucleo-cytoplasmic transport as a therapeutic target of cancer. J Hematol Oncol 2014;7:85. 10.1186/s13045-014-0085-1 [DOI] [PMC free article] [PubMed] [Google Scholar]
- 5.Sun Q, Chen X, Zhou Q, et al. Inhibiting cancer cell hallmark features through nuclear export inhibition. Signal Transduct Target Ther 2016;1:16010. 10.1038/sigtrans.2016.10 [DOI] [PMC free article] [PubMed] [Google Scholar]
- 6.Valero-Mora PM. ggplot2: Elegant Graphics for Data Analysis. Journal of Statal Software 2010;35.
- 7.Nagy Á, Lánczky A, Menyhárt O, et al. Validation of miRNA prognostic power in hepatocellular carcinoma using expression data of independent datasets. Sci Rep 2018;8:9227. 10.1038/s41598-018-27521-y [DOI] [PMC free article] [PubMed] [Google Scholar]
- 8.Yoshihara K, Shahmoradgoli M, Martínez E, et al. Inferring tumour purity and stromal and immune cell admixture from expression data. Nat Commun 2013;4:2612. 10.1038/ncomms3612 [DOI] [PMC free article] [PubMed] [Google Scholar]
- 9.Newman AM, Liu CL, Green MR, et al. Robust enumeration of cell subsets from tissue expression profiles. Nat Methods 2015;12:453-7. 10.1038/nmeth.3337 [DOI] [PMC free article] [PubMed] [Google Scholar]
- 10.Robinson MD, McCarthy DJ, Smyth GK. edgeR: a Bioconductor package for differential expression analysis of digital gene expression data. Bioinformatics 2010;26:139-40. 10.1093/bioinformatics/btp616 [DOI] [PMC free article] [PubMed] [Google Scholar]
- 11.McCarthy DJ, Chen Y, Smyth GK. Differential expression analysis of multifactor RNA-Seq experiments with respect to biological variation. Nucleic Acids Res 2012;40:4288-97. 10.1093/nar/gks042 [DOI] [PMC free article] [PubMed] [Google Scholar]
- 12.Martínez-Jiménez F, Muiños F, Sentís I, et al. A compendium of mutational cancer driver genes. Nat Rev Cancer 2020;20:555-72. 10.1038/s41568-020-0290-x [DOI] [PubMed] [Google Scholar]
- 13.Yu G, Wang LG, Han Y, et al. clusterProfiler: an R package for comparing biological themes among gene clusters. OMICS 2012;16:284-7. 10.1089/omi.2011.0118 [DOI] [PMC free article] [PubMed] [Google Scholar]
- 14.Nagasaka M, Asad MFB, Al Hallak MN, et al. Impact of XPO1 mutations on survival outcomes in metastatic non-small cell lung cancer (NSCLC). Lung Cancer 2021;160:92-8. 10.1016/j.lungcan.2021.08.010 [DOI] [PMC free article] [PubMed] [Google Scholar]
- 15.Zhang W, Ly C, Ishizawa J, et al. Combinatorial targeting of XPO1 and FLT3 exerts synergistic anti-leukemia effects through induction of differentiation and apoptosis in FLT3-mutated acute myeloid leukemias: from concept to clinical trial. Haematologica 2018;103:1642-53. 10.3324/haematol.2017.185082 [DOI] [PMC free article] [PubMed] [Google Scholar]
- 16.Yang J, Bill MA, Young GS, et al. Novel small molecule XPO1/CRM1 inhibitors induce nuclear accumulation of TP53, phosphorylated MAPK and apoptosis in human melanoma cells. PLoS One 2014;9:e102983. 10.1371/journal.pone.0102983 [DOI] [PMC free article] [PubMed] [Google Scholar]
- 17.Gao W, Lu C, Chen L, et al. Overexpression of CRM1: A Characteristic Feature in a Transformed Phenotype of Lung Carcinogenesis and a Molecular Target for Lung Cancer Adjuvant Therapy. J Thorac Oncol 2015;10:815-25. 10.1097/JTO.0000000000000485 [DOI] [PubMed] [Google Scholar]
- 18.Yao Y, Dong Y, Lin F, et al. The expression of CRM1 is associated with prognosis in human osteosarcoma. Oncol Rep 2009;21:229-35. [PubMed] [Google Scholar]
- 19.Shen A, Wang Y, Zhao Y, et al. Expression of CRM1 in human gliomas and its significance in p27 expression and clinical prognosis. Neurosurgery 2009;65:153-9; discussion 159-60. 10.1227/01.NEU.0000348550.47441.4B [DOI] [PubMed] [Google Scholar]
- 20.Huang WY, Yue L, Qiu WS, et al. Prognostic value of CRM1 in pancreas cancer. Clin Invest Med 2009;32:E315. 10.25011/cim.v32i6.10668 [DOI] [PubMed] [Google Scholar]
- 21.van der Watt PJ, Maske CP, Hendricks DT, et al. The Karyopherin proteins, Crm1 and Karyopherin beta1, are overexpressed in cervical cancer and are critical for cancer cell survival and proliferation. Int J Cancer 2009;124:1829-40. 10.1002/ijc.24146 [DOI] [PMC free article] [PubMed] [Google Scholar]
- 22.Chen Y, Camacho SC, Silvers TR, et al. Inhibition of the Nuclear Export Receptor XPO1 as a Therapeutic Target for Platinum-Resistant Ovarian Cancer. Clin Cancer Res 2017;23:1552-63. 10.1158/1078-0432.CCR-16-1333 [DOI] [PubMed] [Google Scholar]
- 23.Inoue H, Kauffman M, Shacham S, et al. CRM1 blockade by selective inhibitors of nuclear export attenuates kidney cancer growth. J Urol 2013;189:2317-26. 10.1016/j.juro.2012.10.018 [DOI] [PMC free article] [PubMed] [Google Scholar]
- 24.van der Watt PJ, Zemanay W, Govender D, et al. Elevated expression of the nuclear export protein, Crm1 (exportin 1), associates with human oesophageal squamous cell carcinoma. Oncol Rep 2014;32:730-8. 10.3892/or.2014.3231 [DOI] [PubMed] [Google Scholar]
- 25.Subhash VV, Yeo MS, Wang L, et al. Anti-tumor efficacy of Selinexor (KPT-330) in gastric cancer is dependent on nuclear accumulation of p53 tumor suppressor. Sci Rep 2018;8:12248. 10.1038/s41598-018-30686-1 [DOI] [PMC free article] [PubMed] [Google Scholar]
- 26.Zheng Y, Gery S, Sun H, et al. KPT-330 inhibitor of XPO1-mediated nuclear export has anti-proliferative activity in hepatocellular carcinoma. Cancer Chemother Pharmacol 2014;74:487-95. 10.1007/s00280-014-2495-8 [DOI] [PMC free article] [PubMed] [Google Scholar]
- 27.Tai YT, Landesman Y, Acharya C, et al. CRM1 inhibition induces tumor cell cytotoxicity and impairs osteoclastogenesis in multiple myeloma: molecular mechanisms and therapeutic implications. Leukemia 2014;28:155-65. 10.1038/leu.2013.115 [DOI] [PMC free article] [PubMed] [Google Scholar]
- 28.Kojima K, Kornblau SM, Ruvolo V, et al. Prognostic impact and targeting of CRM1 in acute myeloid leukemia. Blood 2013;121:4166-74. 10.1182/blood-2012-08-447581 [DOI] [PMC free article] [PubMed] [Google Scholar]
- 29.Aladhraei M, Kassem Al-Thobhani A, Poungvarin N, et al. Association of XPO1 Overexpression with NF-κB and Ki67 in Colorectal Cancer. Asian Pac J Cancer Prev 2019;20:3747-54. 10.31557/APJCP.2019.20.12.3747 [DOI] [PMC free article] [PubMed] [Google Scholar]
- 30.Hellmann MD, Ciuleanu TE, Pluzanski A, et al. Nivolumab plus Ipilimumab in Lung Cancer with a High Tumor Mutational Burden. N Engl J Med 2018;378:2093-104. 10.1056/NEJMoa1801946 [DOI] [PMC free article] [PubMed] [Google Scholar]
- 31.Dudley JC, Lin MT, Le DT, et al. Microsatellite Instability as a Biomarker for PD-1 Blockade. Clin Cancer Res 2016;22:813-20. 10.1158/1078-0432.CCR-15-1678 [DOI] [PubMed] [Google Scholar]
- 32.Vilar E, Gruber SB. Microsatellite instability in colorectal cancer-the stable evidence. Nat Rev Clin Oncol 2010;7:153-62. 10.1038/nrclinonc.2009.237 [DOI] [PMC free article] [PubMed] [Google Scholar]
- 33.Bruni D, Angell HK, Galon J. The immune contexture and Immunoscore in cancer prognosis and therapeutic efficacy. Nat Rev Cancer 2020;20:662-80. 10.1038/s41568-020-0285-7 [DOI] [PubMed] [Google Scholar]


