Abstract
Background
Long noncoding RNAs (lncRNAs) can play vital roles in tumor initiation, progression, invasion, and metastasis. However, the functional role of the lncRNA-based competing endogenous RNA (ceRNA) networks in gastric cancer (GC) is still unclear. We aimed to identify novel lncRNAs and their association with GC prognosis.
Methods
The lncRNA, miRNA, and mRNA expression profiles of GC patients data were obtained from The Cancer Genome Atlas (TCGA) database. Differentially expressed genes (DEGs) were identified using the edge-R package. Then, the relationship among lncRNAs-miRNAs-mRNAs was integrated into a constructed ceRNA network with Cytoscape software. Using Cox regression analysis, a risk score system based on DEGs associated with patient prognosis in GC was established. Finally, a nomogram was founded to predict the prognosis of GC patients.
Results
A total of 971 differentially expressed lncRNAs (DElncRNAs), 144 differentially expressed miRNAs (DEmiRNAs) and 2,789 differentially expressed mRNAs (DEmRNAs) were identified and found to be associated with GC risk. Using the bioinformatics method, a ceRNA network involving 62 DElncRNAs, 21 DEmiRNAs and 59 DEmRNAs was constructed. Based on the results of the Cox regression analysis, a risk-scoring system involving 3 lncRNAs (i.e., ADAMTS9-AS1, C15orf54, and AL391152.1) was set up for the survival analysis of GC patients. The area under the receiver operating characteristic (ROC) curve for the risk-scoring system was 0.674, with a C-index of 0.64 [95% confidence interval (CI): 0.59–0.69, P=2.806485e−08]. Univariate and multivariate Cox regression analyses demonstrated that the risk-scoring system was an independent prognostic factor for GC. The risk-scoring system is positively associated with advanced tumor grade. The expression of these 3 lncRNAs were validated in GEPIA database. A nomogram based on these 3 lncRNAs was created to predict the prognosis of GC patients.
Conclusions
Our study established a novel lncRNA-expression-based ceRNA network and an ADAMTS9-AS1-C15orf54-AL391152.1-based risk-scoring system, which can be used to predict the prognosis of GC patients.
Keywords: Competing endogenous RNA (ceRNA), gastric cancer (GC), long noncoding RNA (lncRNA)
Introduction
Gastric cancer (GC) is the third leading cause of cancer-related mortality, accounting for approximately 783,000 deaths (1 in every 12 deaths) globally in 2018 (1). To date, gastrectomy and chemotherapy are still the main therapeutic options for patients with GC (2). Many new agents, such as pembrolizumab, avelumab and rilitumumab, have been investigated in patients with GC but didn’t demonstrate efficacy (3,4). Due to its high prevalence, low survival, and limited treatment choices, GC remains an important clinical practice challenge.
Recently, a number of studies aimed to found molecular biomarkers to prognosticate survival or select appropriate therapeutic strategies for patients with GC. However, most of the studies failed in the validation studies (5). Therefore, the establishment of potential biomarkers and therapeutic targets as well as individualized approaches for treatment is urgently required (3,6).
Long noncoding RNAs (lncRNA) are a group RNAs with a length of at least 200 nucleotides that do not encode proteins. lncRNAs have been recognized to possibly play pivotal biological roles in tumor initiation, progression, invasion, and metastasis (7-9). Salmena et al. hypothesized about the existence of a complex competing endogenous RNA (ceRNA) network (10). Numerous studies have confirmed that lncRNAs can regulate messenger RNA (mRNA) transcription by acting as microRNA (miRNA) sponges to suppress the function of miRNA (11-15). For instance, TTTY15 lncRNA can promote the progression of prostate cancer via miRNA let-7 sponging, thus increasing the expression of CDK6 and FN1 (13). FAM225A sponges miR-510-3p/miR-1275 and upregulates ITGB3 to promote nasopharyngeal carcinoma tumorigenesis and metastasis (15). HAGLR lncRNA regulates metastasis and epithelial-mesenchymal transition in esophageal cancer by acting as a microRNA-143-5p sponge to bind lysosome-associated membrane glycoprotein 3 (LAMP3) (14).
The present study aimed to screen out novel lncRNAs for prognosis of patients with GC and to provide new insights into the potential features of lncRNAs as therapeutic targets. Toward this goal, we constructed a lncRNA-based prognostic risk-scoring system based on the ceRNA network. A prognostic nomogram including lncRNA expression and clinical information was established to evaluate the survival rate probability, which can facilitate for clinical use. Our analysis used The Cancer Genome Atlas (TCGA) data of GC patients.
Methods
Data retrieval and analysis
The lncRNA, miRNA and mRNA expression profiles as well as clinical data of GC patients were retrieved from the TCGA database (http://tcga-data.nci.nih.gov/tcga/). TCGA database contains multiplatform molecular profiles along with clinicopathological information of various caner types (16). A total of 410 GC tissues and 42 adjacent normal tissues were subjected to miRNA analysis, while 343 GC patients and 30 normal controls were included for lncRNA and mRNA analysis. The present study was carried out in accordance with the guidelines published by TCGA (http://cancergenome.nih.gov/publications/publication guidelines). Thus, it was not necessary to obtain further ethical approval.
Identification of differentially expressed lncRNAs, miRNAs and mRNAs in GC
Differentially expressed lncRNAs, miRNAs, and mRNAs were defined and encoded using the Ensembl database (http://www.ensembl.org/index.html). The differentially expressed genes (DEGs) were obtained using the “edge-R” package in R software. lncRNA with an absolute log2-fold change >2 and P values <0.01 was regarded as differentially expressed lncRNA (DElncRNA), whereas miRNA and mRNA with an absolute log2-fold change >1.5 and adjusted P values <0.05 were regarded as differentially expressed miRNA (DEmiRNA) and differentially expressed mRNA (DEmRNA), respectively. The gplots and heatmap packages in R were adopted to generate volcano plots and heat maps for the DEGs.
ceRNA network construction
The interaction pairs between DElncRNAs and DEmiRNAs were predicted using the miRcode database (17). The StarBase v2.0 database (http://starbase.sysu.edu.cn/) was used to modify the miRNA sequences (18). The interaction pairs between DEmiRNA and DEmRNAs were retrieved using the miRDB, miRTarBase, and TargetScan databases (19-21). Only those mRNAs that were represented in all 3 databases were selected as target mRNAs; these were further intersected with the identified DEmRNAs to determine potential DEmiRNA-targeted DEmRNA. Finally, the ceRNA network was established based on the interaction pairs of DEmiRNA-DEmRNA and DElncRNA-DEmiRNA, and was visualized using Cytoscape version 3.7.2 software (http://www.cytoscape.org/) (22).
Establishment of a protein-protein interaction (PPI) network
We aimed to clarify the interactions among DEmRNAs involved in ceRNA network. To do this, we constructed a PPI network. DEmRNAs were imported into the STRING database (http://string-db.org/), the search model was chosen as “multiple proteins”, the species was set as “Homo sapiens,” and a score >0.4 was set as the minimum interaction threshold.
To obtain the barplot figure and hub-genes, the downloaded string-interactions.tsv file was imported into R to generate the barplot figure.
Functional and signaling pathway enrichment analysis
To reveal the potential biological process and signaling pathway of DEmRNAs associated with the ceRNA network, Gene Ontology (GO) functional enrichment analysis and Kyoto Encyclopedia of Genes and Genomes (KEGG) pathway enrichment analyses were performed using “clusterProfiler” package in R software. The threshold values were set as: P<0.01 and the false discovery rate (FDR) <0.05.
Identification of prognostic signatures for GC
To assess the prognostic values of the identified DEGs, survival analyses were carried out using the “survival” package in R software. Survival curves were produced by using Kaplan-Meier estimates, and were compared statistically using the log-rank test. Univariate Cox analysis was employed to identify significant relationships (P<0.001) between overall survival (OS) and each DEG expressed in the ceRNA network. Subsequently, multivariate Cox regression analysis was applied to explore the role of DEGs in GC, by calculating the risk scores as the sum of the production of each gene and its coefficient [hazard ratio (HR)]. According to the median risk score, GC patients were categorized into 2 cohorts: the high-risk group and the low-risk group. The survival distributions of these two groups were compared using the log-rank test. The effects of the DEGs (high-risk group versus low-risk group) on OS were determined using the area under the receiver operating characteristic (ROC) curve, namely, AUC under a binomial proportion confidence interval (CI), which was determined with the “survival ROC” package in R, to explore the sensitivity and specificity for predicting GC survival. A scatter plot and interactive distribution-based scatter plot for assessing the performance of the prognostic model were created.
Independence assessment for prognostic system based on risk-scorings
To assess the independent predictive power of prognostic system based on risk-scorings, univariate and multivariate Cox regression analyses were carried out to evaluate the effects of the risk-scoring system along with other clinical variables of GC patients on OS risk-scorings. The results are shown using forest_plots, which were generated with the “survival” package in R. lncRNAs involved in the risk-scoring were validated using Gene Expression Profiling Interactive Analysis (GEPIA) (http://gepia.cancerpku.cn/index.htm) (23).
Association analyses between the risk-scoring system and clinicopathological features
In order to explore the associations between the risk-scoring system and clinicopathological characteristics, we preformed the chi-square test was conducted via “beeswarm” package in R. Age at diagnosis, gender, TNM stage, and tumor grade were included into analyses.
Gene set enrichment analysis (GSEA)
GSEA were performed to identify enriched KEGG pathways to disclose the potential biological mechanisms of the risk-scoring system. Statistically significance was set as P<0.05 and FDR <0.25.
Construction the prognostic nomogram
Based on the results of the multivariate Cox regression analyses of the independent assessment, a prognostic nomogram for OS was generated with the “rms” package in R. Calibration plots were generated to calculate the predictive performance of the prognostic nomogram.
Results
Differential expression of lncRNAs, miRNAs and mRNA in GC patients
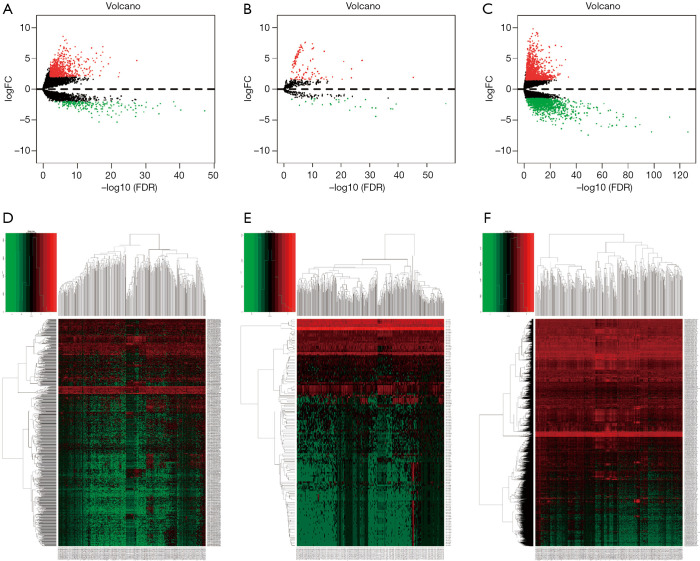
Differential expression analysis revealed that 971 (206 downregulated and 765 upregulated, see at http://fp.amegroups.cn/cms/2a3ae55f8fbf64907670c1ed3e3d3bb7/tcr-19-2977-1.pdf, http://fp.amegroups.cn/cms/0efcd47ff7014a67b5df1aa55a46c98a/tcr-19-2977-2.pdf) DElncRNA, 2,789 (1,282 downregulated and 1,508 upregulated, see at http://fp.amegroups.cn/cms/0363dc616251418fc6b7f4219bc63890/tcr-19-2977-3.pdf, http://fp.amegroups.cn/cms/c0d33e14c33a482164410347f6eeac8c/tcr-19-2977-4.pdf) DEmRNAs, and 144 (27 downregulated and 117 upregulated, see at http://fp.amegroups.cn/cms/8d352a4fb17ce56cb7cd921f1d87e8cf/tcr-19-2977-5.pdf, http://fp.amegroups.cn/cms/6b73711adf7879be43569be7a7faabc4/tcr-19-2977-6.pdf) DEmiRNAs were associated with GC. The distributions of all DEGs in -log (FDR) and logFC dimensions are presented in the form of volcano maps (Figure 1A,B,C). The numerical data representing the expression profiles of DEGs are shown in the form of heatmaps (Figure 1D,E,F).
Figure 1.
Identification of gastric cancer-associated DEGs. Volcano maps of the DElncRNAs (A), DEmiRNAs (B) and DEmRNAs (C). Heatmaps of the DElncRNAs (D), DEmiRNAs (E) and DEmRNAs (F) associated with risk of GC. DEG, differentially expressed genes; DElncRNAs, differentially expressed lncRNAs; DEmiRNAs, differentially expressed miRNAs; DEmRNAs, differentially expressed mRNAs; GC, gastric cancer.
ceRNA network of GC patients
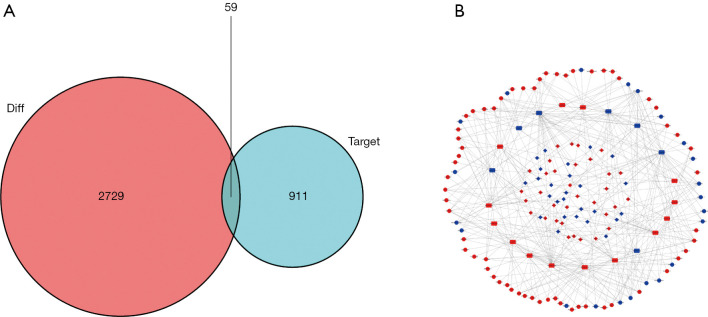
The ceRNA network was constructed as follows. First, 62 DElncRNAs, 21 DEmiRNAs, and 315 pairs of lncRNA and miRNA interaction were screened using the miRcode dataset and the Perl program (Table 1). Then, the 21 miRNA-targeted mRNAs were selected from the miRTarBase, miRDB, and TargetScan databases. The DEGs represented in all 3 databases were ultimately chosen, and those not involved in DEmRNAs were discarded (Table 2, Figure 2A). Finally, the ceRNA network of GC included 62 DElncRNAs, 21 DEmiRNAs and 59 DEmRNAs (Figure 2B).
Table 1. Representative relationships between lncRNAs and miRNAs in gastric cancer.
| lncRNA | miRNA |
|---|---|
| IGF2-AS | hsa-mir-519d, hsa-mir-122 |
| C15orf54 | hsa-mir-301b, hsa-mir-372, hsa-mir-373, hsa-mir-143, hsa-mir-195, hsa-mir-182 |
| AL357153.1 | hsa-mir-301b, hsa-mir-183, hsa-mir-217, hsa-mir-383 |
| AP002478.1 | hsa-mir-551a, hsa-mir-372, hsa-mir-373, hsa-mir-195, hsa-mir-519d, hsa-mir-182, hsa-mir-184, hsa-mir-205, hsa-mir-508, hsa-mir-122 |
| LINC00221 | hsa-mir-301b, hsa-mir-372, hsa-mir-373, hsa-mir-96, hsa-mir-143, hsa-mir-519d, hsa-mir-182, hsa-mir-204, hsa-mir-21, hsa-mir-217, hsa-mir-508 |
Table 2. Representative relationships between miRNAs and mRNAs in gastric cancer.
| miRNA | mRNA |
|---|---|
| Has-mir-519d | HMGB3, SMOC, CFL2, PGM2L1, FAM129A, E2F1, SOX4, CYBRD1, NETO2, ATAD2, POLQ, SLC16A9 |
| hsa-mir-182 | ULBP2, HOXA9, TCEAL7, FOXF2, CITED2, PRKAA2, NPTX1 |
| hsa-mir-145 | SERPINE1, MEST, ANGPT2 |
| hsa-mir-204 | HCAR2, IL11, NPTX1, HOXC8, FOXC1, CHRDL1 |
| hsa-mir-373 | LEFTY1, CADM2, PBK, ATAD2, CFL2, TMEM100 |
Figure 2.
Establishment of the ceRNA network. (A) Venn diagram of the aberrantly expressed mRNAs related to ceRNA regulatory network. The red area indicates the total number of DEmRNA, while the blue area represents the target number. The intermediate purple area indicates the total number of the differentially expressed and targeted mRNAs. (B) The ceRNA network of GC patients. The red and blue nodes indicate upregulated and downregulated expression, respectively. lncRNA, miRNA and mRNA are shown as circles, rectangles, and diamonds, respectively. ceRNA, competing endogenous RNA; DEmRNA, differentially expressed mRNA; GC, gastric cancer.
PPI network of GC patients
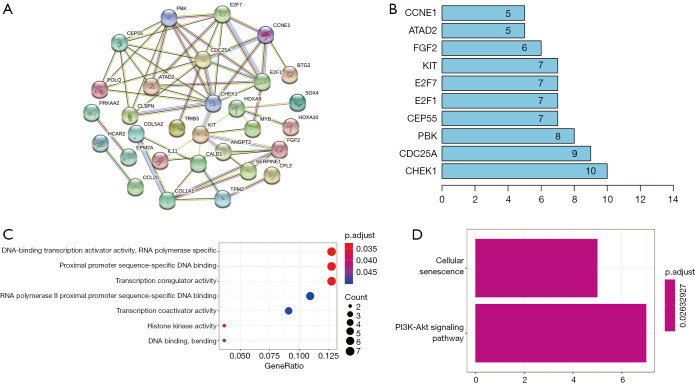
PPIs among the DEmRNAs identified from the ceRNA network were analyzed using the STRING website (Figure 3A). The bar plot figure revealed that the significant hub-genes were CHEK1, CDC25A, PBK, CEP55, and E2F1 (Figure 3B).
Figure 3.
Construction of the PPI network and functional analyses. (A) PPI network analysis of mRNAs related to ceRNA regulatory network. (B) Barplot showing the degree of involvement of each gene in the PPI network. (C) GO analysis of DEmRNAs in the ceRNA network. (D) KEGG analysis of DEmRNAs in the ceRNA network. PPI, Protein-protein interaction; ceRNA, competing endogenous RNA; GO, Gene Ontology; KEGG, Kyoto Encyclopedia of Genes and Genomes.
GO and KEGG enrichment analyses
GO enrichment analysis was performed to explore the functions related to the DEmRNAs involved in the ceRNA network. Figure 3C displays the dot plot of GO terms. The top 3 GO terms of DEmRNAs in the ceRNA network were mainly enriched in DNA-binding transcription activator activity, proximal promoter sequence-specific DNA binding, and transcription coregulator activity. The KEGG pathways of the DEmRNAs were enriched in terms of cellular senescence and PI3K-Akt signaling pathway (Figure 3D).
Association between the ceRNA network and GC survival
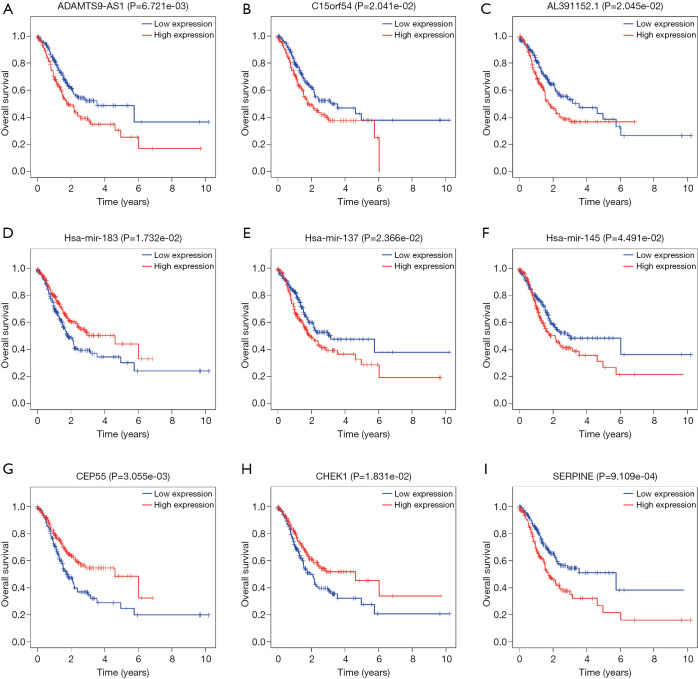
The associations between the DElncRNAs, DEmiRNAs, and DEmRNAs and OS in GC patients were evaluated using the “survival” package in R software, in order to elucidate their prognostic characteristics. The results demonstrated that 9 out of 62 DElncRNAs, 5 out of 21 DEmiRNAs and 20 out of 59 DEmRNAs were significantly associated (P<0.05) with OS in GC patients (Figure 4).
Figure 4.
Associations of representative DElncRNAs (A,B,C), DEmiRNAs (D,E,F) and DEmRNAs (G,H,I) with over survival in GC patients. DElncRNAs, differentially expressed lncRNAs; DEmiRNAs, differentially expressed miRNAs; DEmRNAs, differentially expressed mRNAs; GC, gastric cancer.
lncRNA-based risk-scoring system for predicting GC prognosis
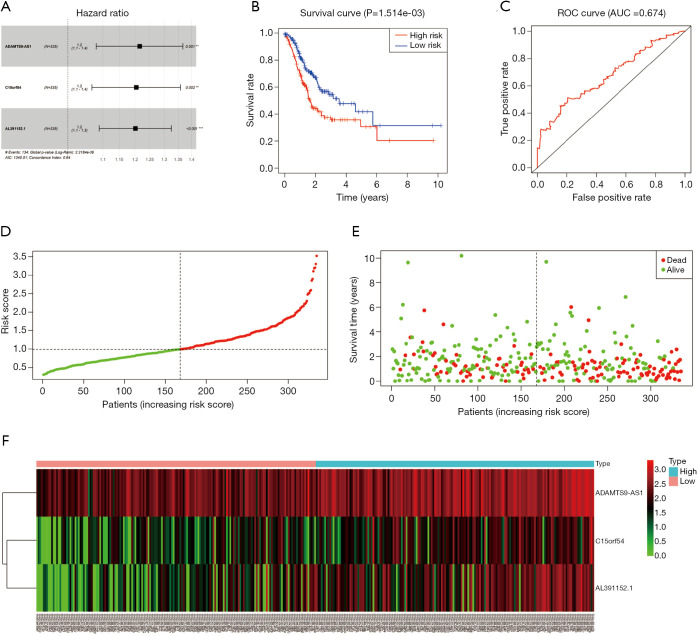
The results of univariate Cox regression analysis revealed that 4 lcnRNAs were significantly associated with GC prognosis (P<0.001). Of these, 3 lncRNAs (i.e., ADAMTS9-AS1, C15orf54, and AL391152.1) remained significant in multivariate Cox regression analysis, and were thus selected for the construction of the risk-scoring system. The system consisted of the following equation: risk score = (0.195259 × ADAMTS9-AS1 expression) + (0.186247 × C15orf54 expression) + (0.183688 × AL391152.1 expression). As shown in Table 3 and Figure 5A, the HR of ADAMTS9-AS1, C15orf54, and AL391152.1 was 1.2.
Table 3. Three lncRNAs correlated with overall survival in the predictive model.
| lncRNA | β | Hazard ratio | z | Pr(>|z|) |
|---|---|---|---|---|
| ADAMTS9-AS1 | 0.195259 | 1.215626 | 3.251301 | 0.001149 |
| C15orf54 | 0.186247 | 1.20472 | 3.033521 | 0.002417 |
| AL391152.1 | 0.183688 | 1.201641 | 3.672674 | 0.00024 |
Figure 5.
Risk scores of ADAMTS9-AS1, C15orf54, and AL391152.1 lncRNA-based prediction model. (A) Hazard ratio of the 3 lncRNAs involved in the risk-scoring system. (B) Kaplan-Meier curves for the prognosis of GC patients based on the 3 lncRNA signatures. (C) ROC curve of the 3 lncRNA-based prognostic signatures. (D) Distribution of risk score for each patient. (E) The risk score status of each patient. (F) Heat map of the 3 lncRNA-based prognostic signatures. ROC, receiver operating characteristic.
In order to explore the associations between prognostic lncRNAs and OS, survival curves were drawn using the Kaplan-Meier method (Figure 5B). The high-risk and low-risk groups consisted of 167 and 168 GC patients, respectively. The patients in the high-risk group exhibited significant shorter OS than those in the low-risk group (P=1.514e−03). The results indicate that the prognostic risk-scoring system based on these 3 lncRNAs were significantly related to OS.
Additionally, ROC curve analyses were implemented to assess the sensitivity and specificity of the risk-scoring system for predicting GC survival. The AUC value was calculated to be 0.674, with a concordance index (C-index) of 0.64 (95% CI: 0.59–0.69, P=2.806485e−08) (Figure 5C), suggesting that this risk-scoring system can effectively predict the prognosis of GC patients.
To demonstrate the distribution characteristics of the risk-scoring system, a heatmap plotting all of the individual risk scores was drawn (Figure 5D). The scatter plot and interactive distribution-based scatter plot for assessing the performance of the prognostic model are shown in Figure 5E,F, respectively.
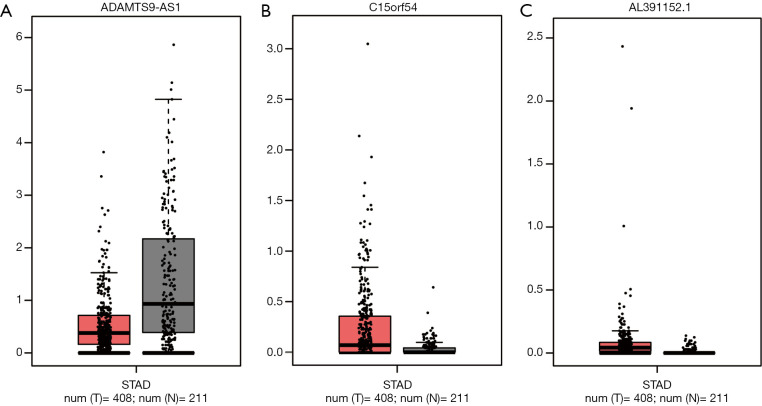
Furthermore, the expression of these 3 lncRNAs involved in the prognostic system were validated in GEPIA (Figure 6). The expression of ADAMTS9-AS1 was down-regulated in GC samples compared to normal tissues, while the expression of C15orf54 and AL391152.1 were up-regulated in GC samples, which were in concordance with our previous results. However, neither of these 3 lncRNAs expression levels were of statistical significance.
Figure 6.
Validation of the expression of ADAMTS9-AS1 (A), C15orf54 (B), and AL391152.1 (C) in Gene Expression Profiling Interactive Analysis database. STAD, stomach adenocarcinoma.
Association between the prognostic system and clinical characteristics
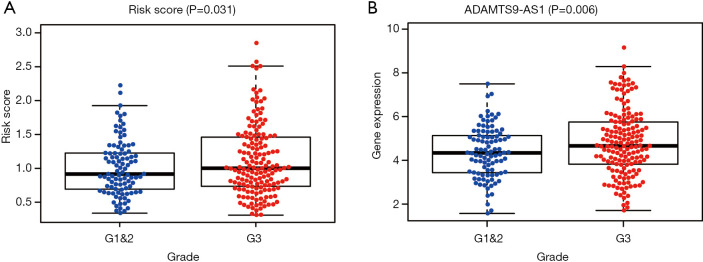
To further evaluate the clinical value of the prognostic system, correlations between the system and clinicopathological characteristics were analyzed. Our results shown that this prognostic system is positively associated with advanced tumor grade. Additionally, C15orf54 is also positively associated with high tumor grade (Figure 7).
Figure 7.
Association of the risk-scoring system with clinical characteristics. The risk-scoring system (A) and ADAMTS9-AS1 (B) were positively associated with advanced tumor grade.
The risk-scoring system based on 3 lncRNAs is an independent prognostic marker of GC
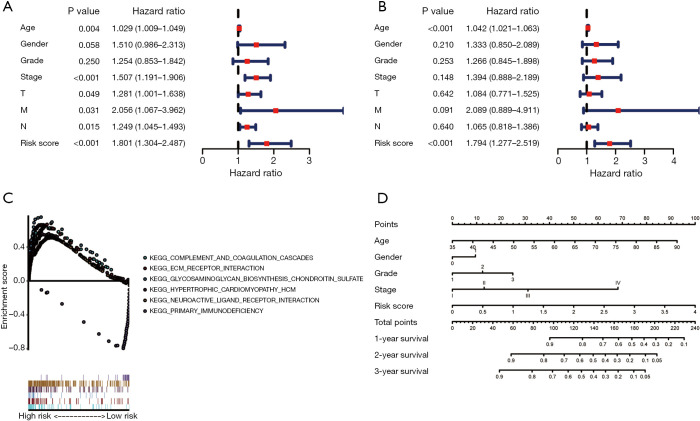
To clarify whether the prognostic ability of the risk-scoring system based on the 3 lncRNAs for survival prediction was independent of other clinical features, univariate and multivariate Cox regression analysis of the system with other clinical features (age, gender, pathological grade, stage, and T, N, M stage) were performed. In the univariate Cox regression analysis (Figure 8A), the risk score (HR =1.801, 95% CI: 1.034–2.478, P<0.01), together with age (HR =1.029, 95% CI: 1.009–1.049, P=0.04) and stage (HR =1.507, 95% CI: 1.191–1.906, P<0.001), were significantly associated with the OS of patients with GC. However, in the multivariate Cox regression (Figure 8B), only the risk score (HR =1.794, 95% CI: 1.277–2.519, P<0.001) and age (HR =1.042, 95% CI: 1.021–1.063, P<0.001) were significantly associated with the OS of patients with GC. These results demonstrate that the risk-scoring system based on the 3 lncRNAs was an independent prognostic factor for GC.
Figure 8.
Univariate (A) and multivariable (B) Cox regression analyses for independence assessment of the 3-lncRNAs based risk-scoring system. (C) Gene set enrichment Analyses (GSEA) for comparing enriched KEGG pathways between the high risk group and the low risk group. (D) Prognostic nomogram for overall survival in patients with GC. KEGG, Kyoto Encyclopedia of Genes and Genomes; GC, gastric cancer.
GSEA
GSEA were performed and 5 gene sets were enriched in the high risk group with statically significance, while only 1 gene set was enriched in the low risk group with statically significance (Figure 8C). The pathways enriched in the high risk group were: “KEGG_NEUROACTIVE_LIGADN_RECEPTOR_INTERACTION”, “KEGG_ ECM_RECEPTOR_INTERACTION”, “KEGG_GLYCOSAMINOGLYCAN_ BIOSYNTHESIS_CHONDROITIN_SULFATE”, “KEGG_COMPLEMENT_AND _COAGULATION_CASCADES”, and “KEGG_HYPERTROPHIC_ CARDIOMYOPATHY_HCM”. The pathway enriched in the low risk group was “KEGG_PRIMARY_IMMUNODEFICIENCY”.
Establishment of nomograms predicting prognosis in GC patients
Based on the results of independent risk factors on multivariate Cox regression analysis, a nomogram for the risk-scoring system (Figure 8D) combined with clinical features, including age, gender, pathological grade, and the stage, was established to visualize and predict GC patients’ survival rate probability. The performance of the model was measured by the C-index comparing the predicted OS. Each factor was assigned points according to its risk to survival. For example, if a 60-year-old (41 points) female patient (0 points), with grade 2 (11 points), stage II (12 points) disease, and a high-risk score (98 points), had a total of 162 points, then, her 1-year, 2-year, and 3-year survival would be about 60%, 28%, and 18%, respectively.
Discussion
Despite improvements in survival, the morbidity and mortality rates of GC remains high (1,6). Thus, the establishment of potential biomarkers and therapeutic targets as well as individualized approaches for treatment are urgently required. In the present work, a ceRNA network involving 62 DElncRNAs, 21 DEmiRNAs and 59 DEmRNAs, was constructed, in order to identify potential therapeutic targets and prognostic biomarkers for GC patients. In addition, 3 identified lncRNAs (i.e., ADAMTS9-AS1, C15orf54, and AL391152.1) were selected to construct a prognostic risk-scoring system for predicting the OS of GC patients. The AUC was considered good (0.674), along with a C-index of 0.64 (95% CI: 0.59–0.69, P=2.806485e−08). The scatter plot and interactive distribution-based scatter plot further demonstrated the high accuracy of the risk-scoring system. Both univariate and multivariate Cox regression independent analysis validated the predictive capability of the system. Furthermore, this risk-scoring system was positively associated with tumor grade. The expression of these 3 lncRNA were validated in GEPIA database. Our findings indicate that the risk-scoring system based on the 3 lncRNAs exhibited a robust ability to predict the prognosis of GC patients.
GSEA analyses results demonstrated that 5 gene sets are enriched in the high risk group with statically significance. Among them, neuroactive ligand receptor interaction pathway (24,25), ECM receptor interaction pathway (26), glycosaminoglycan biosynthesis chondroitin sulfate pathway (27) and complement and coagulation cascades pathway (28) were thought to be involved in tumorigenesis and progression, which further confirmed our results.
lncRNAs are known to play crucial roles in tumorigenesis and progression (7-9). Recently, some lncRNAs and lncRNA signatures have been identified as potential prognostic markers for GC. For example, Ma and colleagues reported a prognostic signature of 6-lncRNA in patients with GC based on microarray analysis (29). Through univariate and multivariate Cox regression analyses, Cai and colleagues identified 9 lncRNAs that were eventually filtered to construct a prognostic model, with AUC =0.795 (30). Accurate prognosis is the basis for developing appropriate treatment strategies for patients with cancer, therefore, considering clinical application values, the number of lncRNAs in the model should be as small as possible, with high prognostic evaluation value. The AUC values of the models proposed in the literature are higher than that proposed in our study; however, the number of lncRNAs involved in the present study is lower than in other studies, with AUC =0.674.
The hypothesis regarding ceRNA has allowed for a better understanding of the functions of lncRNAs (10). lncRNAs can bind and sequester miRNAs, and therefore control the expression of targeted genes (10,13-15). Previous studies also have constructed a ceRNA network and identified significant hub-genes for GC, and some of these studies have discovered potential biomarkers for GC (31-39). Among them, 5 studies have found and validated predictive RNA biomarkers in GC tissues (31-34). Liu et al. have reported that 3 lncRNAs (i.e., LINC00111, AP002478, and LINC00313) and 2 mRNAs (COL1A1 and MYB) can serve as prognostic biomarkers for patients with Helicobacter. pylori (+) (35). Zhang et al. have reported that 3 lncRNAs (i.e., UCA1, HOTTIP, and HMGA1P4) may contribute to the development and prognosis of GC, based on an analysis of Geno Expression Omnibus and TCGA database (37). However, all the biomarkers were not validated via independence assessment. Compared to these studies (29,31-36,38,39), we not only constructed a ceRNA network and identified a novel lncRNA based prognostic biomarker, but also validated that this lncRNA-based risk-scoring system is independent of other clinical features via using univariate and multivariate Cox independence analyses. Additionally, this risk-scoring system was positively associated with tumor grade, suggesting a potential of utilizing the system in GC diagnosis. A nomogram based on these 3 lncRNAs combined with other clinical information was generated to further predict the prognosis of GC patients, which can convenient for clinical use.
However, there were some limitations in our research. First, the expression and function of these 3 lncRNAs should be validated in tissue or cell experiments. Second, this 3-lncRNA based risk-scoring system must be validated in large-scale clinical GC specimens. Finally, whether this 3-lncRNA based risk-scoring system combined with other clinical features can increase the predictive power, based on AUC values, remains an interesting question.
Conclusions
The ceRNA network that we constructed provide novel insights into the tumorigenesis of GC. The risk-scoring system based on ADAMTS9-AS1, C15orf54 and AL391152.1 can be used to predict GC prognosis.
Acknowledgments
The authors would like to express their gratitude to Editage (https://www.editage.cn/) for the expert linguistics services provided.
Funding: This study was supported by the National Natural Science Foundation of China (81703916), Natural Science Foundation of Hunan Province (2018JJ6042), Hunan Provincial Health Department Project (B2015-78), Hunan Administration Traditional Chinese Medicine Foundation (201638), and Hunan Administration Traditional Chinese Medicine Foundation (201737).
Ethical Statement: The authors are accountable for all aspects of the work in ensuring that questions related to the accuracy or integrity of any part of the work are appropriately investigated and resolved. The present study was carried out in accordance with the TCGA guidelines (http://cancergenome.nih.gov/publications/publication guidelines). Thus, it was not necessary to obtain further ethical approval. The study was conducted in accordance with the Declaration of Helsinki (as revised in 2013).
Footnotes
Peer Review File: Available at http://dx.doi.org/10.21037/tcr-19-2977
Conflicts of Interest: All authors have completed the ICMJE uniform disclosure form (available at http://dx.doi.org/10.21037/tcr-19-2977). The authors report grants from National Natural Science Foundation of China, grants from Hunan Provincial Natural Science Foundation, grants from Hunan Provincial Health Department Project, grants from Hunan Administration Traditional Chinese Medicine Foundation, during the conduct of the study.
References
- 1.Bray F, Ferlay J, Soerjomataram I, et al. Global cancer statistics 2018: GLOBOCAN estimates of incidence and mortality worldwide for 36 cancers in 185 countries. CA Cancer J Clin 2018;68:394-424. 10.3322/caac.21492 [DOI] [PubMed] [Google Scholar]
- 2.Biagioni A, Skalamera I, Peri S, et al. Update on gastric cancer treatments and gene therapies. Cancer Metastasis Rev 2019;38:537-48. 10.1007/s10555-019-09803-7 [DOI] [PubMed] [Google Scholar]
- 3.Coutzac C, Pernot S, Chaput N, et al. Immunotherapy in advanced gastric cancer, is it the future? Crit Rev Oncol Hematol 2019;133:25-32. 10.1016/j.critrevonc.2018.10.007 [DOI] [PubMed] [Google Scholar]
- 4.Puhr HC, Preusser M, Prager G, et al. New Treatment Options for Advanced Gastroesophageal Tumours: Mature for the Current Practice? Cancers (Basel) 2020;12. [DOI] [PMC free article] [PubMed] [Google Scholar]
- 5.Matsuoka T, Yashiro M. Biomarkers of gastric cancer: Current topics and future perspective. World J Gastroenterol 2018;24:2818-32. 10.3748/wjg.v24.i26.2818 [DOI] [PMC free article] [PubMed] [Google Scholar]
- 6.Lordick F, Smyth EC. Two steps forward and one step back. Nat Rev Clin Oncol 2019;16:69-70. 10.1038/s41571-018-0154-4 [DOI] [PubMed] [Google Scholar]
- 7.Li Y, Egranov SD, Yang L, et al. Molecular mechanisms of long noncoding RNAs-mediated cancer metastasis. Genes Chromosomes Cancer 2019;58:200-7. 10.1002/gcc.22691 [DOI] [PMC free article] [PubMed] [Google Scholar]
- 8.Ramnarine VR, Kobelev M, Gibb EA, et al. The evolution of long noncoding RNA acceptance in prostate cancer initiation and progression, and its clinical utility in disease management. Eur Urol 2019;76:546-59. 10.1016/j.eururo.2019.07.040 [DOI] [PubMed] [Google Scholar]
- 9.Lim LJ, Wong SYS, Huang F, et al. Roles and Regulation of Long Noncoding RNAs in Hepatocellular Carcinoma. Cancer Res 2019;79:5131-9. 10.1158/0008-5472.CAN-19-0255 [DOI] [PubMed] [Google Scholar]
- 10.Salmena L, Poliseno L, Tay Y, et al. A ceRNA hypothesis: the Rosetta Stone of a hidden RNA language? Cell 2011;146:353-8. 10.1016/j.cell.2011.07.014 [DOI] [PMC free article] [PubMed] [Google Scholar]
- 11.Abdollahzadeh R, Daraei A, Mansoori Y, et al. Competing endogenous RNA (ceRNA) cross talk and language in ceRNA regulatory networks: A new look at hallmarks of breast cancer. J Cell Physiol 2019;234:10080-100. 10.1002/jcp.27941 [DOI] [PubMed] [Google Scholar]
- 12.Klec C, Prinz F, Pichler M. Involvement of the long noncoding RNA NEAT1 in carcinogenesis. Mol Oncol 2019;13:46-60. 10.1002/1878-0261.12404 [DOI] [PMC free article] [PubMed] [Google Scholar]
- 13.Xiao G, Yao J, Kong D, et al. The Long Noncoding RNA TTTY15, Which Is Located on the Y Chromosome, Promotes Prostate Cancer Progression by Sponging let-7. Eur Urol 2019;76:315-26. 10.1016/j.eururo.2018.11.012 [DOI] [PubMed] [Google Scholar]
- 14.Yang C, Shen S, Zheng X, et al. Long noncoding RNA HAGLR acts as a microRNA-143-5p sponge to regulate epithelial-mesenchymal transition and metastatic potential in esophageal cancer by regulating LAMP3. FASEB J 2019;33:10490-504. 10.1096/fj.201802543RR [DOI] [PubMed] [Google Scholar]
- 15.Zheng ZQ, Li ZX, Zhou GQ, et al. Long Noncoding RNA FAM225A Promotes Nasopharyngeal Carcinoma Tumorigenesis and Metastasis by Acting as ceRNA to Sponge miR-590-3p/miR-1275 and Upregulate ITGB3. Cancer Res 2019;79:4612-26. 10.1158/0008-5472.CAN-19-0799 [DOI] [PubMed] [Google Scholar]
- 16.Tomczak K, Czerwinska P, Wiznerowicz M. The Cancer Genome Atlas (TCGA): an immeasurable source of knowledge. Contemp Oncol (Pozn) 2015;19:A68-77. 10.5114/wo.2014.47136 [DOI] [PMC free article] [PubMed] [Google Scholar]
- 17.Jeggari A, Marks DS, Larsson E. miRcode: a map of putative microRNA target sites in the long non-coding transcriptome. Bioinformatics 2012;28:2062-3. 10.1093/bioinformatics/bts344 [DOI] [PMC free article] [PubMed] [Google Scholar]
- 18.Li JH, Liu S, Zhou H, et al. starBase v2.0: decoding miRNA-ceRNA, miRNA-ncRNA and protein-RNA interaction networks from large-scale CLIP-Seq data. Nucleic Acids Res 2014;42:D92-7. 10.1093/nar/gkt1248 [DOI] [PMC free article] [PubMed] [Google Scholar]
- 19.Chou CH, Chang NW, Shrestha S, et al. miRTarBase 2016: updates to the experimentally validated miRNA-target interactions database. Nucleic Acids Res 2016;44:D239-47. 10.1093/nar/gkv1258 [DOI] [PMC free article] [PubMed] [Google Scholar]
- 20.Wong N, Wang X. miRDB: an online resource for microRNA target prediction and functional annotations. Nucleic Acids Res 2015;43:D146-52. 10.1093/nar/gku1104 [DOI] [PMC free article] [PubMed] [Google Scholar]
- 21.Agarwal V, Bell GW, Nam JW, et al. Predicting effective microRNA target sites in mammalian mRNAs. Elife 2015;4. [DOI] [PMC free article] [PubMed] [Google Scholar]
- 22.Otasek D, Morris JH, Boucas J, et al. Cytoscape Automation: empowering workflow-based network analysis. Genome Biol 2019;20:185. 10.1186/s13059-019-1758-4 [DOI] [PMC free article] [PubMed] [Google Scholar]
- 23.Tang Z, Kang B, Li C, et al. GEPIA2: an enhanced web server for large-scale expression profiling and interactive analysis. Nucleic Acids Res 2019;47:W556-60. 10.1093/nar/gkz430 [DOI] [PMC free article] [PubMed] [Google Scholar]
- 24.Hong W, Yuan H, Gu Y, et al. Immune-related prognosis biomarkers associated with osteosarcoma microenvironment. Cancer Cell Int 2020;20:83. 10.1186/s12935-020-1165-7 [DOI] [PMC free article] [PubMed] [Google Scholar]
- 25.Shi K, Li N, Yang M, et al. Identification of Key Genes and Pathways in Female Lung Cancer Patients Who Never Smoked by a Bioinformatics Analysis. J Cancer 2019;10:51-60. 10.7150/jca.26908 [DOI] [PMC free article] [PubMed] [Google Scholar]
- 26.Bao Y, Wang L, Shi L, et al. Transcriptome profiling revealed multiple genes and ECM-receptor interaction pathways that may be associated with breast cancer. Cell Mol Biol Lett 2019;24:38. 10.1186/s11658-019-0162-0 [DOI] [PMC free article] [PubMed] [Google Scholar]
- 27.Morla S. Glycosaminoglycans and Glycosaminoglycan Mimetics in Cancer and Inflammation. Int J Mol Sci 2019;20. [DOI] [PMC free article] [PubMed] [Google Scholar]
- 28.Liu Y, Xiong S, Liu S, et al. Analysis of Gene Expression in Bladder Cancer: Possible Involvement of Mitosis and Complement and Coagulation Cascades Signaling Pathway. J Comput Biol 2020;27:987-98. 10.1089/cmb.2019.0237 [DOI] [PubMed] [Google Scholar]
- 29.Ma B, Li Y, Ren Y. Identification of a 6-lncRNA prognostic signature based on microarray re-annotation in gastric cancer. Cancer Med 2020;9:335-49. 10.1002/cam4.2621 [DOI] [PMC free article] [PubMed] [Google Scholar]
- 30.Cai C, Yang L, Tang Y, et al. Prediction of Overall Survival in Gastric Cancer Using a Nine-lncRNA. DNA Cell Biol 2019;38:1005-12. 10.1089/dna.2019.4832 [DOI] [PubMed] [Google Scholar]
- 31.Li CY, Liang GY, Yao WZ, et al. Integrated analysis of long non-coding RNA competing interactions reveals the potential role in progression of human gastric cancer. Int J Oncol 2016;48:1965-76. 10.3892/ijo.2016.3407 [DOI] [PubMed] [Google Scholar]
- 32.Chu A, Liu J, Yuan Y, et al. Comprehensive Analysis of Aberrantly Expressed ceRNA network in gastric cancer with and without H.pylori infection. J Cancer 2019;10:853-63. 10.7150/jca.27803 [DOI] [PMC free article] [PubMed] [Google Scholar]
- 33.Gu W, Ren JH, Zheng X, et al. Comprehensive analysis of expression profiles of long noncoding RNAs with associated ceRNA network involved in gastric cancer progression. Mol Med Rep 2019;20:2209-18. [DOI] [PMC free article] [PubMed] [Google Scholar]
- 34.Liu H, Zhang Z, Wu N, et al. Integrative Analysis of Dysregulated lncRNA-Associated ceRNA Network Reveals Functional lncRNAs in Gastric Cancer. Genes (Basel) 2018;9. [DOI] [PMC free article] [PubMed] [Google Scholar]
- 35.Liu Y, Zhu J, Ma X, et al. ceRNA network construction and comparison of gastric cancer with or without Helicobacter pylori infection. J Cell Physiol 2019;234:7128-40. 10.1002/jcp.27467 [DOI] [PubMed] [Google Scholar]
- 36.Yang J, Song H. Identification of long noncoding RNA RP11-169F17.1 and RP11-669N7.2 as novel prognostic biomarkers of stomach adenocarcinoma based on integrated bioinformatics analysis. Epigenomics 2019;11:1307-21. 10.2217/epi-2019-0115 [DOI] [PubMed] [Google Scholar]
- 37.Zhang X, Zhang W, Jiang Y, et al. Identification of functional lncRNAs in gastric cancer by integrative analysis of GEO and TCGA data. J Cell Biochem 2019;120:17898-911. 10.1002/jcb.29058 [DOI] [PubMed] [Google Scholar]
- 38.Peng S, Yin X, Zhang Y, et al. Competing endogenous RNA network analysis reveals potential long non-coding RNAs as predictive biomarkers of gastric cancer. Oncol Lett 2020;19:2185-96. [DOI] [PMC free article] [PubMed] [Google Scholar]
- 39.Qi M, Yu B, Yu H, et al. Integrated analysis of a ceRNA network reveals potential prognostic lncRNAs in gastric cancer. Cancer Med 2020;9:1798-817. 10.1002/cam4.2760 [DOI] [PMC free article] [PubMed] [Google Scholar]


