Abstract
Gastrointestinal clear cell sarcomas (GICCSs) are malignant mesenchymal tumour that occur in the wall of gastrointestinal tract, mostly in the ileum and rarely in the rectum. These tumours are highly invasive, and often have metastasized via the lymphatic system or bloodstream by the time of diagnosis. In this case, the patient was admitted for gastric fundus mass, who was subsequently found and confirmed by biopsy as clear cell sarcoma of rectum. Computed tomography (CT) and magnetic resonance imaging (MRI) showed multiple metastatic lesions in lymph node, lung, liver and bone. Furthermore, energy spectrum CT was used to confirm that the nature of gastric fundus mass and rectal lesion were consistent. So, this case may be multiple clear cell sarcomas in the rectum and stomach or clear cell sarcoma in the rectum with gastric fundus metastasis. Unfortunately, after several days of immunotherapy, the patient died due to abnormal liver function. At present, GICCS mainly relies on surgical resection, and the effect of radiotherapy and chemotherapy is not good. Therefore, how to find lesions as earlier as possible and make accurate diagnosis is particularly important. CT and MRI are essential examinations in the diagnosis of tumors. Whether they are helpful for the diagnosis of GICCS is the focus of our attention.
Keywords: Gastrointestinal clear cell sarcomas (GICCS), rectum, energy spectrum computed tomography (energy spectrum CT), case report
Introduction
GICCS and malignant gastrointestinal neuroectodermal tumours (GNETs) are collectively called GICCS-like tumours by some scholars, though it remains controversial as to whether these two should be regarded as different diseases or disease at different stages (1). Many tend to use the term “clear cell sarcoma” when the cells are positive for Melan-A, HMB45 or MITF and GNETs instead when these markers are negative. Previous studies (2,3) have focused on the clinical or pathological features of GICCS, while neglecting their imaging findings. This paper reports a case of rectal clear cell sarcoma, focusing on the CT and MRI images that differentiate it from other diseases, as well as highlighting the diagnostic value of energy spectrum CT. We present the following case in accordance with the CARE reporting checklist (available at http://dx.doi.org/10.21037/tcr-20-1771).
Case presentation
The patient, a 54-year-old female, was admitted in 2020-02-27 due to intermittent hematemesis for more than a month. Gastroscopy in the previous hospital showed a protruded mass in the gastric fundus, suggesting a gastrointestinal stromal tumour (GIST), though not confirmed by a biopsy.
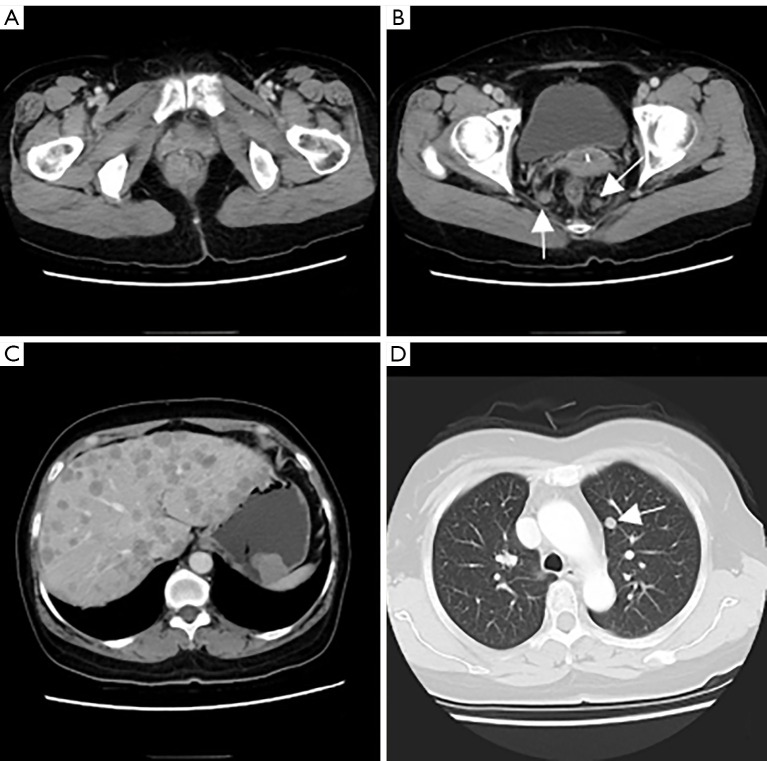
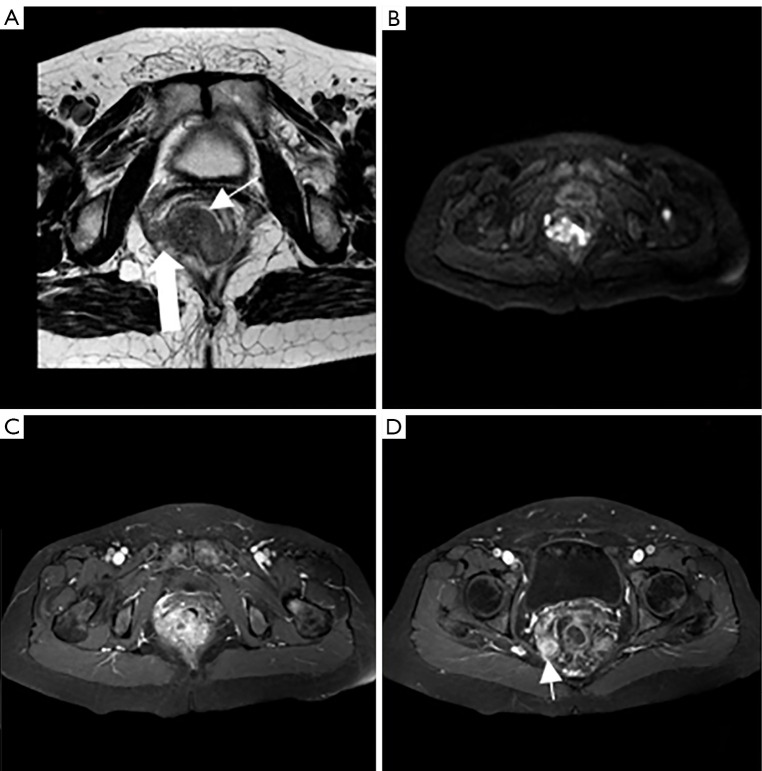
Physical examination: general condition was fair; a bulging mass, about 2 cm × 2 cm in size, could be perceived by palpation of the anal opening. Laboratory tests: faecal occult blood test (−); CEA, CA72-4, CA125, CA199, CA15-3, alpha-fetoprotein (AFP) were all within normal range. CT of chest and abdomen in 2020-03-02 (Figure 1): protruded mass in the gastric fundus, 2.2 cm × 2.8 cm in size, shallowly lobed, uneven in density, with a radio density of 40 HU in plain CT, about 68 HU in the arterial phase and about 65 HU in the venous phase of enhanced CT, indicating a GIST; mass inside and outside of the lower rectum with the enlarged mesenteric lymph nodes were dispersed around, 2.4 cm × 2.8 cm in size, irregularly shaped and without a clear boundary, uneven in density, with a radio density of 41 HU in plain CT and about 80 HU in the venous phase of enhanced CT; solid nodules in lungs and multiple circular enhanced nodules in the liver, both were considered to be metastatic tumours. Pelvic MRI in 2020-03-03 (Figure 2): submucosal mass in the lower rectum, with continuous mucosal membrane but involvement of the outer membrane and adjacent fat tissue, with a low and uneven T1 signal, a slightly higher and uneven T2 signal and a high and uneven diffusion-weighted imaging (DWI) signal that was unevenly enhanced, which indicated a malignant mesenchymal tumour; multiple enlarged lymph nodes in the mesorectum, with a high DWI signal and circular enhancement, suggesting a lymph node metastasis; multiple abnormal signals in the pelvic and upper femur, with a low T1 signal and a high fat-suppressed T2 signal, able to be enhanced, which suggested a bone metastasis.
Figure 1.
CT of chest and abdomen. (A) Mass inside and outside of the lower rectum that showed obviously enhancement; (B) enlarged mesenteric lymph nodes were dispersed around (arrows); (C) protruded mass in the gastric fundus which also showed obviously enhancement, multiple metastatic lesions of liver; (D) small nodule in the left upper lung (arrow). CT, computed tomography.
Figure 2.
Pelvic MRI. (A) Submucosal mass in the lower rectum, with continuous mucosal membrane (thin arrow) but involvement of the outer membrane and adjacent fat tissue (thick arrow); (B) diffusion-weighted-imaging presented high and uneven signal; (C) the mass was obviously uneven enhancement; (D) the mesenteric lymph node showed circular enhancement (arrow). MRI, magnetic resonance imaging.
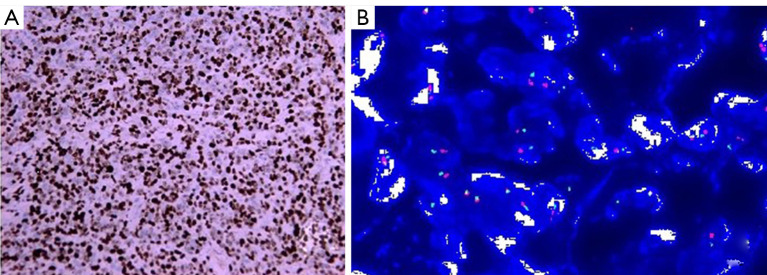
Rectal biopsy confirmed the diagnosis of GICCS (Figure 3). Liver aspiration confirmed a metastatic malignant tumour, with morphology and immunohistochemistry in line with the rectal biopsy.
Figure 3.
Rectal biopsy. (A) Immunohistochemistry (IHC) showed AE1/AE3(−), Vim(3+), CK7(−), CK19(−), CK20(−), p40(−), Syn(−), CgA(1+), S100(3+), SOX10(3+), Melan-A(3+), CD99(2+), Ki-67(70%); (B) fluorescence in situ hybridization (FISH) diagnosed EWSR1-rearrangement. IHC, ×200; FISH, ×400.
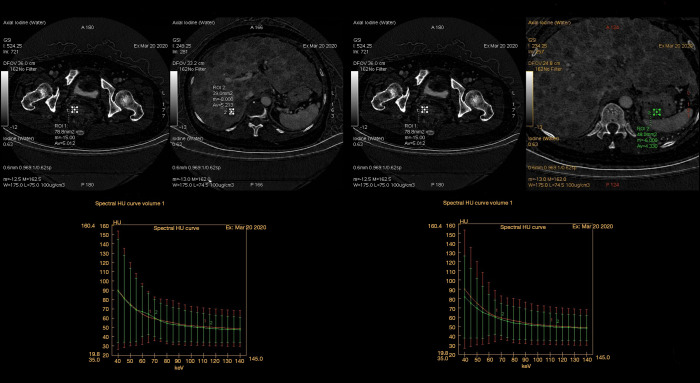
A multi-disciplinary discussion on 2020-03-19 suggested that the nature of gastric fundus lesions should be identified, but the patient refused to be examined again by gastroscope. Therefore, we performed abdomen energy spectrum CT on 2020-3-20 (Figure 4): the energy spectrum curves of gastric fundus, rectum and liver lesions were very close or almost overlapping each other, indicating that the nature of all three was consistent.
Figure 4.
Abdomen energy spectrum CT. (A) The energy spectrum curve of the liver metastatic lesion overlapped with that of the rectal mass; (B) the curve of gastric fundus mass was very similar to that of rectal lesion. CT, computed tomography.
The patient received toripalimab on 2020-3-27 at a dose of 240 mg and was discharged on 2020-3-30 and died in early April.
The timeline of the examination and treatment process after admission is listed in Figure 5. All procedures performed in studies involving human participants were in accordance with the ethical standards of the institutional and/or national research committee(s) and with the Helsinki Declaration (as revised in 2013). Written informed consent was obtained from the patient.
Figure 5.
The timeline of the examination and treatment process after admission. CT, computed tomography; MRI, magnetic resonance imaging; GICCS, gastrointestinal clear cell sarcoma.
Discussion
GICCS is a rare malignant tumour whose imaging features have not been well described, but the images of rectal mass in this case showed features distinct from common gastrointestinal tumours. Although initial CT was unable to identify the nature of rectal lesion, but pelvic MRI suggested that the tumour was in the submucosa of rectum, so rectal cancer could be excluded. A differential diagnosis is required for the following mesenchymal tumours. GIST, the images of which show mass of varying shapes inside and/or outside the intestinal lumen, may be even or uneven in density/signal, and can be obviously enhanced evenly or unevenly due to its adequate blood supply. The above features aligned with this case. However, a lymph node metastasis is rare in GIST cases (4). While the images from our case showed multiple enlarged and enhanced lymph nodes in the mesorectum, suggestive of metastases. Tashiro et al. (5) have studied 177 cases of GIST, yet only two cases (1.1%) were found to have a lymph node metastasis. So, we judged that rectal lesion of this case may not be a GIST. Intestinal lymphoma, despite thickening of the intestinal wall, was no significantly narrowing of the lumen due to a lack of hyperplasia of the fibrous connective tissue. Lymphoma rarely infiltrates directly into surrounding fat tissue (6,7) and often has a clear interface with it. The density/signal of CT or MRI tend to be even, the DWI/apparent diffusion coefficient (ADC) signal is significantly restricted, and can be mild to moderate evenly enhanced. In our case, the lesion caused intestinal stenosis, invaded adjacent fat tissue and showed an obviously uneven enhancement, thereby not meeting the criteria for a diagnosis of lymphoma.
In addition, although the lesion in the gastric fundus was not confirmed by a biopsy, both gastroscopy in the previous hospital and CT in our hospital suggested a GIST. This brought a huge psychological burden to the patient and greatly complicated the clinical treatment. After a multi-disciplinary discussion and thorough communication with the patient, we performed abdomen energy spectrum CT, in hope of obtaining more information from the energy-spectrum curve to aid in diagnosis and treatment. The energy spectrum curve is the attenuation of material or structure with the change of X-ray energy. From the point of view of physics, each kind of material has its characteristic energy spectrum curve. Xin et al. (8) showed that the slope of the energy spectrum curve of the thoracic exudate was greater than that of the thoracic effusion, but the two curves were similar in shape without crossover, indicating that they contained similar components but at different concentrations. We obtained energy spectrum curves of liver metastatic lesion and gastric fundus mass, and compared them with that of rectal mass. The energy spectrum curve of liver metastatic lesion overlapped with that of rectal mass, which was consistent with the pathological results. The curve of gastric fundus mass did not overlap with that of rectal lesion, but they were very similar, suggesting they were of the same structure or pathology.
This study also had some limitations, such as the failure to obtain the pathological results of gastric fundus mass due to patient resistance.
Conclusions
The imaging manifestations of GICCS are not only different from malignant epithelial tumors in the gastrointestinal tract, but also different from common mesenchymal tumors. According to current data, we think it is the most difficult to distinguish from GIST. Pathological confirmation is still needed (9). In addition, when patients are unwilling or unable to have multiple biopsies, energy spectrum CT is a good choice for homologous differentiation of masses.
Acknowledgments
Funding: None.
Ethical Statement: The authors are responsible for all aspects of the manuscript in ensuring that questions related to the integrity of any part of the work are appropriately investigated and resolved. All procedures performed in studies involving human participants were in accordance with the ethical standards of the institutional and/or national research committee(s) and with the Helsinki Declaration (as revised in 2013). Written informed consent was obtained from the patient for publication of this manuscript and any accompanying images.
Footnotes
Reporting Checklist: The authors have completed the CARE reporting checklist. Available at http://dx.doi.org/10.21037/tcr-20-1771
Conflicts of Interest: All authors have completed the ICMJE uniform disclosure form (available at http://dx.doi.org/10.21037/tcr-20-1771). The authors have no conflicts of interest to declare.
References
- 1.Green C, Spagnolo DV, Robbins PD, et al. Clear cell sarcoma of the gastrointestinal tract and malignant gastrointestinal neuroectodermal tumour: distinct or related entities? A review. Pathology 2018;50:490-8. 10.1016/j.pathol.2018.05.001 [DOI] [PubMed] [Google Scholar]
- 2.Libertini M, Thway K, Noujaim J, et al. Clear Cell Sarcoma-like Tumor of the Gastrointestinal Tract: Clinical Outcome and Pathologic Features of a Molecularly Characterized Tertiary Center Case Series. Anticancer Res 2018;38:1479-83. [DOI] [PubMed] [Google Scholar]
- 3.Washimi K, Takagi M, Hisaoka M, et al. Clear cell sarcoma-like tumor of the gastrointestinal tract: A clinicopathological review. Pathol Int 2017;67:534-6. 10.1111/pin.12573 [DOI] [PubMed] [Google Scholar]
- 4.Chinese Diagnosis and Treatment Experts Group for Gastrointestinal Stromal Tumors . Chinese Diagnosis and Treatment Experts Group for Gastrointestinal Stromal Tumors. Zhonghua Bing Li Xue Za Zhi 2009;38:697-702. [PubMed] [Google Scholar]
- 5.Tashiro T, Hasegawa T, Omatsu M, et al. Gastrointestinal stromal tumour of the stomach showing lymph node metastases. Histopathology 2005;47:438-9. 10.1111/j.1365-2559.2005.02133.x [DOI] [PubMed] [Google Scholar]
- 6.Nakamura S, Matsumoto T, Iida M, et al. Primary gastrointestinal lymphoma in Japan: a clinicopathologic analysis of 455 patients with special reference to its time trends. Cancer 2003;97:2462-73. 10.1002/cncr.11415 [DOI] [PubMed] [Google Scholar]
- 7.Hu LB, Zhao JN, Zhang A. Analysis of CT and MRI in Malignant Lymphoma of Intestinal Tract. J Clin Radiol 2010,29:634-7. [Google Scholar]
- 8.Xin XY, Zhu B, Chen JK, et al. The use of spectral CT imaging in characterization of pleural fluid: a new method to differentiate transudates from exudates. Chin J Radiol 2011;48:723-6. [Google Scholar]
- 9.WHO Classification of Tumours of the Digestive System . 5th Edition. 2019. [Google Scholar]


