Abstract
Background
Targeted metabolomics was utilized in case studies of non-small cell lung cancer (NSCLC) to develop and test metabolite classifiers in serum as potential biomarkers for new lung cancer diagnostic strategies, cancer staging, and subtype determination in the Chinese population.
Methods
A total of 77 samples, including 45 NSCLC patients from stage I to IV, and 32 healthy controls were included in this study. After serum extraction, metabolic assays based on a wide range of targeted metabolome technologies and the UPLC-MS-MS detection platform were performed to detect metabolites in them. Custom database and multivariate statistical analysis were utilized to evaluate the difference of metabolome between different arms.
Results
A total of 296 metabolites were detected in all samples, of which 81 were found differentially expressed among lung cancer patients and controls. While the principal component analysis indicated that the metabolome analysis is clearly powerful in differentiating lung cancer patients from normal controls, no significant differences in the serum metabolites between different lung cancer stages or between adenocarcinoma and squamous cell carcinoma were observed.
Conclusions
This study showed the power of the novel UPLC-MS/MS platform in serum metabolic profiling for the detection of NSCLC, which might provide new potential tumor biomarkers and can accelerate the development of new diagnostic strategies in NSCLC.
Keywords: Metabolomics, ultra-high-performance liquid chromatography-mass spectrometry/mass spectrometry (UPLC-MS/MS), non-small cell lung cancer (NSCLC)
Introduction
Lung cancer is the most prevalent cancer and the leading cause of cancer-related mortality in nowadays, comprising 17% of total new cancer cases and 23% of total cancer deaths worldwide (1). Due to the large smoking population, lung cancer has become the leading cancer diagnosed that is rapidly increasing for many years in China (2). Based on the microscopic difference in the tumor cell appearance, lung cancers are broadly classified into two types: small cell lung cancers (SCLC) and non-small cell lung cancers (NSCLC), with NSCLC accounting for approximately 80–85% of all cases. Since clinical manifestations of lung cancer, particularly SCLC often appear latent, nearly 70% patients are diagnosed at advanced stages with metastasis to other organs. Although considerable progress has been made in the treatment of advanced lung cancer in recent years, the prognosis still remains poor with a 10–15% of total 5-year survival rate. Contrary to the high fatality rate of advanced lung cancer, the cure rate for lung cancer at the early stage almost 100% effective. Therefore, early diagnosis of lung cancer remains to be of a paramount challenge and importance (3).
Tissue biopsies remain the gold standard of malignancy diagnosis, with the help of pathological morphology and biomarkers staining to determine different lung cancer subtypes. It is a standard practice currently to test for driver gene mutations either by fluorescent in-situ hybridization (FISH) or more recently next-generation sequencing (NGS). Nonetheless, due to the invasiveness and cumbersomeness nature of tissue biopsy, it only allows for a snapshot in time of the ever-evolving tumor biology (4). It may also miss important tumor characteristics owing to tumor heterogeneity. Furthermore, histopathological methods are insensitive to some early malignancies, leading to delays in the optimal timing for lung cancer treatment. The ideal test needs to include an accurate representation of the tumor biology and heterogeneity, in addition to being cost efficient, easily collectable, and operator independent.
Compared to the traditional biopsies, liquid biopsies as a source for tumor marker identification offer a minimally invasive, cost-effective and repeatable procedure for longitudinal disease profiling at the genomic, proteomic or metabolomic levels, and are gaining popularity (5). Emerging high throughput metabolomic technologies in a liquid biopsy can detect potential metabolic biomarkers associated with diseases and have been increasingly applied in the field of early diagnosis, estimation of treatment efficacy, and development of novel anti-cancer therapies (6,7). As the endpoint of the “-omics” cascades, metabolomics is the outcome of the concerted actions of overall cellular processes inside an organism, accurately reflecting the physiological state and pathological characteristics of the living system (8,9). Consequently, metabolic profiling provides a global analysis of endogenous metabolites of integrated living systems and their dynamic responses to changes of endogenous and exogenous factors, which builds the foundation for biomarker discovery and potential applications in early cancer diagnosis.
Altered energy metabolism is a hallmark of cancer cells, which was first discovered almost a century ago (10). It is well recognized nowadays that cancer cells primarily use aerobic glycolysis through reprogramming their energy production pathways even in the presence of oxygen (11), and glucose metabolism pathway has been targeted for cancer therapy (12). The oncogenesis of lung cancer, regulated by the ever-changing oncogenes and tumor suppressors such as K-ras and p53, results in a constantly changing of metabolites in tumor tissue and body fluids. Previous studies have found that up to 70 metabolites in lung cancer are differentially expressed in early diseases but have no correlation with disease progression, instilling new hopes in the early lung cancer diagnosis field (13-16). Compared with traditional diagnostic methods, even subtle changes of metabolites can help detect early pathologic changes more sensitively and specifically. Therefore, a state-of-the-art ultra-high-performance liquid chromatography-mass spectrometry/mass spectrometry (UPLC-MS/MS) platform was employed in this study, aiming to examine metabolite profiles for a comprehensive list of potential biomarkers and establish a diagnostic model from these metabolic biomarkers for NSCLC, using principal components analysis (PCA). A total of 296 metabolites were identified in 77 serum samples, including 45 NSCLC patients and 32 healthy controls. Among them, 48 were down-regulated and 33 were up-regulated in NSCLC patients. These data suggest that UPLC-MS/MS is a more sensitive technique for metabolic profiling in serum and significantly more metabolites can be detected than what have been previously reported in the literature. Overall, the ability to analyze metabolites using more sensitive methods represents a key factor in the accurate detection of biomarkers that are critical for future lung cancer diagnosis and therapy.
Methods
Study population
The project was approved by the ethics committee at Tongji Medical College, Huazhong University of Science and Technology [Decision: (2013)-No. S114]. Every participant was given a written informed consent for inclusion to the study. Forty-five lung cancer patients were recruited at Cancer Center of Union Hospital, Tongji Medical College, Huazhong University of Science and Technology. NSCLC diagnosis was conducted by the histopathological examination of tissues. Patients with a secondary tumor were excluded from the study. The cancer staging was confirmed based on the eighth edition of the TNM staging system. Thirty-two individuals in the control group without cancer or chronic metabolic diseases were recruited from subjects who underwent a routine periodic medical examination. Data regarding demographic and clinical characteristics of study participants are presented in Table 1.
Table 1. Patient characteristics.
| Samples | Serum | Stage (T/M/N) | Smoking status (yes/no) | Histological subtype |
|---|---|---|---|---|
| Total sample size, N | 77 | 46/21 | ||
| Healthy controls, N | 32 | 0/0/0 | 10/12 | Wild type |
| Cancer cases, N | 45 | 19/17/9 | 36/9 | EGFR/ALK/ROS-1/CMET/TTF1 |
| By stage (%) | – | |||
| I | 22.9% | 3/5/3 | 9/2 | EGFR/ALK/ROS-1 |
| II | 14.3% | 3/1/2 | 6/0 | EGFR/ALK |
| III | 31.4% | 4/4/6 | 11/3 | ALK/ROS-1/CMET |
| IV | 31.4% | 5/6/3 | 9/5 | EGFR/ALK/TTF1 |
| Gender, N (male/female) | – | – | – | |
| Controls | 20/12 | – | – | |
| Cancer cases | 30/15 | – | – | |
| Age (years) | – | |||
| Controls | 32–65 | 0/0/0 | 10/12 | – |
| Cancer cases | 50–60 | 19/17/9 | 36/9 | – |
Sample collection and preparation
The sera were collected in the same manner from both groups of subjects (cancer patients and controls) in the morning. For sample preparation, the following procedure was used. Samples were removed from the −80 °C freezer and thawed at 4 °C. 100 µL of each of the thawed samples was placed in an EP tube, mixed with 300 µL of methanol, and vortexed for 3 min. After centrifugation at 12,000 rpm for 10 min at 4 °C, the supernatant was transferred to a new EP tube and centrifuged at 12,000 rpm for 3 min at 4 °C to further precipitate proteins. Finally, the supernatant was aspirated and stored in a vial for LC-MS/MS analysis. Aliquots of sample extracts representing different groups were pooled and taken as Quality Control (QC) samples.
Chromatography mass spectrometry (MS) analysis
UPLC (Shim-pack UFLC SHIMADZU CBM30A) and tandem mass spectrometry [MS/MS (Applied Biosystems 4500 QTRAP)] were used to study metabolite profiling in this study. The UPLC setup is as follows: (I) column: waters ACQUITY UPLC HSS T3 C18 1.8 µm, 2.1 mm × 100 mm; (II) phase A: ultrapure water (0.04% acetic acid) and phase B: acetonitrile (0.04% acetic acid); (III) the elution gradient is 0 min water/acetonitrile at 95: 5 V/95: 5 V/V at 12.0 min, 95: 5 V/V at 12.1 min, and 95: 5 V/V at 15.0 min; Sample volume is 5 µL. MS conditions mainly include: electrospray ionization (ESI) at 550 °C, MS voltage at 5,500 V, curtain gas (CUR) at 25 psi, and collision-activated dissociation (CAD) parameter set to high. In Qtrap, each ion pair is scanned according to optimized declustering potential (DP) and collision energy (CE) (17).
Metabolite profiling
The metabolite identification was based on spectral deconvolution of both primary and secondary fragment ion patterns using our custom-built database of MWDB (metware database). Isotopic signals, repetitive signals containing K+ ions, Na+ ions, NH4+ ions, as well as other larger molecule ion fragments, were removed to ensure quality and reliability of acquired data for selected metabolites. Public databases of MassBank (http://www.massbank.jp/), KNAPSAcK (http://kanaya.naist.jp/KNApSAcK/), Human Metabolome Database (HMDB, http://www.hmdb.ca/), MoTo DB (http://www.ab.wur.nl/moto/) and METLIN (http://metlin.scripps.edu/index.php) were also used as reference for metabolite structural analysis (18,19).
Multiple reaction monitoring (MRM) analysis of metabolite triple quadrupole MS was used for accurate quantitative analysis. In the MRM mode, the quadrupole rod first screened out precursor ion (parention) of the target substance and fragmented it. The corrupted ions were then filtered through the triple quadrupole to obtain the MS data that were subsequently processed by Analyst 1.6.1. The MRM metabolite detection multimodal graph shows the detectable substances in samples. The mass spectrum files of the samples were opened by MultiaQuant to integrate and correct the chromatographic peaks. Peak area (area) of each chromatogram represents the relative content of the corresponding substances. The scanning state was used, using known standards to the explicitly stated and the assessment of the mass accuracy of the instrument. And by this analytical standard, the metabolites that were found to be significantly different (20).
KEGG (Kyoto Encyclopedia of Genes and Genomes) data analysis
The metabolite contents were normalized using the range method. Hierarchical cluster analysis (HCA) was used to compare the accumulation patterns of metabolites between different samples by software R (www.r-project.org/). Pearson’s correlation coefficient analysis was applied to assess the correlation between samples to determine the biological repeatability. The X array information was decomposed and grouped into the Y-related and unrelated categories by the method of orthogonal partial least squares discriminant analysis (OPLS-DA), combined with orthogonal signal correction (OSC) and partial least squares discriminant analysis (PLS-DA). Metabolites that were identified with irrelevant difference between different sample groups were removed and these with significant difference were annotated in Kyoto Encyclopedia of Genes and Genomes (KEGG) database. KEGG is an important public pathway-related database used for performing pathway enrichment analysis. The total number of genes with KEGG annotation, “n” represents the total number of DESs target genes in N, “M” represents the total number of genes annotated by specific pathways, and ‘m’ depicts the number of DESs target genes in MFunctional enrichments were tested using a two tailed Fisher’s exact test, and a corrected P value <0.05 was considered significant.
Statistical analysis
Statistical analysis was performed with SPSS 12.0. Data are expressed as the mean ± SD from at least three independent experiments. The difference between groups was analyzed using Student’s t-test when comparing only two groups or one-way analysis of variance when comparing more than two groups. P values of <0.05 was considered statistically significant.
Results
Principal component analysis (PCA) of total samples
Based on the multimodal images of MRM metabolites and the local metabolic database, a total of 296 metabolites were identified and quantitatively analyzed from 45 NSCLC patient and 32 normal control serum samples. Quality control samples (QC) are prepared by random mixing of normal control and patient sample extracts. Instrument stability and data repeatability and reliability were confirmed by total ion chromatogram (TIC) analysis with different QC samples.
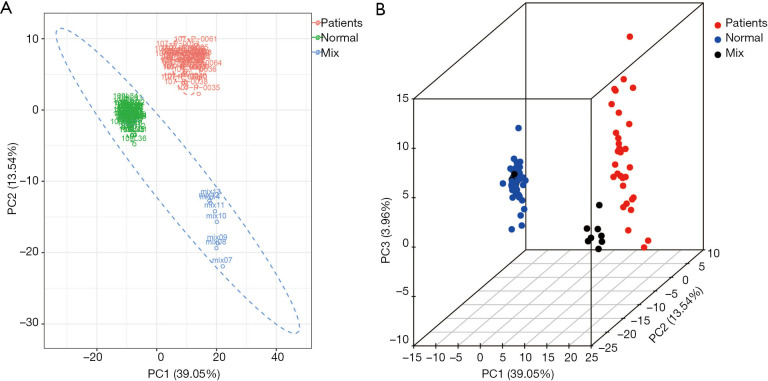
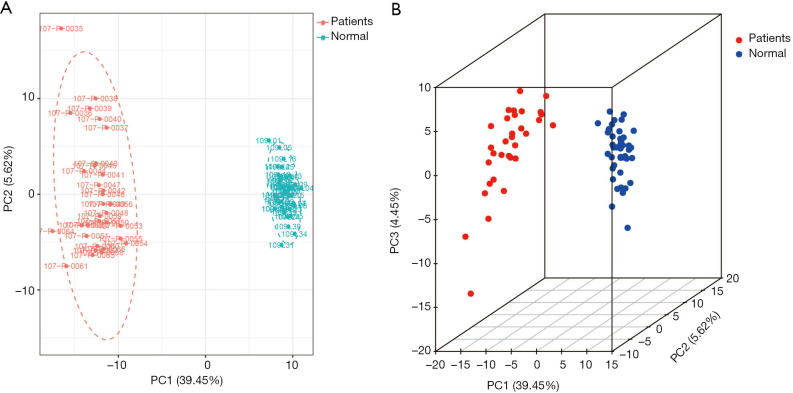
The PCA of all samples was used to initially analyze the overall metabolic differences between normal and lung cancer patients as well as the variability within the normal and lung cancer patient groups. Figure 1 shows that in terms of the principal components, group 1 (patient), group 2 (normal), and group 3 (mixed group 1 and 2 samples) are clearly distinguishable. The intragroup two PCA showed that although individuals within the lung cancer group had larger differences compared to individuals within the normal control group, no obvious clustering pattern can be observed in the lung cancer group (Figure 2).
Figure 1.
Principal component analysis showed high discrimination accuracy between NSCLC patients, healthy controls and the group mix. Group mix is used as the quality control sample (A) 2D plot, NSCLC patients: Red, healthy controls: green, mix group: blue; (B) 3D plot, NSCLC patients: red, healthy controls: blue, mix group: black. NSCLC, non-small cell lung cancer.
Figure 2.
The intragroup two principal components analysis showed that although individuals within the lung cancer NSCLC group (red) had larger differences compared to individuals within the normal healthy control group (blue), no obvious clustering pattern can be observed. (A) 2D plot and (B) 3D plot. NSCLC, non-small cell lung cancer.
Cluster analysis
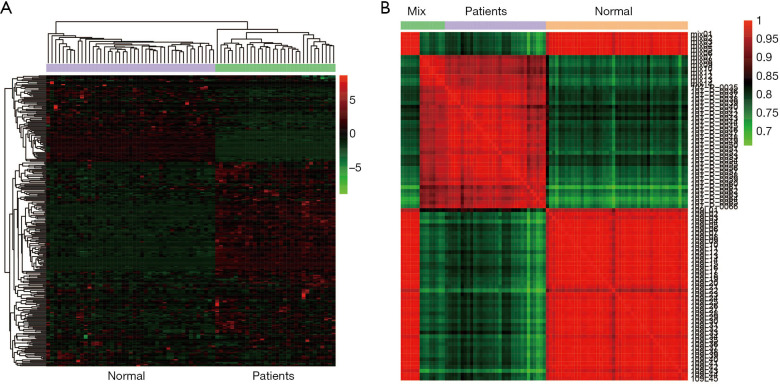
Cluster analysis was performed and the results indicated that the metabolites between the two groups of normal and lung cancer patients can be clearly distinguished from each other, while the metabolites in each sample within the group have high homogeneity (Figure 3A). Pearson correlation coefficient analysis showed a high correlation between different groups (Figure 3B).
Figure 3.
Cluster analysis of the metabolites between normal and lung cancer patients. (A) Heat map of significant metabolites reveals metabolic signatures of NSCLC and healthy controls groups; (B) the biological duplication between samples within the group was observed by correlation analysis. NSCLC, non-small cell lung cancer.
Differential metabolites screening
Metabolite variables driven the discrimination between normal and lung cancer patient groups were extracted with the OPLS-DA method combined with orthonormal signal correction (OSC) and PLS-DA. Variables of less relevance or irrelevance were effectively removed. PCA with identified metabolite variables by the OPLS-DA model analysis showed effective separation of the normal and lung cancer patient groups (Figure 4A).
Figure 4.
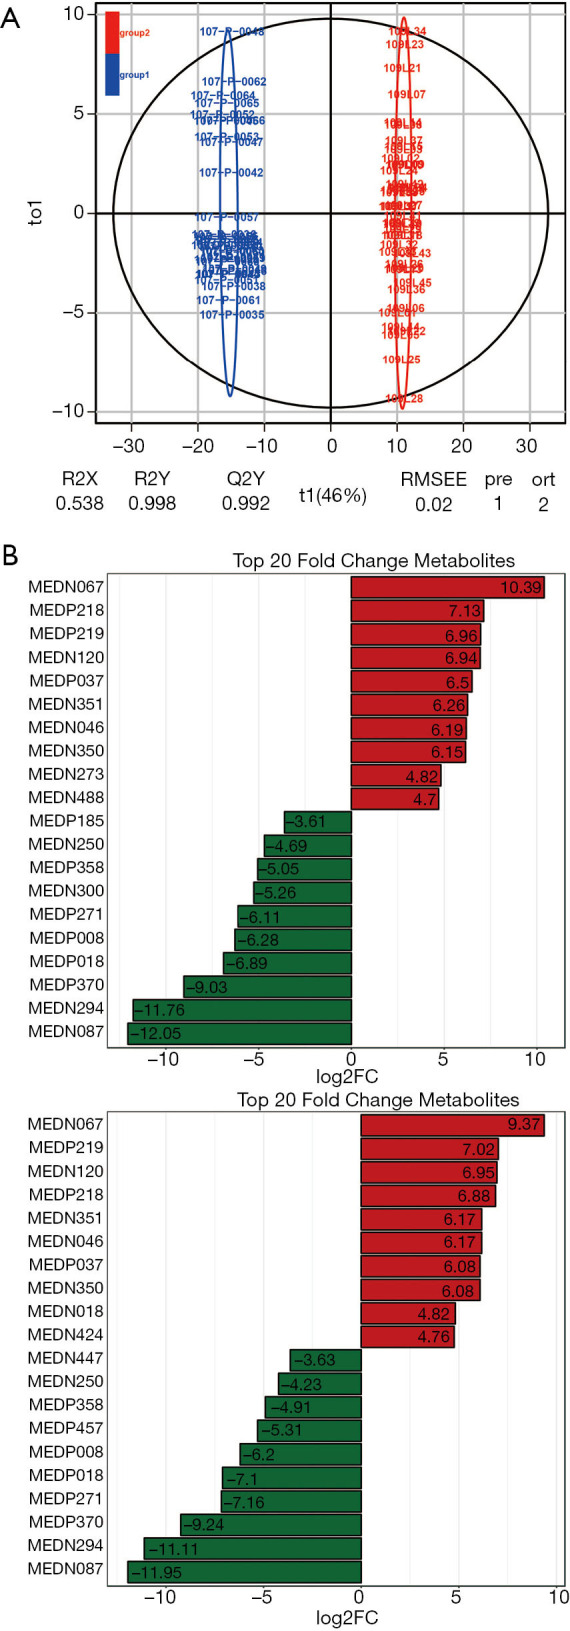
Differential metabolites screening. (A) OPLS-DA, orthogonal projections to latent structures discriminant analysis (B) histogram of top differential metabolites.
Significantly different metabolites (VIP ≥1) were identified from normal and lung cancer patients. Twenty-three were up-regulated (fold change >2), 48 were downregulated (fold change <0.5) and 215 showed no significant difference. The ten most upregulated and downregulated metabolites were plotted in Figure 4B.
KEGG enrichment analysis
Metabolites were first classified into carbohydrates, lipids, nucleotides, and amino groups and KEGG was used for the visualization and functional analysis of metabolite data at the system level. Differential metabolites were annotated according to the signal pathways and displayed according to the ratio of the number of metabolites in a pathway to the total number of annotated metabolites (Figure 5). Among these, 72.09% belongs to metabolic pathways. Bile secretion and protein digestion and absorption account for 16.28% and 13.95% respectively in organism systems. ABC transporters (20.93%) takes the highest proportion in the environmental information processing group. The gap junction accounted for 6.98% in cellular processes, etc.
Figure 5.
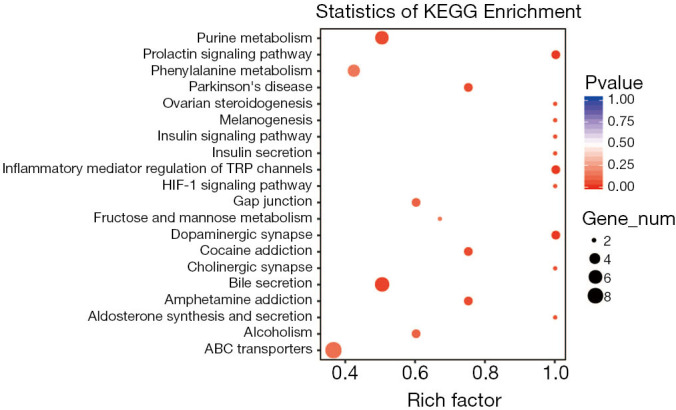
MSEA was implemented to evaluate metabolic pathway enrichment among the NSCLC and healthy controls groups. Results indicated that several pathways including the purine metabolism, prolactin signaling pathway, phenylalanine metabolism, bile secretion, ABC transporters pathway are significantly associated with the disease. NSCLC, non-small cell lung cancer; ABC, ATP-binding cassette.
Discussion
With the application of genomics, transcriptomics and proteomics in oncology and clinical medicine, more therapeutic and diagnostic molecular targets have been discovered. Metabonomics can effectively detect changes in metabolites as a result of altered protein expression or gene mutations, and were shown to effectively detect metabolites in patients with NSCLC (21,22). In this study, based on an optimized UPLC-MS/MS platform and custom-built databases, a total of 296 metabolites were identified using targeted metabonomics techniques, among which a total of 48 is down-regulated and 33 is up-regulated. By PCA with either total or differential metabolites, NSCLC patients and normal control can be effectively separated into two distinct clusters, indicating that metabonomics can be a highly efficient and reliable tool for lung cancer diagnosis, while in contrast, clustering within the patient groups is not obvious, suggesting that metabonomics cannot be used for cancer staging. In addition, the number of samples we selected for this project is not very large, which is our limitation.
To maintain high proliferation rate and metastatic nature, tumor cells need to absorb and synthesize a large number of nucleosides, amino acids, lipids and other molecules constantly. Changes in levels of these metabolites reflect changes in many related signaling pathways (23). In this study, KEGG annotation analysis of the differentially selected metabolites identified significant changes in pathways involved in energy production and protein and nucleic acid synthesis. ATP-binding cassette (ABC) transporter, purine metabolism, and phenylalanine metabolism are just a few of these pathways that are differentially regulated in NSCLC patients and normal controls.
ABC transporters are a family of membrane-bound transport proteins that couple the energy of ATP hydrolysis to the movement of various substrates across biological membranes. They play important roles in a large variety of processes including membrane lipid composition, efflux and redistribution of structural phospholipids, and cellular steroid synthesis (24). Sterols are a key component in maintaining the lipid raft structure of cell membranes. The lipid rafts are key sites in cell membranes that anchor and polymerize signaling protein molecules, affecting signal transduction (25). Sterols also affect the utilization of fatty acids such as cholesterol and arachidonic acid, etc. in cells, exerting effects on downstream signaling pathways. In the current study, we found that cholesterol and arachidonic acid levels were significantly lower in the NSCLC patients than that in the normal group, suggestive of a link between fatty acid metabolism and ABC transporter function. ABC transporters have been reported to be associated with prostaglandin E2 (PGE2). PGE2 is closely related to the occurrence and development of tumors (26-28). From the perspective of tumor immunity, PGE2 increases the expression of COX2 and induces high expression of IDO1. IDO1 can inhibit the function of tumor-associated killer T cells and regulatory T cells in turn, creating an immunosuppressive environment around the tumor (29). Therefore, it might make sense to discover new targets for tumor immunotherapy and diagnosis from the perspective of metabolomics.
Purine is an important precursor for essential cellular processes such as DNA replication and RNA transcription and therefore tightly regulated through a variety of signaling pathways in the cell (30). Tumor growth requires a large amount of purines that can be released by “purinosomes”, multiple enzyme complexes formed around mitochondria and microtubules (31). Our metabolomic study indicated that several important purine metabolites such as cytidine and hypoxanthine are decreased in serum of NSCLC patients, suggestive of consumption of these small molecular metabolites by tumor cells in order to proliferate. On the other hand, β-nicotinamide mononucleotide is found up-regulated in NSCLC patients. Previous report suggests that this small molecule is a metabolic intermediate of NAD+ and is closely related to type 2 diabetes, with a major function in regulating and repairing oxidative stress. At the same time β-nicotinamide mononucleotide can also improve the utilization of glucose and lipid. Therefore, β-nicotinamide mononucleotide may be used as a diagnostic marker for NSCLC, providing reference value for later diagnosis (32).
We also found that the level of tyrosine was significantly reduced in sera of NSCLC patients. Changes in tyrosine in the sera, urine, and tissues of patients with gastric cancer have been reported in 13 studies before (33). Our study supports a role of tyrosine as a diagnostic target for NSCLC. This study also found changes in D-methionine and L-glutamine that may be worth further studying.
More additional metabolites are detected as differentially expressed with our optimized UPLC-MS/MS platform. Most are derivatives of some organic acids including N-Acetylneuraminic Acid, Trans-4-Hydroxy-L-Proline, N'-Formylkynurenine, N-Phenylacetylglycine, 2-Methylsuccinic acid, Dl-P-Hydroxyphenyllactic acid, L-Homoserine, L-Pipecolic acid and 4-Hydroxy-3-Methoxymandelate. Some are amino acid derivatives including N-Acetylneuraminic Acid, Phe-Phe, Trans-4-Hydroxy-L-Proline, 1-Methyladenosine, N-Phenylacetylglycine, Β-Nicotinamide Mononucleotide, N-Acetylglycine, and a few are nuceloside derivatives inluding 1-Methyladenosine, Β-Nicotinamide Mononucleotide and Hypoxanthine-9-β-D-Arabinofuranoside. The role of these derivatives such as the amino acid derivatives in cancer has never been reported and needs further experimental validation as potential diagnostic biomarkers.
Acknowledgments
Funding: None.
Ethical Statement: The authors are accountable for all aspects of the work in ensuring that questions related to the accuracy or integrity of any part of the work are appropriately investigated and resolved. The study was conducted in accordance with the Declaration of Helsinki (as revised in 2013). The project was approved by the ethics committee at Tongji Medical College, Huazhong University of Science and Technology [Decision: (2013)-No. S114]. Every participant was given a written informed consent for inclusion to the study.
Footnotes
Conflicts of Interest: All authors have completed the ICMJE uniform disclosure form (available at http://dx.doi.org/10.21037/tcr.2019.09.62). The authors have no conflicts of interest to declare.
References
- 1.Jemal A, Bray F, Center MM, et al. Global cancer statistics. CA Cancer J Clin 2011;61:69-90. 10.3322/caac.20107 [DOI] [PubMed] [Google Scholar]
- 2.Chen W, Zheng R, Zeng H, et al. Epidemiology of lung cancer in China. Thorac Cancer 2015;6:209-15. 10.1111/1759-7714.12169 [DOI] [PMC free article] [PubMed] [Google Scholar]
- 3.Mulshine JL, Sullivan DC. Clinical practice. Lung cancer screening. N Engl J Med 2005;352:2714-20. 10.1056/NEJMcp042630 [DOI] [PubMed] [Google Scholar]
- 4.Mamdani H, Ahmed S, Armstrong S, et al. Blood-based tumor biomarkers in lung cancer for detection and treatment. Transl Lung Cancer Res 2017;6:648-60. 10.21037/tlcr.2017.09.03 [DOI] [PMC free article] [PubMed] [Google Scholar]
- 5.Marrugo-Ramírez J, Mir M, Samitier J. Blood-Based Cancer Biomarkers in Liquid Biopsy: A Promising Non-Invasive Alternative to Tissue Biopsy. Int J Mol Sci 2018. doi: . 10.3390/ijms19102877 [DOI] [PMC free article] [PubMed] [Google Scholar]
- 6.Griffin JL, Pole JC, Nicholson JK, et al. Cellular environment of metabolites and a metabonomic study of tamoxifen in endometrial cells using gradient high resolution magic angle spinning 1H NMR spectroscopy. Biochim Biophys Acta 2003;1619:151-8. 10.1016/S0304-4165(02)00475-0 [DOI] [PubMed] [Google Scholar]
- 7.Klupczynska A, Derezinski P, Garrett TJ, et al. Study of early stage non-small-cell lung cancer using Orbitrap-based global serum metabolomics. J Cancer Res Clin Oncol 2017;143:649-59. 10.1007/s00432-017-2347-0 [DOI] [PMC free article] [PubMed] [Google Scholar]
- 8.Weiss RH, Kim K. Metabolomics in the study of kidney diseases. Nat Rev Nephrol 2011;8:22-33. 10.1038/nrneph.2011.152 [DOI] [PubMed] [Google Scholar]
- 9.Dettmer K, Aronov PA, Hammock BD. Mass spectrometry-based metabolomics. Mass Spectrom Rev 2007;26:51-78. 10.1002/mas.20108 [DOI] [PMC free article] [PubMed] [Google Scholar]
- 10.Warburg O, Wind F, Negelein E. The Metabolism of Tumors in the Body. J Gen Physiol 1927;8:519-30. 10.1085/jgp.8.6.519 [DOI] [PMC free article] [PubMed] [Google Scholar]
- 11.Cairns RA, Harris IS, Mak TW. Regulation of cancer cell metabolism. Nat Rev Cancer 2011;11:85-95. 10.1038/nrc2981 [DOI] [PubMed] [Google Scholar]
- 12.Hamanaka RB, Chandel NS. Targeting glucose metabolism for cancer therapy. J Exp Med 2012;209:211-5. 10.1084/jem.20120162 [DOI] [PMC free article] [PubMed] [Google Scholar]
- 13.Lokhov PG, Trifonova OP, Maslov DL, et al. Blood plasma metabolites and the risk of developing lung cancer in Russia. Eur J Cancer Prev 2013;22:335-41. 10.1097/CEJ.0b013e32835b3898 [DOI] [PubMed] [Google Scholar]
- 14.Hori S, Nishiumi S, Kobayashi K, et al. A metabolomic approach to lung cancer. Lung Cancer 2011;74:284-92. 10.1016/j.lungcan.2011.02.008 [DOI] [PubMed] [Google Scholar]
- 15.Fahrmann JF, Kim K, DeFelice BC, et al. Investigation of metabolomic blood biomarkers for detection of adenocarcinoma lung cancer. Cancer Epidemiol Biomarkers Prev 2015;24:1716-23. 10.1158/1055-9965.EPI-15-0427 [DOI] [PMC free article] [PubMed] [Google Scholar]
- 16.Miyamoto S, Taylor SL, Barupal DK, et al. Systemic Metabolomic Changes in Blood Samples of Lung Cancer Patients Identified by Gas Chromatography Time-of-Flight Mass Spectrometry. Metabolites 2015;5:192-210. 10.3390/metabo5020192 [DOI] [PMC free article] [PubMed] [Google Scholar]
- 17.Chen W, Gong L, Guo Z, et al. A novel integrated method for large-scale detection, identification, and quantification of widely targeted metabolites: application in the study of rice metabolomics. Mol Plant 2013;6:1769-80. 10.1093/mp/sst080 [DOI] [PubMed] [Google Scholar]
- 18.Fraga CG, Clowers BH, Moore RJ, et al. Signature-Discovery Approach for Sample Matching of a Nerve-Agent Precursor Using Liquid Chromatography-Mass Spectrometry, XCMS, and Chemometrics. Anal Chem 2010;82:4165-73. 10.1021/ac1003568 [DOI] [PubMed] [Google Scholar]
- 19.Eriksson L, Byrne T, Johansson E, et al. Multi- and Megavariate Data Analysis. Part I Basic Principles and Applications. Available online: https://umetrics.com/sites/default/files/books/sample_chapters/mvda_third_edition_chapter_18.pdf
- 20.Chen Y, Zhang R, Song Y, et al. RRLC-MS/MS-based metabonomics combined with in-depth analysis of metabolic correlation network: finding potential biomarkers for breast cancer. Analyst 2009;134:2003-11. 10.1039/b907243h [DOI] [PubMed] [Google Scholar]
- 21.O'Shea K, Cameron SJ, Lewis KE, et al. Metabolomic-based biomarker discovery for non-invasive lung cancer screening: A case study. Biochim Biophys Acta 2016;1860:2682-7. 10.1016/j.bbagen.2016.07.007 [DOI] [PubMed] [Google Scholar]
- 22.Musharraf SG, Mazhar S, Choudhary MI, et al. Plasma metabolite profiling and chemometric analyses of lung cancer along with three controls through gas chromatography-mass spectrometry. Sci Rep 2015;5:8607. 10.1038/srep08607 [DOI] [PMC free article] [PubMed] [Google Scholar]
- 23.Marien E, Meister M, Muley T, et al. Non-small cell lung cancer is characterized by dramatic changes in phospholipid profiles. Int J Cancer 2015;137:1539-48. 10.1002/ijc.29517 [DOI] [PMC free article] [PubMed] [Google Scholar]
- 24.Fletcher JI, Haber M, Henderson MJ, et al. ABC transporters in cancer: more than just drug efflux pumps. Nat Rev Cancer 2010;10:147-56. 10.1038/nrc2789 [DOI] [PubMed] [Google Scholar]
- 25.Zhuang L, Kim J, Adam RM, et al. Cholesterol targeting alters lipid raft composition and cell survival in prostate cancer cells and xenografts. J Clin Invest 2005;115:959-68. 10.1172/JCI200519935 [DOI] [PMC free article] [PubMed] [Google Scholar]
- 26.Reid G, Wielinga P, Zelcer N, et al. The human multidrug resistance protein MRP4 functions as a prostaglandin efflux transporter and is inhibited by nonsteroidal antiinflammatory drugs. Proc Natl Acad Sci U S A 2003;100:9244-9. 10.1073/pnas.1033060100 [DOI] [PMC free article] [PubMed] [Google Scholar]
- 27.Rius M, Thon WF, Keppler D, et al. Prostanoid transport by multidrug resistance protein 4 (MRP4/ABCC4) localized in tissues of the human urogenital tract. J Urol 2005;174:2409-14. 10.1097/01.ju.0000180411.03808.cb [DOI] [PubMed] [Google Scholar]
- 28.de Waart DR, Paulusma CC, Kunne C, et al. Multidrug resistance associated protein 2 mediates transport of prostaglandin E2. Liver Int 2006;26:362-8. 10.1111/j.1478-3231.2005.01234.x [DOI] [PubMed] [Google Scholar]
- 29.Spranger S, Spaapen RM, Zha Y, et al. Up-regulation of PD-L1, IDO, and T(regs) in the melanoma tumor microenvironment is driven by CD8(+) T cells. Sci Transl Med 2013;5:200ra116. 10.1126/scitranslmed.3006504 [DOI] [PMC free article] [PubMed] [Google Scholar]
- 30.Bistrović A, Grbcic P, Harej A, et al. Small molecule purine and pseudopurine derivatives: synthesis, cytostatic evaluations and investigation of growth inhibitory effect in non-small cell lung cancer A549. J Enzyme Inhib Med Chem 2018;33:271-85. 10.1080/14756366.2017.1414807 [DOI] [PMC free article] [PubMed] [Google Scholar]
- 31.Pedley AM, Benkovic SJ. A New View into the Regulation of Purine Metabolism: The Purinosome. Trends Biochem Sci 2017;42:141-54. 10.1016/j.tibs.2016.09.009 [DOI] [PMC free article] [PubMed] [Google Scholar]
- 32.Yoshino J, Mills KF, Yoon MJ, et al. Nicotinamide mononucleotide, a key NAD(+) intermediate, treats the pathophysiology of diet- and age-induced diabetes in mice. Cell Metab 2011;14:528-36. 10.1016/j.cmet.2011.08.014 [DOI] [PMC free article] [PubMed] [Google Scholar]
- 33.Wiggins T, Kumar S, Markar SR, et al. Tyrosine, phenylalanine, and tryptophan in gastroesophageal malignancy: a systematic review. Cancer Epidemiol Biomarkers Prev 2015;24:32-8. 10.1158/1055-9965.EPI-14-0980 [DOI] [PubMed] [Google Scholar]


