Abstract
Cancers arising from germline DNA mismatch repair deficiency or polymerase proofreading deficiency (MMRD and PPD) in children harbour the highest mutational and microsatellite insertion–deletion (MS-indel) burden in humans. MMRD and PPD cancers are commonly lethal due to the inherent resistance to chemo-irradiation. Although immune checkpoint inhibitors (ICIs) have failed to benefit children in previous studies, we hypothesized that hypermutation caused by MMRD and PPD will improve outcomes following ICI treatment in these patients. Using an international consortium registry study, we report on the ICI treatment of 45 progressive or recurrent tumors from 38 patients. Durable objective responses were observed in most patients, culminating in a 3 year survival of 41.4%. High mutation burden predicted response for ultra-hypermutant cancers (>100 mutations per Mb) enriched for combined MMRD + PPD, while MS-indels predicted response in MMRD tumors with lower mutation burden (10–100 mutations per Mb). Furthermore, both mechanisms were associated with increased immune infiltration even in ‘immunologically cold’ tumors such as gliomas, contributing to the favorable response. Pseudo-progression (flare) was common and was associated with immune activation in the tumor microenvironment and systemically. Furthermore, patients with flare who continued ICI treatment achieved durable responses. This study demonstrates improved survival for patients with tumors not previously known to respond to ICI treatment, including central nervous system and synchronous cancers, and identifies the dual roles of mutation burden and MS-indels in predicting sustained response to immunotherapy.
Subject terms: Paediatric cancer, Tumour biomarkers, Cancer genetics, CNS cancer, Cancer immunotherapy
Hypermutation and microsatellite burden determine responses and long-term survival following PD-1 blockade in children and young adults with refractory cancers resulting from germline DNA replication repair deficiency.
Main
Accurate DNA replication in eukaryotic cells is ensured by the DNA polymerases Pol δ and Pol ε, which control base incorporation and proofreading, and by the mismatch repair (MMR) system that undertakes post-replication surveillance1. Germline and somatic mutations in POLD1 and POLE (termed polymerase proofreading deficiency, PPD), or in the MMR genes (MLH1, MSH2, MSH6, PMS2; termed MMR deficiency, MMRD) result in DNA replication repair deficiency. This is a major driver of hypermutation and microsatellite instability (MSI) in several adult and pediatric cancers2,3. Both germline PPD4 and monoallelic germline pathogenic variants in the MMR genes (Lynch syndrome)5 lead to adult-onset gastrointestinal and genitourinary cancers. In contrast, biallelic loss of MMR function in the germline causes constitutional MMRD syndrome, a highly penetrant and aggressive cancer-predisposing condition. Affected individuals typically develop cancers at a young age, most commonly malignant gliomas, and gastrointestinal and hematological malignancies6. These cancers are frequently chemo-resistant and result in poor survival for affected patients. Indeed, these individuals rarely survive beyond early adulthood6. The burden is significant in areas of high consanguinity7, including many developing countries, and in indigenous populations.
Cancers with DNA replication repair deficiency are universally hypermutant due to the continuous acquisition of multiple somatic mutations. The tumor mutation burden (TMB) of these cancers is 100–1,000-fold higher than MMR-intact pediatric cancers8. Furthermore, many of these tumors acquire a secondary somatic mutation in POLD1/ POLE leading to combined MMR + PPD, characterised by ultra-hypermutation (>100 mutations per Mb)2. As a result, these cancers harbour the highest TMB among all human cancers8. Hypermutant cancers such as melanoma9 and lung cancer10, which are driven by ultraviolet light and smoking, respectively, respond to immune checkpoint inhibitors (ICIs) targeting programmed death 1 (PD-1) signalling. However, despite the dramatic anti-tumor effects reported in several hypermutant adult cancers, these responses are sustained in only a subset of patients11. Our understanding regarding the relative importance and variable cut-offs of TMB in determining the nature and duration of response to ICI is still evolving12–14. Recent studies have raised questions regarding the roles of TMB and PD-ligand 1 (PD-L1) expression as robust biomarkers of response to ICI12–15. In contrast, MMRD colorectal carcinomas are reported to be responsive to ICI due to excess MSI16–18, suggesting that genomic features such as TMB or MSI may both drive immune responses to ICI19–21, but may not be individually sufficient for durable responses across different cancer types.
Most cancers, including hypermutant adult brain tumors are considered ‘immunologically cold’ and are unresponsive to ICI22. Importantly, ICIs did not result in significant responses in multiple large pediatric clinical trials and is considered ineffective in the management of solid tumors in childhood and adolescence15,23–25. Additionally, for all solid tumors receiving immunotherapy, the distinction between true tumor progression and an inflammatory pseudo-progression is a major challenge, and a barrier to effective therapy26.
Despite the lack of response to ICIs observed in children in previous studies, we hypothesized that cancers originating from germline DNA replication repair deficiency may benefit from ICIs due to their excess mutational load27. Furthermore, we postulated that cancers driven by MMRD-only, PPD, or combined MMRD + PPD will respectively exert their own unique mutational spectrum, driving local and systemic immune reactions, which would help shed light on the mechanisms of both response and pseudo-progression following ICI.
To address these hypotheses, we conducted a large, observational, registry-based study, leveraging systematically collected data gathered both retrospectively and prospectively through the International Replication Repair Deficiency Consortium (IRRDC)2,6,8,27. This enabled us to evaluate real-world outcomes and predictors of response to anti-PD-1 therapy in children with cancers driven by germline DNA replication repair deficiency. Uniquely, this also provided us the opportunity to investigate the efficacy of ICI in individuals with synchronous malignancies who are otherwise excluded from conventional clinical trials.
Results
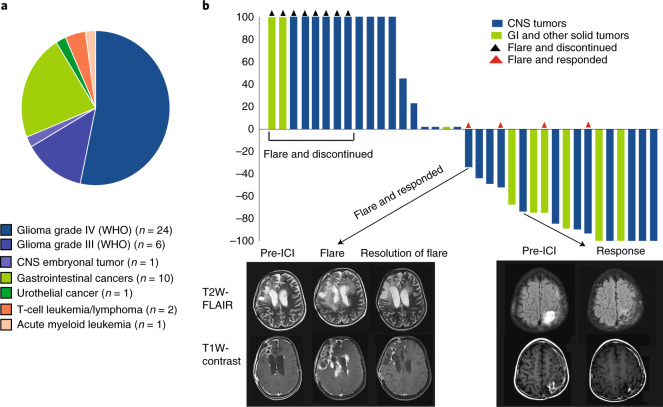
Thirty-eight patients who developed 45 cancers were treated with PD-1 inhibitors and followed by the IRRDC study group between May 2015 and March 2019. The PD-1 inhibitor used was either nivolumab (n = 34, 75%) or pembrolizumab (n = 11, 25%) (Methods). All patients had germline RRD, diagnosed as constitutional MMRD (n = 28, 74%), Lynch (n = 8, 21%), or PPD (n = 2, 5%) syndromes (Supplementary Table 1). Median age at treatment was 12.1 years (range: 3.1–28.1) for patients with constitutional MMRD, and 15.7 years (range: 8.5–43.4) for those with Lynch syndrome (p = 0.07). Seven cancer types were included and classified into 3 major groups: central nervous system (CNS) tumors (n = 31, 69%; disseminated: 2, 6%), non-CNS solid tumors (n = 11, 24%; disseminated: 7, 64%), and haematological malignancies (n = 3, 7%) (Fig. 1a). The majority (n = 43, 93%) of cancers were progressive/recurrent after failure of first-line therapy. Three patients with gastrointestinal cancers received ICI directly following surgery; two had synchronous CNS tumors, and one who had metastatic disease. The data cut-off for outcomes was October 2019.
Fig. 1. Clinical response to ICI across cancer types in patients with germline DNA replication repair deficiency.
a, Distribution of tumor types across 38 patients who developed 45 tumors. b, Waterfall plot of all radiological responses in non-haematological malignancies. Values show the best fractional change in the 2 dimensions from baseline measurements as per RANO and RECIST criteria (Methods). Arrows point to representative T2-weighted FLAIR and T1-weighted contrast-enhanced MRI sequences in two patients showing flare and partial responses.
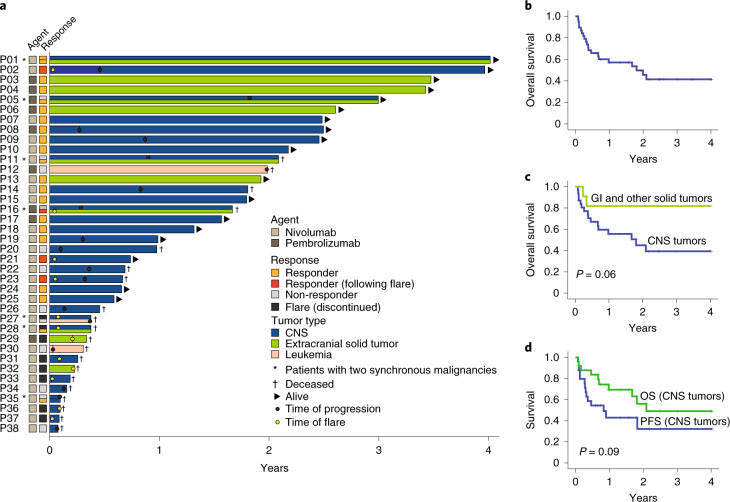
Responses and/or stable disease were observed in 25/45 (55.5%) tumors, with most of the responses (n = 20; 80%) being sustained at a median follow-up of 1.87 years. Central radiological review (RANO and RECIST criteria; Methods)28,29 revealed complete response in 6 (17%), partial response in 9 (25%), stable disease in 7 (19%), and progressive disease in 14 (39%) (Fig. 1b). Among the 7 patients with synchronous malignancies, responses in both tumors were seen in one patient, and at least in one tumor in four patients (Fig. 2a). The three patients with haematological malignancies (leukemia, T-non-Hodgkin lymphoma) progressed at a median time of 4.5 months after starting ICI therapy. Responses were significantly different among the three types of tumors (P = 0.0041), with non-CNS tumors having the highest response (100%), followed by CNS tumors (64%), with hematological tumors having the lowest response (0%).
Fig. 2. Patient outcome and survival by tumor type.
a, Swimmer plot by patient and tumor type. b, Kaplan-Meier (KM) estimates of overall survival for all patients (c) KM estimates of overall survival as per tumor type. Median survival for CNS tumors was 21.6 months. Median survival was not reached for non-CNS solid tumors. Two-sided log-rank test p-value is shown. d, KM estimates of progression free and overall survival for CNS tumors continuing ICI therapy. Note: prolonged median survival at 24 months (estimated 3 year OS = 49.1%) despite initial radiological progression at a median of 9.9 months (estimated 3 year PFS = 32%). Two-sided log-rank test p-value is shown.
Of note, 12 (27%) tumors exhibited early radiological findings of edema and enhancement, suggestive of peri-tumoral inflammation or tumor progression (Figs. 1b and 2a). This phenomenon occurred at a median of 34 days (range 7–74) from treatment initiation and was termed tumor ‘flare.’30 These patients presented with acute clinical deterioration with headache, bone, or abdominal pain, depending on the location of their tumors. Eight patients (6 with CNS and 2 with non-CNS solid tumors) stopped therapy and died. Importantly, 4 patients (3 with CNS and 1 with non-CNS solid tumor) who continued to receive ICI with adequate supportive care subsequently demonstrated objective responses. Since this phenomenon suggested pseudo-progression, these tumors were studied in more detail.
Estimated 3 year overall survival (OS) was 41.4% (95% CI: 38.5–44.2) (Fig. 2b), with 18 (47%) patients being alive at the time of last follow-up (Fig. 2a). This is noteworthy considering the refractory nature of their cancers. Analysis by cancer type revealed that non-CNS solid tumors had a significantly better survival compared to CNS tumors (Fig. 2c and Supplementary Fig. 1d; P = 0.01). Nevertheless, the OS of 39.3%, (95% CI: 36.3–42.3) and PFS of 26.9% (95% CI; 23.2, 30.6) for patients with recurrent/progressive CNS tumors is a dramatic improvement compared to their historically rapidly fatal outcomes (Fig. 2c,d and Supplementary Fig. 1b)6,7,27. All patients with non-CNS solid tumors continuing ICI had durable responses and are alive at a median follow-up of 2.6 years (range: 0.38–3.5). Remarkably, 13 patients with CNS tumors who experienced radiological progression on initial ICI therapy had prolonged survival (median, 9.6 months; range, 1.5–27 months) (Fig. 2a,d and Supplementary Table 1). Plausible explanation for the late and continued responses to immunotherapy is the obligatory mutation accumulation in these cancers8, which result in novel immunogenic neoantigens and responses. Clinical variables such as age, gender, ethnicity, prior treatment, or choice of ICI agent were not associated with outcome (Supplementary Fig. 2).
Molecular determinants of response to immunotherapy
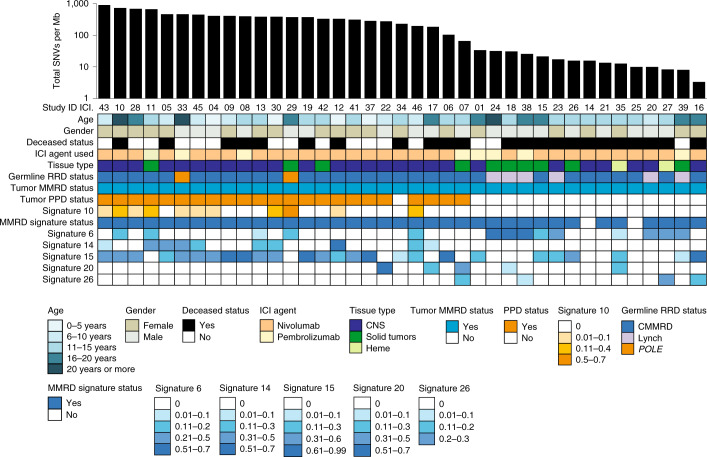
To better understand the molecular determinants of response to ICI, biopsy specimens and blood samples were collected before and during therapy from the patients for centralized analysis (Methods). Whole exome analysis of tumors (n = 39, Fig. 3) revealed high variability in the number of single nucleotide variants (SNV), including ultra-hypermutation (median, 233.8 mutations per Mb; range, 3.4–912), which was associated with tumor genotype. MMRD-only cancers (n = 16) had significantly fewer SNVs (median, 15.8 mutations/Mb) than MMRD + PPD cancers (n = 23, median 391.4 mutations per Mb; P < 0.0001; Fig. 4b). This was associated with germline status, given that 21 (67.7%) cancers in constitutional MMRD patients harboured MMRD + PPD (median, 398.98 mutations per Mb), while all cancers in individuals with Lynch syndrome lacked somatic PPD (median, 21.76 mutations per Mb; P = 0.03). Both cancers originating from germline PPD, one colorectal carcinoma (P13; ICI.29) and one glioblastoma (P17; ICI.33) had acquired somatic MMRD resulting in ultra-hypermutation (Figs. 2a and 3).
Fig. 3. Onco-plot summarising the genomic features from 39 available paired tumors and germline exomes, and their clinical correlates.
The tumors are arranged in descending order by total single nucleotide variants (SNVs) per megabase using semi-logarithmic scale. Tumor status for mismatch repair deficiency (MMRD) was determined based on MMR gene mutation status by whole exome sequencing (WES), or genetic testing of the patient germline. Tumor polymerase-proofreading deficiency (PPD) status was ascertained by presence of known POLE/POLD1 driver mutations and/or COSMIC signature status for PPD (COSMIC signature 10). The relative weight of each mutational signature contributing to each specific tumor sample analysis as reported using the DeconstructSigs package (Methods) has been color-coded, with the values provided below the onco-plot.
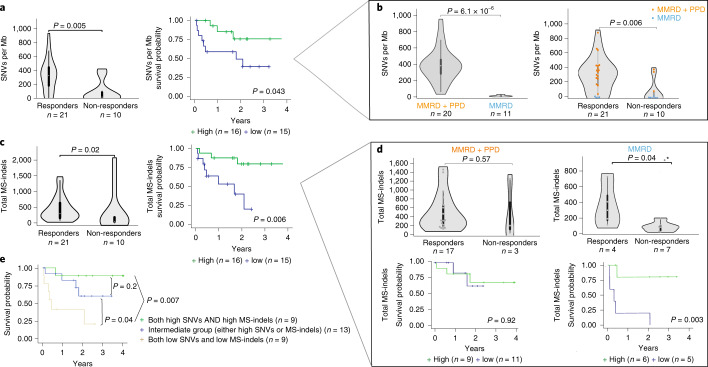
Fig. 4. Genomic biomarkers, survival and response to PD1 blockade.
a, Response and overall survival (OS) by single nucleotide variants (SNVs) per Mb. For survival analysis, median SNV burden was used. b, SNVs as a function of MMRD (blue) and MMRD + PPD (orange) status (left), and response association with both SNV and replication-repair deficiency status. c, Response and overall survival (OS) by microsatellite indels (MS-indels). For survival analysis, median MS-indel values were used. d, Response and overall survival by total MS-indel count for MMRD + PPD and MMRD-only cancers separately. e, Kaplan-Meier (KM) estimates using combined SNVs/Mb and MS-indel in all replication repair-deficiency cancers. For all box-plots for responders and non-responders, data are represented as median + /- interquartile range. For statistical significance in comparing responders and non-responders, the Wilcoxon-Mann-Whitney test was used. Survival analysis was performed using the Kaplan-Meier method, and the log-rank test was used to compare groups. All p values are 2-sided. (MMRD: mismatch repair deficiency; PPD: polymerase proofreading deficiency; MS-indel: microsatellite insertion/ deletion).
Analysis of COSMIC signatures, which reflect the imprints of the underlying mutational processes31, revealed that signature 6 was enriched in tumors from germline Lynch syndrome patients (P = 0.003), whereas signatures 10 and 14 were not detected in these tumors. Furthermore, signature 6 was enriched in MMRD-only cancers (P = 0.04), and signatures 10 and 14 were enriched in MMRD + PPD cancers (P < 0.002). Last, signatures 10 and 14 were individually associated with response to ICI (P = 0.03). Importantly, signature 11, which is commonly detected in treatment-related hypermutant adult gliomas that do not respond to ICI32, was detected only in a single patient (P27) with synchronous leukemia and glioblastoma, who had been previously treated with alkylating agents for medulloblastoma. These findings highlight the unique diagnostic and prognostic roles of mutational signatures in replication repair-deficient cancers31.
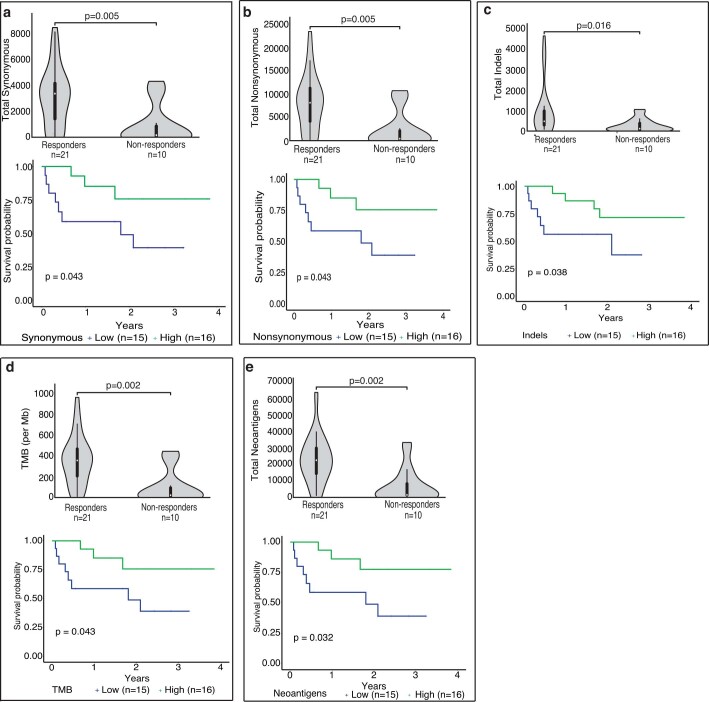
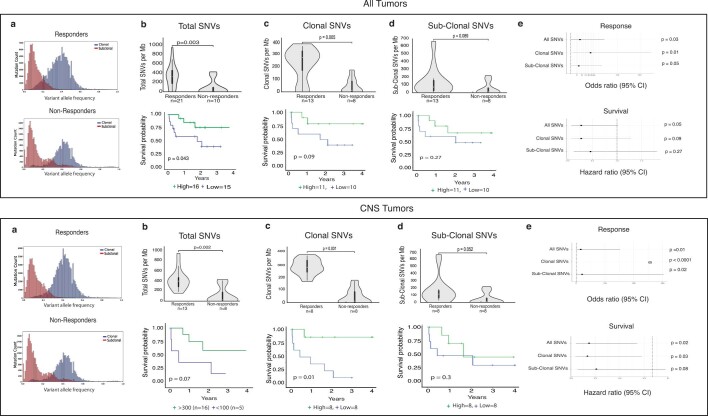
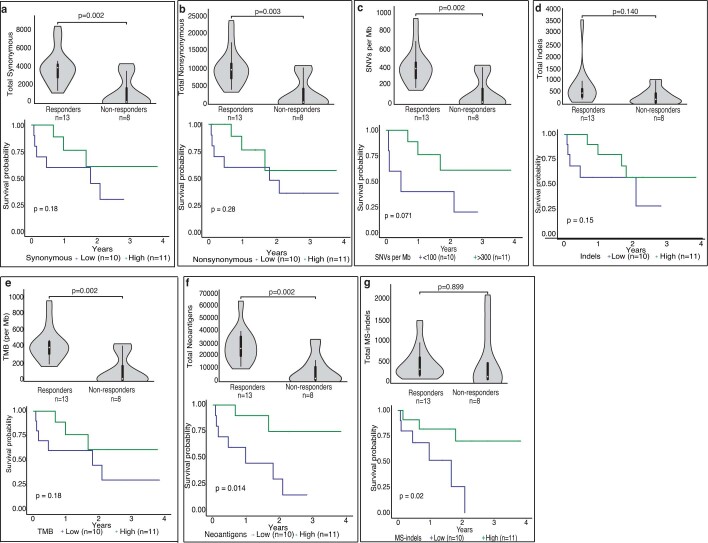
As questions exist regarding the contribution of tumor-intrinsic characteristics such as mutation load in terms of SNVs, indels, and the microsatellite specific indels to ICI response, we sought to determine whether independent roles exist for each of these genomic features and their underlying driver mechanisms. High SNV/Mb (≥median: 275.38/Mb) was significantly associated with both response and survival, demonstrating that extreme mutation burdens were relevant even for a cohort of uniformly hypermutant cancers (P = 0.005, Fig. 4a and Extended Data Fig. 1a–d). Both response and survival were also associated with a higher tumor neoantigen load (Extended Data Fig. 1e). Enrichment of clonal mutations33 predicted response (Extended Data Fig. 2). Remarkably, response and survival were predicted by replication repair deficiency status. Patients whose cancers were MMRD + PPD had higher mutation burden (P < 0.0001), and these tumors were enriched among the responders (n = 17/21) as compared to non-responders (n = 3/10) (P < 0.001) (Fig. 4b).
Extended Data Fig. 1. Genomic biomarkers (SNVs), survival and response to PD-1 blockade.
Response and overall survival by (a) total synonymous variants, (b) non-synonymous variants, (c) total indels, (d) total mutations/Mb, and (e) neoantigens. For survival, median values were utilized to stratify into ‘high’ and ‘low’ groups. For all box-plots for responders and non-responders, data are represented as median ± interquartile range. For statistical significance in comparing responders and non-responders, the Wilcoxon-Mann-Whitney test was used. Survival analysis was performed using the Kaplan-Meier method, and the log-rank test was used to compare groups. All p values are 2-sided.
Extended Data Fig. 2. Clonal SNVs and outcomes.
(a) Distribution (using histogram) of clonal versus sub-clonal mutations between responders and non-responders for all (above) and CNS tumors (below). (b-d): Response and survival (stratification by >= median) for total, clonal and sub-clonal SNVs. For all box-plots for responders and non-responders, data are represented as median +/- interquartile range. (e) Odds ratio (95% confidence interval) for response (using logistic regression) and hazard ratios (95% confidence interval) for survival (using Cox regression) for all, clonal and sub-clonal SNVs for all tumors (above) and CNS tumors (below). All p-values are 2 sided.
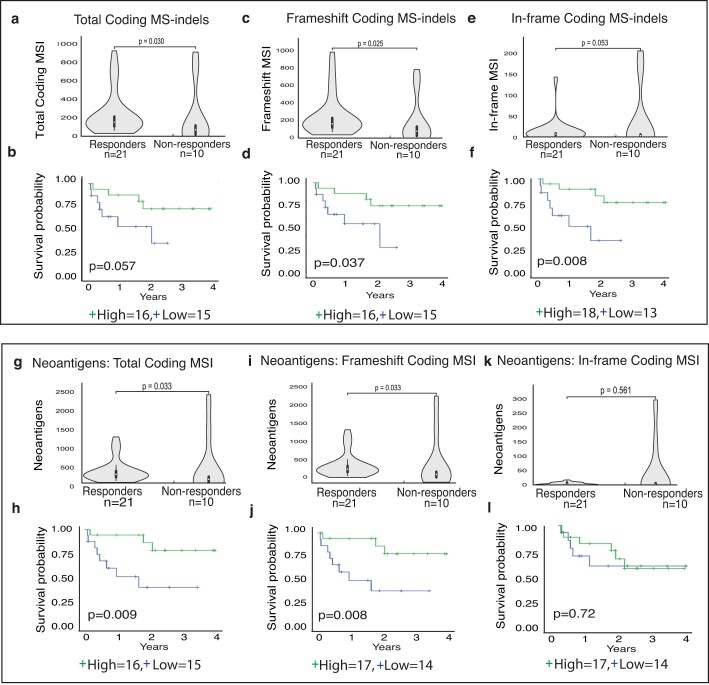
Recent work has shown that the degree of genome-wide MS-indels correlate with response to ICI in MMRD tumors3,34,35. Indeed, across our entire cohort, total MS-indels, calculated by MS-mutect (Methods)36, were predictive of tumor response (P = 0.02) and patient survival (p = 0.006; Fig. 4c). This was as a result of frameshift indels in coding microsatellites and neoantigens generated by these MS-indels, which strongly predicted outcome (Extended Data Fig. 3).
Extended Data Fig. 3. Genomic biomarkers (MS-Indels), survival and response to PD-1 blockade.
(a-f) Total, frameshift and in-frame MS-Indels and outcome. (g-l) Neoantigens generated by total, frameshift and in-frame MS-Indels and outcome. For survival, median values were utilized to stratify into ‘high’ and ‘low’ groups. For all box-plots for responders and non-responders, data are represented as median +/- interquartile range. For statistical significance in comparing responders and non-responders, the Wilcoxon-Mann-Whitney test was used. Survival analysis was performed using the Kaplan-Meier method, and the log-rank test was used to compare groups. All p values are 2-sided.
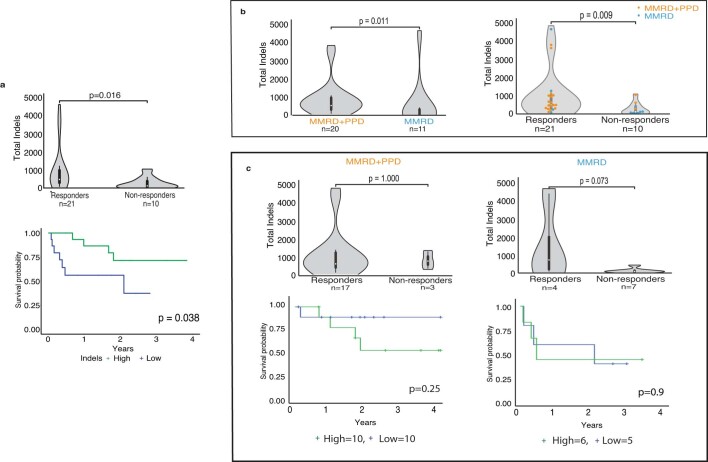
Given that no significant correlation between MS-indels and SNVs were observed (Supplementary Fig. 3), we hypothesized that while both SNVs and MS-indels are independently immunogenic across all replication repair-deficient cancers, MS-indels may be particularly important for determining outcomes for MMRD-only cancers which harbour relatively lower SNVs. To test this, we analyzed MMRD-only and MMRD + PPD tumors separately (Fig. 4d and Supplementary Fig. 4). Total MS-indels were higher in responders than in non-responders and were significantly associated with survival in MMRD-only cancers (P = 0.003) and not in MMRD + PPD cancers (Fig. 4d). In contrast, high SNVs and total indels failed to predict response in MMRD-only cancers (P > 0.1, Extended Data Fig. 4c and Supplementary Fig. 4b). Combining the prediction models for both these types of replication repair deficiency cancers (MMRD-only and MMRD + PPD) revealed that high SNVs and total MS-indels together strongly predicted improved survival (Fig. 4e and Supplementary Fig. 3d–g; P = 0.0024).
Extended Data Fig. 4. Genomic biomarkers (Total Indels), survival and response to PD1 blockade.
(a) Response and overall survival (OS) by total indels. For survival analysis, median indel burden was used. (b) Total indels as a function of MMRD (blue; n=11) and MMRD+PPD (orange; n=20) status (left), and response association (responders; n=21; non-responders; n=10) with both indels and replication-repair deficient status. (c) Response and overall survival (OS) by total indels, stratified by tumors with MMRD+PPD (n=20) and MMRD only (n=11). For survival analysis, median indel burden was used. For all box-plots for responders and non-responders, data are represented as median +/- interquartile range. For statistical significance in comparing responders and non-responders, the Wilcoxon-Mann-Whitney test was used. Survival analysis was performed using the Kaplan-Meier method, and the log-rank test was used to compare groups. All p values are 2-sided.
To determine whether mutations and MS-indels drive responses within a more homogeneous cancer type, we interrogated both these genomic markers in CNS tumors. Both components independently contributed to the response and survival (Extended Data Fig. 5) and no differences in these genomic features were observed between CNS and non-CNS solid tumors (Supplementary Fig. 5a–d). Importantly, clonal mutations33 were particularly a strong predictor of response and survival for CNS tumors (Extended Data Fig. 2).
Extended Data Fig. 5. CNS tumours: Genomic biomarkers, survival and response to PD-1 blockade.
Response and overall survival for CNS tumours by (a) synonymous variants, (b) non-synonymous variants, (c) SNVs/Mb, (d) total indels, (e) total mutations/ Mb, (f) neoantigens, and (g) MS-indels. For survival, median values were utilized to stratify into ‘high’ and ‘low’ groups. For all box-plots for responders and non-responders, data are represented as median +/- interquartile range. For statistical significance in comparing responders and non-responders, the Wilcoxon-Mann-Whitney test was used. Survival analysis was performed using the Kaplan-Meier method, and the log-rank test was used to compare groups. All p values are 2-sided.
Collectively, these data suggest dual roles for SNVs and MS-indels in determining immunotherapy responses in replication repair-deficient cancers (Supplementary Fig. 3d,g), including CNS tumors (Supplementary Fig. 6).
Immune microenvironment and response to therapy
Next, we examined whether the tumor subgroups affect the tumor micro-environment and response to therapy. We tested multiple immune markers using immunohistochemistry for immune cell infiltration (CD3, CD4, CD8 and CD68) and checkpoint ligand (PD-L1) expression. All immune markers were scored independently by two pathologists with robust concordance (Methods; Supplementary Fig. 7).
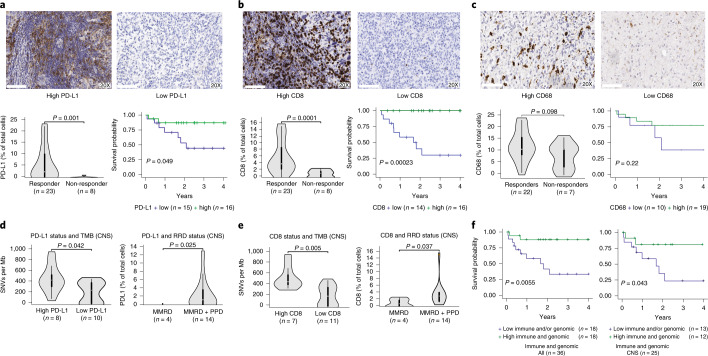
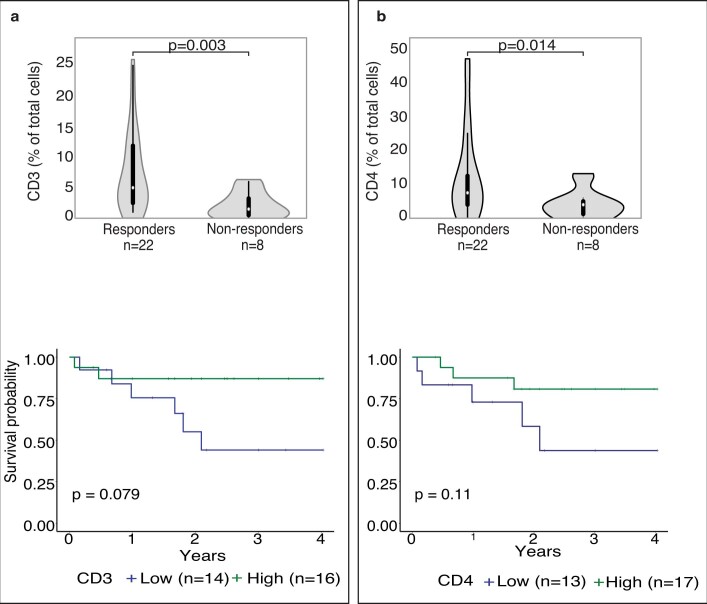
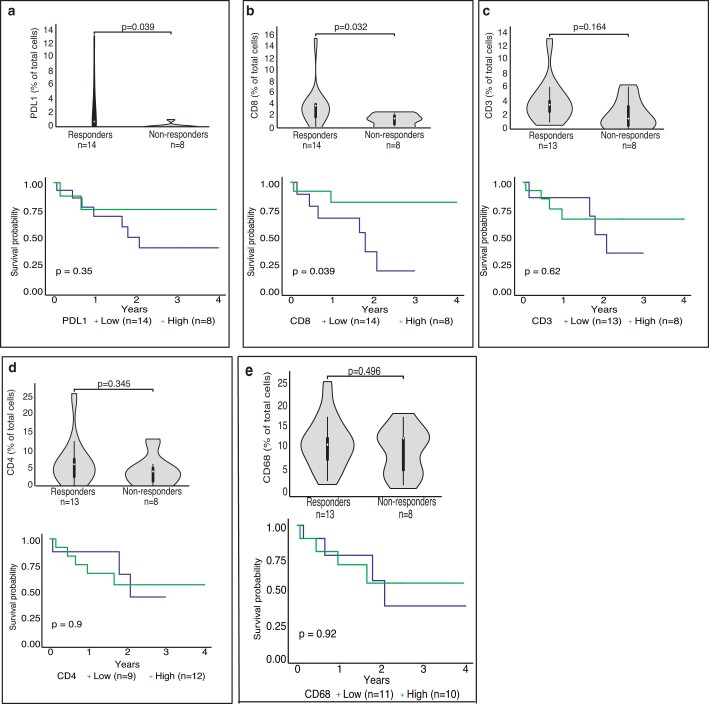
PD-L1 expression was associated with both response and improved survival (P = 0.04, Fig. 5a). Overall, increased lymphocytic infiltration within the tumor microenvironment was associated with response (Extended Data Fig. 6). Specifically, high CD8-T cell infiltration predicted both response and improved OS (P = 0.0002, Fig. 5b). All non-CNS solid tumors including those with MMRD-only, harboured high MSI, exhibited high CD8+ T cell infiltration (Supplementary Fig. 5), and responded to ICI. This corroborates previous reports in which MMR-deficient gastrointestinal tumors had high CD8+ T cell infiltration37. High T cell infiltration was also observed in CNS tumors, which are traditionally considered an ‘immune-privileged’ site22 (Fig. 5b). CNS tumors with a high mutation burden and MMRD + PPD not only had increased CD8+ T cell infiltration, but also significantly higher expression of PD-L1 (Fig. 5d,e). In contrast, all tumors in our study had low to moderate CD68 expression (none > 30%). Furthermore, there was no association between CD68 and response or survival (Fig. 5c). This suggests that in the setting of ultra-hypermutation driven by combined MMRD + PPD and high genomic MS-indels, the increased activation of the immune microenvironment, associated with robust CD8+ T cell responses, can explain the remarkable responses seen even in the CNS tumors. Indeed, in these CNS tumors, high CD8+ T cell infiltration was associated with improved OS (P = 0.039; Extended Data Fig. 7b).
Fig. 5. Tumor immune microenvironment, survival and response to PD-1 blockade.
a, PD-L1 expression, response and survival in all replication repair-deficient cancers. Cut-off is ≥ 1% of cells (median; Methods). b, CD8 expression, response and survival for replication repair-deficient cancers. Cut-off is ≥ 3% of cells (median; Methods). c, CD68 expression, response and survival. Cut-off is ≥ 12.5% of cells (median; Methods). For (a), (b) and (c), the histology depicts glioblastoma at 20X magnification. d,e, Association of immune markers with SNV and replication repair-deficient status. f, Combined immune (PD-L1 and CD8 expression) and genomic (TMB and MS-indels) and overall survival in replication repair-deficient cancers. For all box-plots for responders and non-responders, data are represented as median + /- interquartile range. For statistical significance in comparing responders and non-responders, the Wilcoxon-Mann-Whitney test was used. Survival analysis was performed using the Kaplan-Meier method, and the log-rank test was used to compare groups. All p values are 2-sided.
Extended Data Fig. 6. Tumour immune microenvironment, survival and response to PD-1 blockade.
Response and overall survival by (a) CD3, and (b) CD4-positive cells in the pre-ICI tumour specimens. For survival, median values were utilized to stratify into ‘high’ and ‘low’ groups. For all box-plots for responders and non-responders, data are represented as median +/- interquartile range. For statistical significance in comparing responders and non-responders, the Wilcoxon-Mann-Whitney test was used. Survival analysis was performed using the Kaplan-Meier method, and the log-rank test was used to compare groups. All p values are 2-sided.
Extended Data Fig. 7. CNS tumours: Immune microenvironment, survival and response to PD-1 blockade.
Response and overall survival in CNS tumours by (a) PD-L1, (b) CD8, (c) CD3, (d) CD4, and (e) CD68 expression. For survival, median values were utilized to stratify into ‘high’ and ‘low’ groups. For all box-plots for responders and non-responders, data are represented as median +/- interquartile range. For statistical significance in comparing responders and non-responders, the Wilcoxon-Mann-Whitney test was used. Survival analysis was performed using the Kaplan-Meier method, and the log-rank test was used to compare groups. All p values are 2-sided.
Overall, tumors exhibiting high expression of immune markers and a favorable genomic profile (high SNVs or MS-indels) had a 3 year OS of 87.8% (95% CI: 84–91.5) as compared to 33.2% (95% CI: 27.2–39.2) for tumors lacking these biomarkers (P = 0.005, Fig. 5f).
Tumor flare is an immune reaction to therapy
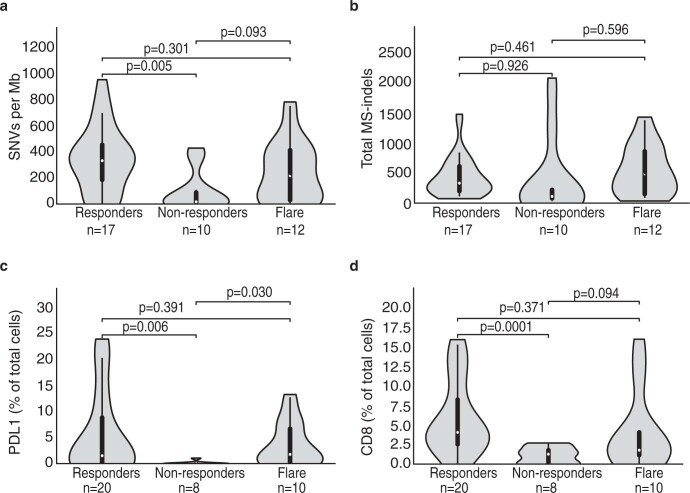
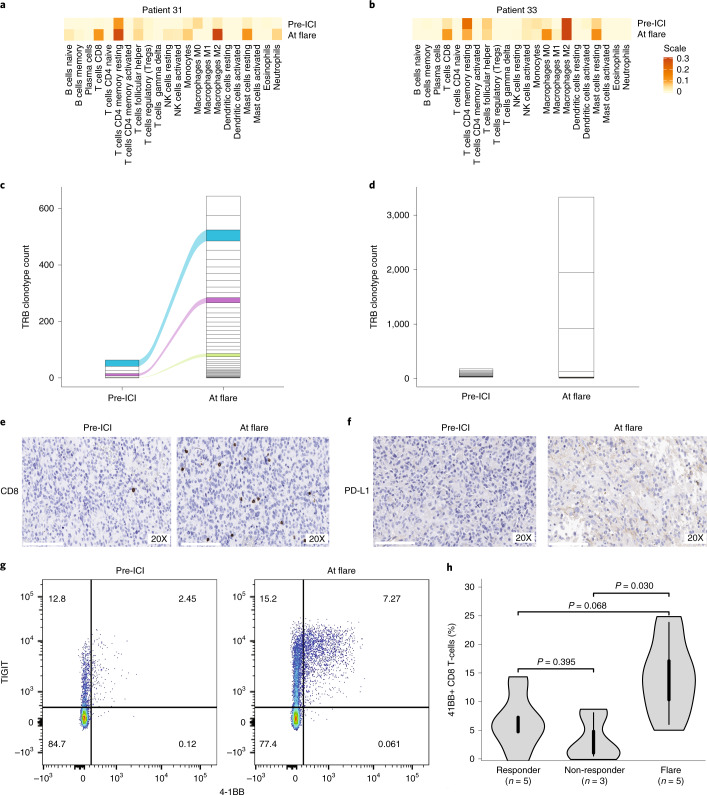
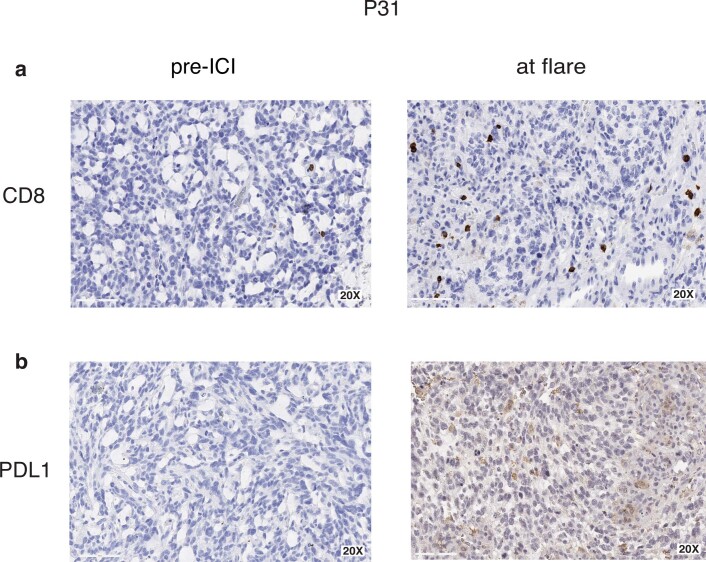
To determine etiology of tumor flare, we first analyzed the genomic and immune markers of these tumors. Cancers developing flare had pre-treatment genomic and immune characteristics similar to the responders without flare (Extended Data Fig. 8a–d). We then compared the pre- and on-therapy tumors in two patients who had further surgical debulking at flare. Transcriptomic analysis and immune inference using single state deconvolution (Methods) revealed an increase in the overall immune cell expression at flare. Notably, transcriptome signaling revealed that activated CD8+ T cells were significantly increased in both samples following ICI (Fig. 6a,b and Supplementary Fig. 8). Using T cell receptor clonotype analysis (Fig. 6c,d and Supplementary Fig. 9), we observed a dramatic increase of T cell repertoire at flare as compared to their baseline. One sample demonstrated an increase in both clonality and diversity of the T cell population, with some original clones expanding during flare (Fig. 6c), whereas for the other sample, there was reduction in diversity but significantly heightened clonality in the T cell population, involving unique clonotypes harbouring complementary-determining regions (CDR3) not previously reported in public databases (Fig. 6d and Supplementary Fig. 9c). Additionally, increased CD8+ T cell infiltration and PD-L1 expression were observed in both tumors during flare when compared to their pre-treatment samples (Fig. 6e,f and Extended Data Fig. 9). These observations suggest a pre-existing (specific) immune response and further ICI-driven (non-specific and specific) tumor-directed immune expansion at flare.
Extended Data Fig. 8. Genomic and immune markers of response in tumours exhibiting flare.
Responders without flare, non-responders and stratified by (a) SNVs/mb, (b) MS-indels, (c) PD-L1 and (d) CD8 expression. For all box-plots, data are represented as median +/- interquartile range. For statistical significance in comparing responders and non-responders, the Wilcoxon-Mann-Whitney test was used. All p values are 2-sided.
Fig. 6. Characterization of the tumor flare response.
a-d, Analysis of 2 patients who had tumor-debulking prior to therapy and at the time of flare. (a, b) Total immune cell content in pre-therapy and at flare. c,d, The corresponding CapTCR-sequencing and T cell receptor clonotype (TCR) analysis in these samples. Each box represents a specific TCR clonotype. Specific clonotypes which were shared between the baseline samples and at flare were tracked using the same colour between the baseline and flare samples. e,f, Immunohistochemistry for PD-L1 expression, and CD8-T cell infiltration in the pre-therapy sample and at flare, as shown in the representative 20X images from the tumor sample in patient-1 (P33). All immunohistochemistry was analysed by two independent pathologists. g, Representative flow cytometry plot showing activation of CD + T cell (TIGIT and 4-1BB) from the blood sample of a patient before treatment initiation and at flare. h, 4-1BB + CD8 + T cells in blood from responders without flare, non-responders and flare. For the box-plots, data are represented as median + /- interquartile range. For statistical significance in pairwise comparison of responders, non-responders and flare, the Wilcoxon-Mann-Whitney test was used. All p values are 2-sided.
Extended Data Fig. 9. Immunohistochemistry at baseline and flare.
Representative images (20X) from patient P31 demonstrating (a) CD8 and (b) PD-L1 expression in pre-ICI and flare samples. All immunohistochemistry was analysed by two independent pathologists.
We next investigated whether this immune activation could be observed systemically (Fig. 6h, Extended Data Fig. 10 and Supplementary Fig. 10). We performed serial flow cytometry analysis of blood samples from multiple patients, prior to treatment initiation and within the first 90 days of initiation of ICI (Methods). Flare was associated with an expansion of peripheral CD8+ T cells expressing Ki67 (a marker of proliferation) and 4-1BB (a member of the TNF receptor family) (Extended Data Fig. 10a–d and Fig. 6g). Detection of Ki67+ CD8+ T cells has been previously reported to be associated with superior response to PD-1 blockade38. 4-1BB is well-known as a marker of T cell activation and has co-stimulatory activity for activated T cells39. Flare was associated with higher proportion of 4-1BB+ CD8+ T cells in the peripheral blood as compared to non-responders, as well as responders without flare (Fig. 6h). Studies have previously shown that 4-1BB+ CD8+ T cells correlate with response to PD-1 blockade40. This uniform increases in 4-1BB and Ki67+CD8+ T cells, was accompanied by an insignificant change in the 4-1BB+ CD4+ T cell population (Extended Data Fig. 10e,f) and no difference between responder, none-responders and flare for the latter (Supplementary Fig. 10a), supporting our hypothesis that CD8+ T cells expressing 4-1BB reflect the expansion of a tumor-specific response. Taken together, our data suggests that flare following PD-1 blockade is with a result of inflammatory response and proliferation of tumor-antigen reactive T cells.
Extended Data Fig. 10. Immune activation in patients experiencing tumour flare.
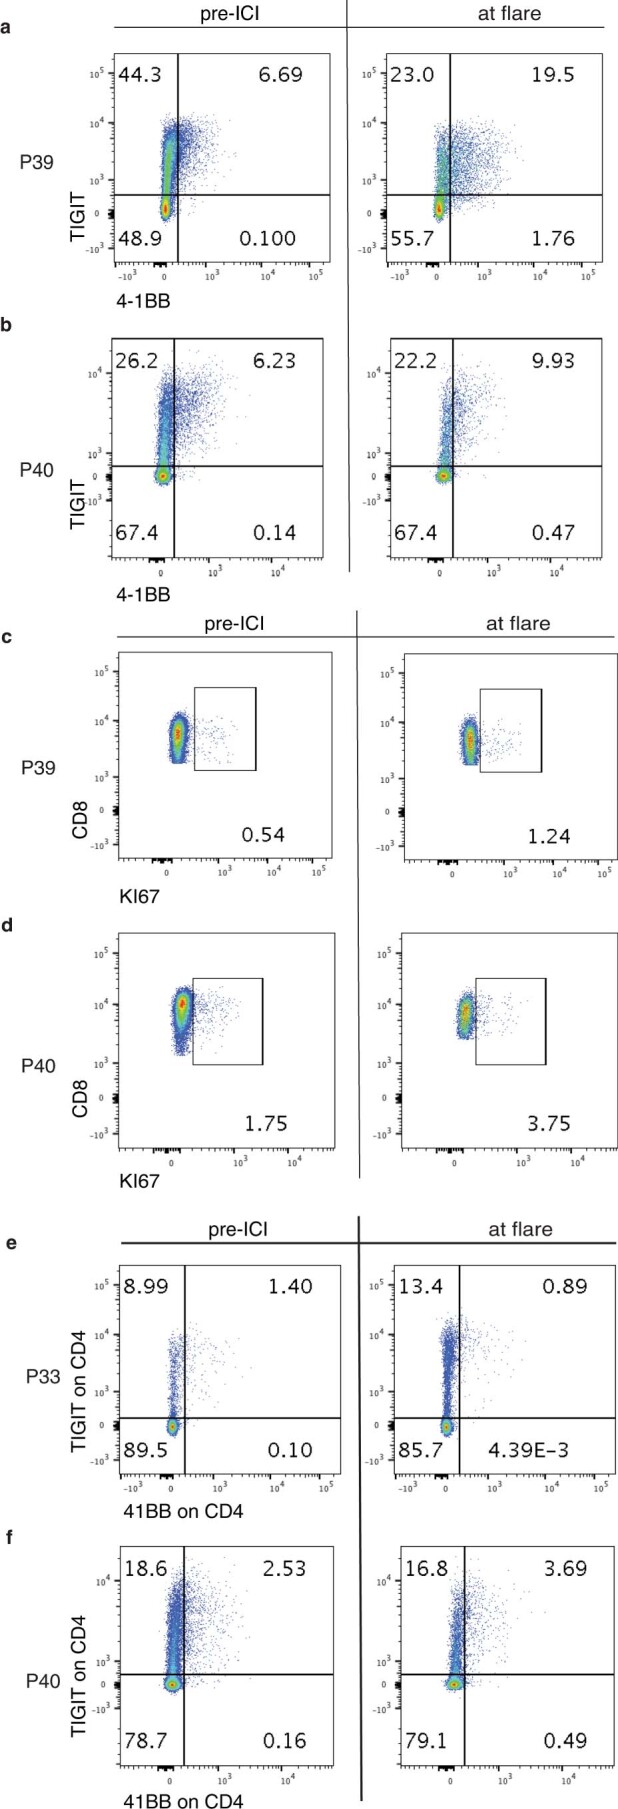
Flow cytometry dot-plots from two patients comparing pre-ICI and flare samples, showing (a, b) TIGIT and 4-1BB expressing CD8+ T-cells, (c, d) Ki67 expressing CD8+ T-cells, and (e, f) TIGIT and 4-1BB expressing CD4+ T-cells.
Discussion
Our study reveals dramatic responses to PD-1 blockade and an associated improved survival for relapsed/refractory hypermutant cancers in children and young adults with germline DNA replication repair deficiency. Several insights can be derived from the sustained responses in different tumor types, and the contributions of SNVs, MS-indels and the microenvironment to both response and flare.
The unique responses to ICIs in children with germline replication repair deficiency are different from previous observations by several groups. First, our data starkly contrast with the lack of ICI efficacy in childhood cancers in general15,23–25, and specifically in progressive paediatric brain tumors41. The lack of response in paediatric cancers, which is independent of PD-L1 expression15 or systemic immune activation15,24, has been attributed to the low tumor mutation burden2,8,27, low expression of major histocompatibility complex42, and the predominance of macrophages in the tumor micro-environment43. Some of these causes may need to be re-examined in view of our data.
Second, more than half of replication repair-deficient pediatric CNS tumors had objective responses, resulting in a median survival of 2 years when ICI was continued. This is remarkable, as historically, rapid progression with a median post-relapse survival of merely 2.6 months has been reported in children with replication repair-deficient high-grade glioma7,27. Furthermore, these responses contrast with the poor response to ICIs in adult hypermutant gliomas32,44. Indeed, comparative mutational analysis in these two cohorts revealed significantly higher mutation burden in paediatric MMRD + PPD gliomas, and higher MS-indels in all germline replication repair-deficient gliomas, as compared to adult hypermutant gliomas (Supplementary Fig. 6). Moreover, ICI-responders among germline replication repair-deficient gliomas exhibited predominance of clonal mutations (Extended Data Fig. 2), which is different from treatment-related secondary MMR deficient adult gliomas, where late acquisition of sub-clonal mutations during tumorigenesis results in suboptimal responses to ICI32. Additional causes may include an immunosuppressed tumor microenvironment dominated by myeloid infiltrates45 which are frequent in adult gliomas as compared to replication repair-deficient gliomas, where myeloid infiltrates are less predominant (Fig. 5).
Third, all patients who continued ICI therapy for non-CNS solid tumors including disseminated cancers, responded, and are alive at a median follow-up of 2.6 years, with an estimated survival rate of 80%. Although still preliminary, these data are encouraging, as the survival in most recurrent childhood cancers is poor, especially for metastatic disease46,47. Lack of response to ICI in previous clinical trials in pediatric recurrent/refractory solid tumors probably reflects the lack of inclusion of DNA replication repair-deficient tumors in these studies15,23–25. As we observed responses in metastatic colorectal and genitourinary cancers, our results compare favourably with the otherwise grim survival for such tumors in both children48,49 and adults50,51 when using conventional therapies. Interestingly, our data compare favourably even with studies using ICI in MMRD cancers in older adults (median age: 60 years, versus 12.3 years in our study), in whom late failures were noted, resulting in 50–55% survival at 2 years17,18,52.
Collectively, the dramatic responses and favourable outcome observed in childhood replication repair-deficient cancers can be explained by several key biological features. First, the earlier onset8, combined with significantly higher mutations2, MS-indels3, and neoantigen burden drive CD8+ T cell activation, which is especially robust in children and adolescents when compared to older patients53. Second, the additional loss of the polymerase-proofreading mechanism confers genomic mutational signatures (both MS-signatures3 and COSMIC signatures31 10 and 14) which may play unique immunogenic role in determining response and survival. Third, given that MMRD + PPD cancers cannot repair errors during DNA replication, the exceptionally high rate of obligatory and continuous accumulation of mutations in these cancers8 probably confers ongoing immunogenicity, contributing to immune-surveillance leading to both the durable and the delayed responses observed in our cohort. This probably contributed to the difference between progression-free (post-ICI) and overall survival for patients who continued anti-PD1 treatment after a second progression while on ICI therapy (Fig. 2d and Supplementary Fig. 1b,c). The use of combinatorial therapies targeting additional immune-checkpoints and pathways can therefore be of further benefit for patients whose tumors escape immune surveillance following single-agent anti-PD1 blockade54.
An additional observation worth discussion is the response in a tissue-agnostic manner in a patient with synchronous tumors exhibiting favourable genomic and immune biomarkers for response (P01). As cancer immune surveillance is different than the irreversible resistance which occurs upon progression after chemo-radiation approaches, these data support the exploration of neoadjuvant, maintenance, and combinatorial uses of ICI in these patients, to limit toxicities and improve effectiveness of first-line strategies55.
There is increasing evidence that responses to ICI cannot be predicted by single biomarker56. Our data confirm that this is true in replication repair-deficient cancers which are driven by dysfunction in both SNV and MS-indel repair. Although initially TMB was thought to be the sole contributor to immune response in hypermutant cancers, indels and MS-indels have been suggested to be the important drivers of response to ICI in MMR-deficient cancers3,35,57. We add a new dimension to this concept by revealing that in cancers driven by MMRD-only, TMB is relatively lower, and MS-indels drive response, while in MMRD + PPD cancers, the role of MS-indels is attenuated, and TMB is the major driver of response. The dual roles of both mutational mechanisms also affect the microenvironment, with upregulation of PD-L1 and infiltration of CD8+ T cells. Importantly, the combination of both genomic mechanisms and immune markers are powerful predictors of survival in replication repair deficient cancers and should be incorporated as combined biomarkers in future clinical trials. Additionally, the contribution of an immune microenvironment to the ICI response may be relevant in the context of similar findings reported in other subsets of paediatric cancers not known to be driven by replication repair deficiency58.
Paradoxically, this hyperactivation of the immune microenvironment can also be detrimental, since tumor flare, which indicates both specific (pre-existing) and non-specific (new) expansion of TCR clones, can be misinterpreted as tumor progression and lead to premature treatment abandonment. In this study, we observed flare to be quite common in germline replication repair-deficient cancers, which are highly immunogenic due to their extreme SNV and MS-indel burden. These flare responses are distinct from hypermutant adult glioblastomas originating as a result of previous chemo-radiotherapy, where true progression is reported more frequently than pseudo-progression32. The higher prevalence of flare (26%) in our study, and the prolonged survival in patients who continued therapy, further support this notion. Although vaccine-based approaches lead to a significant local immune response59, these may be driven by different mechanisms. Indeed the timing of flare was earlier (median: 34 days) as compared to that reported in studies in adult patients with glioblastoma treated using immune-directed approaches (median: 10 weeks; commonly <3 to up to 6 months)59. Although the observations of intra-tumoral inflammatory response at flare are limited and need to be ratified in larger cohorts, our data, which demonstrate similar genomic and immune profile among tumors which responded and those that developed flare, can explain the late responses observed in patients where therapy was continued. This highlights the importance of developing novel functional imaging techniques60 and minimally invasive biomarkers61 to better predict and diagnose tumor flare, and innovative strategies to modulate this aggressive immune response.
Despite the limitations of a registry study, this is the first description of a large cohort of children and young adults with previously fatal, recurrent/progressive germline DNA replication repair-deficient cancers, demonstrating impressive responses to PD-1 blockade. Importantly, this registry study was able to collect germline and tumor tissue from all patients, including longitudinal blood samples and relapsed tumor tissues whenever repeat surgeries were performed, which has historically not been performed in prospective paediatric studies including recent immunotherapy trials. The robustness and consistency of our results for response, survival and predictive biomarkers despite the heterogeneity of our cohort support a strong biologic rationale for use of ICI in this rare patient population. Although longer follow-up is required to determine whether immunotherapy can be a curative strategy for RRD cancers, the sustained responses and lack of late relapses in a significant number of patients in this cohort are encouraging. This study also sheds light on the complex interplay between the tumor genomic status, microenvironment, and the systemic immune response, especially in the context of extreme mutation and MS-indel burdens. Future trials should prospectively analyse the roles of germline versus somatic deficiency, and the components of the replication repair machinery, to identify patients who are likely to derive maximal benefit from anti-PD-1 immunotherapy. Last, our study highlights the impact of studying a genetic cancer syndrome to understand general cancer processes and deriving direct therapeutic implications for patients.
Methods
Study design and patients
Patients were identified through the International Replication Repair Deficiency Consortium (IRRDC), based at SickKids, Toronto. The IRRDC has enrolled >200 patients from 45 countries since 2007. Patients with confirmed /suspected replication repair deficiency were eligible. The SickKids Research Ethics Board approved the study. Consent was obtained from patients and families. This included submission of clinical and imaging data, and tissue and blood samples for centralized analysis. Germline diagnosis of constitutional MMRD, Lynch or PPD were confirmed by the IRRDC’s genetic counsellor (MA), based on the family history, next-generation panel sequencing of germline samples for MMR and POLE/ POLD1 genes (performed locally or centrally at CLIA-approved laboratories), and immunohistochemical (IHC) staining pattern of the tumor and normal tissues (CH). Thirty-eight patients with 45 cancers who had received treatment with anti-PD1-directed immune checkpoint inhibitor (ICI) therapy are reported here. Patients followed treatment as per the guidelines shared with the collaborators by the IRRDC. These guidelines were derived from ongoing clinical trials, with standard guidelines for monitoring safety and stopping rules for toxicity, as per the ongoing multi-centric clinical trial protocol (NCT02992964). However, patients were not treated prospectively as part of the trial. Ultimately, the choice of the agent and the nuances of therapy remained at the discretion of the treating team. Monthly, and as-needed meetings were coordinated to track progress, address safety concerns if any, and collect data in real-time. Blood samples for companion biomarker studies were collected prospectively before and on therapy following informed consent at specified time-points as per NCT02992964.
Clinical records were reviewed to obtain patient demographics, cancer diagnosis, date of initiation and completion of ICI, choice of ICI agent, and survival outcomes (including date of disease progression and/or patient death). Centralized pathology, radiology, molecular, and biomarker analyses were performed for all. Imaging at baseline and following initiation of ICI were obtained for central review of objective tumor response. For the remaining cases, response (or otherwise) was determined by the assessment of the local treating team. Available scans were centrally reviewed by a radiologist blind to the clinically determined response, and tumor measurements were documented according to the RANO criteria28. In brief, the best tumor response was determined as the percentage change in the product of bi-perpendicular dimensions from baseline on the contrast-enhanced T1 images. Complete response (CR) was defined as the disappearance of all enhancing disease (measurable and non-measurable) sustained for at least 4 weeks, with stable or improved non-enhancing FLAIR/T2W lesions, no new lesions and clinical stability. Partial response (PR) was defined as 50% or more decrease of all measurable enhancing lesions sustained for at least 4 weeks, with no progression of non-measurable disease, stable or improved non-enhancing FLAIR/T2W lesions, no new lesions and clinical stability. Stable disease (SD) was defined as images that did not qualify for complete response, partial response, or progression, with stable non-enhancing FLAIR/T2W lesions and clinical stability. Progressive disease (PD) was defined as 25% or more increase in enhancing lesions, with increase (significant) in non-enhancing FLAIR/T2W lesions, not attributable to other non-tumor causes any new lesions, and clinical deterioration not attributable to other causes. For patients with non-CNS solid tumors, the revised RECIST (v.1.1) was used29. CR was defined as complete disappearance, PR as at least 30% decrease in sum of the diameters, PD as at least 20% increase in the sum of the diameters of the target lesion, and SD as lack of sufficient change to be classified as CR/ PR/ PD. Patients with objective radiological response (CR/PR) and/ or stable disease (SD) were labelled as ‘responders.’ Among those with progressive disease, patients experiencing rapid early clinical and/or radiological deterioration (with > 100% increase in tumor size within 90 days of starting ICI therapy) were defined as demonstrating a ‘flare’ response and were studied in more detail. For patients able to continue ICI, subsequent imaging was reviewed to confirm response or progression. Those with sustained clinical and/or radiological progression despite continuation of ICI treatment were classified as ‘non-responders.’ For biomarker prediction analyses, ‘responders’ also included those with an initial ‘flare,’ who continued on ICI and demonstrated delayed responses.
Whole exome sequencing and analysis
Genomic DNA from 39 tumors, along with matched germline blood samples, was extracted using the PaxGene Blood DNA Extraction Kit (Cat No./ID: 761133) for blood samples, Qiagen DNeasy Blood & Tissue Kits (Cat No./ID: 69504) for frozen tissue, MasterPure Complete DNA and RNA Purification Kit (Epicentre #MC85200) for paraffin embedded tissue). WES was performed at The Centre for Applied Genomics (TCAG), SickKids, using SureSelect Agilent All Exon v5 kit, followed by sequencing (100X) on Illumina HiSeq 2500. The software bcl2fastq2 v2.17 was used to generate raw fastq files. Alignment to the hg38 reference genome using Burrows-Wheeler Alignment version 0.7.12 (ref. 62), followed by pre-processing which included flagging PCR duplicate reads using Picard MarkDuplicates tool (version 1.130). For each tumor and normal tissue data pair, regions with insertions and deletions (Indels) were realigned using GATK IndelRealigner (version 1.130) to minimize number of mismatched bases across all reads, followed by base recalibration. This was adapted from the GATK best practices for whole exome and genome analysis63–65 optimized for our laboratory’s workflow66. Somatic variant calling was done post-alignment, using processed bam files from tumor and matched normal samples, to call both single nucleotide variants (SNVs) and insertion deletion (indel) variants. A consensus vcf file of shared variants across 2 or more of 4 variant callers (Mutect v1.1.5)67, GATK v3.6/Mutect2, Strelka v1.0.14 (ref. 68), and Varscan2 Somatic v2.4.2 (ref. 69) was generated for SNVs and indels separately, using VCFtools v.0.1.15 (ref. 70), and these vcfs were annotated using VEP v83 (ref. 71). The TMB from WES data was calculated by counting total number of somatic SNVs divided by total number of callable bases in megabases (~50 Mb). DeconstructSigs72 was used to determine COSMIC signatures31 in the mutation spectrum within a tri-nucleotide context for each sample. All bioinformatics analyses were performed on the SickKids and UHN High-Performance Clusters.
HLA-typing
Paired end fastq files from matched germline WES data were used as input to computationally determine HLA Class-I types for 39 tumors using a consensus of HLAminer73, and HLAVBSeq74, as described and validated in a previous study in our laboratory75. The top 6 HLA-types were used as input for neoantigen calling as described below.
Neoantigen calling
The Mutect2 vcfs generated for each tumor (described above) were used as input along with bioinformatically generated HLA-types (above) for MuPeXI76, to get a list of strong binding candidate neoantigens per HLA-type. This uses netMHCpan77 (to calculate all variant peptides ranging from 8–12 mer, and total candidate neoantigens was determined by selecting all neoantigens that showed ‘%rank’<0.5 binding affinity, denoting all strong binders (as recommended by the netMHCpan user manual). It is to be noted that all candidate neoantigens were restricted to class-I MHC proteins only.
Microsatellite indel calling
Microsatellite indels were called on the bam files of tumor and matched normal samples, using an in-house pipeline using MSMuTect v1.0 (ref. 36). The detailed methods for this algorithm have been previously reported36. In brief, repeats of five or more nucleotides were considered to be MS loci, and using the PHOBOS algorithm and the lobSTR approach, tumor and normal BAM files were aligned with their 5’ and 3’ flanking sequences. Each MS-locus allele was estimated using the empirical noise model, which is the probability of observing a read with a microsatellite (MS) length k and motif m, where the true length of the allele is j with the motif m. This was used to call the MS alleles with the highest likelihood of being the true allele at each MS-locus. The MS alleles of each tumor and matched normal pair were called individually, which were compared to identify the mutations on the tumor MS-loci. The Akaike Information Criterion (AIC) score was assigned to both the tumor and normal models, and a threshold score that was determined using simulated data was applied to make the final MS-indel call.
Neoantigens from coding microsatellites
Microsatellite indels were called using MSMuTect v1.0 (ref. 36). The Indels were annotated using the Ensembl Variant Effect Predictor71 (VEP release/104.2). Neoantigens were identified using pVAC-seq78 software suite. Using NetMHCpan4.1 (ref. 77) algorithm (included in pVAC-seq), we predicted 8- and 9-mer neoantigens with strong binding affinity (score ≤ 500 nM) to the patients’ HLA class I (A, B, or C).
Clonal TMB analysis
To determine the clonal status of each mutation, we first determined allele-specific tumor copy number by applying FACETSv0.5.6 to the 39 tumor-normal exome pairs79. The snp-pileup command was run using the parameters –q15 –Q20 –P100 –r25,0 to generate the necessary allele fraction and depth information for FACETS. FACETS was then run using default parameters. To ensure accuracy, manual review of the FACETS copy number estimate solutions was conducted for each of the 39 tumor-normal pairs. Many hypermutant tumor samples are typically diploid, which can confound copy number estimation. In these cases, we manually assigned the tumor’s diploid status (based on LogR and BAF plots showing no copy changes), and manually assigned the purity by doubling the value of the highest variant allele fraction peak (as would be expected in a diploid tumor with a mutation on one tumor allele). A custom script was then used to merge the total and alternate read counts for each mutation with the sample purity and allele-specific copy number estimates for input into the ABSOLUTE method. We used the ABSOLUTE method to determine the cancer cell fraction, clonal or sub-clonal status of each SSM mutation, and confidence intervals of the cancer cell fraction estimate80. The ABSOLUTE method functionally achieves the same aim of mutation clonality status assignment as PyClone. Mutations were defined as clonal if the 95% confidence interval of the cancer cell fraction estimate overlapped with 1 and sub-clonal otherwise. For a number of tumors, reliable copy number, mutation and purity estimations could not be extracted, rendering clonal architecture analysis intractable and these tumors were omitted from the analysis. In the end, clonal and sub-clonal SNVs were computed and are reported for 21 tumors.
Immunohistochemistry
Four-micron thick sections of formalin-fixed paraffin-embedded (FFPE) surgical specimens were stained using an automated stainer (Dako-OMNIS) with the following primary antibodies: PD-L1 (clone:28-8, Abcam), CD68 (Clone:PG-M1, Dako-OMNIS), CD8 (Clone:c8/144B, Dako-OMINS), CD3 (polyclonal rabbit, Dako-OMNIS), and CD4 (Clone:SP35, Sigma-Aldrich). Quantitative evaluation of the immunohistochemical stains was performed by examining each section using at least 5-7 different high-power fields with the most abundant tumor-infiltrating lymphocyte areas. The tumor was considered PD-L1 positive if ≥1% of tumor cells exhibited a circumferential and/or partial linear plasma membrane PD-L1 staining of tumor cells at any intensity81. The percentage of infiltrating immune system cells was estimated by manual eyeballing as none, mild, moderate, and severe (0 = none, <10%=mild, 10–50%=moderate, >50%=severe). For downstream analyses, infiltration higher than the median values of the continuous data of immune infiltrates was used to classify tumors as ‘high’ or ‘low’ infiltration for each marker. All immunohistochemistry was reviewed blindly and independently scored by two teams of pathologists (CH/NA and OK) centrally with good concordance (Supplementary Fig. 7).
Immune-inference analysis
RNA was extracted as per standard-kit protocol from tumors biopsied at both, baseline and time of flare, in 2 patients (P31, P33) and submitted for total r-RNA depletion RNAsequencing on HiSeq 2500, at TCAG. Following sequencing, 126 bp paired-end reads from the raw data were aligned to the hg19 reference genome generated using STAR aligner v.2.4.2a (ref. 82), followed by RSEM v.1.2.21 (ref. 83) expression analysis to generate a gene-expression matrix for each sample using the TPM values. The analysis was restricted to only coding genes. This was then run through CIBERSORT in the absolute mode84, to generate immune inference data for 22 immune cell subtypes. The immune inference results from CIBERSORT_absolute85–88 were plotted using ‘ComplexHeatmap’89 package on Rv.3.5. In addition, immune inference was also derived using a complementary deconvolution method EPIC90 as previously published and we found concordance between CIBERSORT_absolute and EPIC, which was represented as side-by-side bar-plots (Supplementary Fig. 8). The parameters used for running EPIC involved tumor-signature matrix to call tumor infiltrating cells. These results were then exported as cell fractions.
T cell receptor rearrangement repertoire (TCR) profiling
Genomic DNA was extracted (above) from tumors biopsied at both baseline and at time of flare in 2 patients (P31 and P33). Library preparation and capTCRseq91 hybrid capture were performed. Following library preparation, the samples were sequenced first on a MiSeq for QC purposes and then 300 ng of each sample, pooled in a ratio of 1:1:1, was processed for a 3-step capture using target hybrid capture panel91. Post-capture QC was performed on a MiSeq, followed by sequencing of up to a depth of ~2 million reads on the NextSeq. After sequencing, the raw data were analyzed using MiXCR version 2.1.12 (ref. 92), ‘iNext’, ‘immunarch’ R packages and Pugh Lab customized functions on R version 3.5 to look at T cell receptor rearrangements in the form of unique clonotypes (VDJ rearranged sequences) for T cell receptors alpha, beta, gamma and delta. As the total read depth varied across the cohort, affecting the total successfully aligned reads, all raw fastq reads were down-sampled to ~1 million reads. QC parameters of percent aligned reads, reads used in clonotypes, final clonotype count and the total number of clonotypes per 1000 reads were considered. To quantitatively explain TCR diversity and clonality, we constructed diversity profiles93 of each sample (Supplementary Fig. 9), which is a continuum of hill numbers with varying orders (q = c (0, inf)). Hill numbers were calculated as:
where S was the number of clonotypes in the assemblage, pi was the relative abundance of the ith clonotype and q was defined as the order of the diversity 1. As q determines the sensitivity to clonotypes’ relative abundances. q = 0 returned the most intuitive and frequently used measure of clonal diversity (Richness), which was the count of the number of clonotypes present in a sample. In order to describe the amount of distinct clonotypes present in a dataset, while taking into account the relative abundance of the clonotypes, we added another popular measure based on q → 1 limit of the above-mentioned (Shannon diversity), calculated as follows:
The parameter q was used to emphasize or de-emphasize the weight of abundance or rare clonotypes. We kept increasing the q and calculating the diversities. As q increased, all the clonotypes, except for dominant ones, were discounted and the resulting value was interpreted as the effective number of dominant clonotypes in the sample. To overcome the known caveat of TCR-sequencing in detecting false absence of a CDR3 due to tumor heterogeneity or insufficient sequencing, we devised a method to calculate the completeness of sequencing data and ensure comparison of samples of equivalent completeness. This prevented inaccurate comparisons between diversity signatures of different samples. For each sample, we constructed models to calculate the completeness of sequencing data to minimize the false absence events taking place due to sequencing insufficiency. One of the samples in our study reached a mathematical saturation point, where first derivatives of the clonotype count versus total sequencing reads functions reached zero. One of the samples, however, was not sequenced to enough depth to reach saturation. Even though the depth was not enough to fully cover all the clonotypes present within the repertoire, the sample showed higher richness compared to its pre-ICI repertoire, supporting our observation regarding increased richness at time of flare.
Flow cytometry
Viable frozen peripheral blood mononuclear cells were incubated with Fc block (BD Biosciences) prior to staining for surface markers (anti-CD3-clone UCHT1, anti-CD4–clone RPA-T4, anti-CD8–clone RPA-T8, anti-4-1BB–clone 4B4-1, anti-TIGIT– clone MBSA43, anti-Ki67–clone 20Raj1) and viability dye (eBioscience). Cells were fixed and permeabilized for intercellular staining with the Foxp3 transcription factor staining buffer set (BD). Flow cytometry voltages were set using Rainbow beads (Spherotech) with the same setting between experiments. Samples were acquired on a BD LSR Fortessa flow cytometer and data were analyzed using the FlowJo software.
Statistical analysis and reproducibility
Overall survival (OS) and event-free survival (EFS) was estimated using Kaplan-Meier statistics and determined from the date of initiation of ICI therapy. Patients without an event were censored at the date of last known contact. Uniquely in this population, several patients had multiple separate synchronous malignancies and therefore in these analyses, survival is presented for each individual cancer/tumor in addition to analyses per patient. For example, for the tumor-wise analysis, a patient experiencing an event related to one cancer diagnosis, was shown as censored (rather than an event) for a second synchronous cancer. Univariable logistic regression, estimated through generalized estimating equations, was fitted to assess association between each clinical factor and response. Specifically, for ethnicity, patients were divided into three groups: Caucasian, Hispanic, and others [including Asians (n=2), African-American (n=1), and aboriginal Australian (n=1) due to individual low numbers]. Fisher’s exact test was used to assess association between tumor site and response (due to zero-count cells). Univariable Cox-regression model with robust standard errors was fitted to assess association between each clinical factor and OS. Log-rank test was used to assess association between tumor site and survival. For all biomarkers used in survival analyses, the median for each analysed cohort was chosen as the cut-off for high versus low. Correlation between biomarkers was tested using Spearman’s rank correlation co-efficient test and effects-sizes were estimated for independent predictor variables. Univariable logistic regression, estimated through generalized estimating equations, was fitted to assess association between each biomarker and response. Univariable Cox-regression model with robust standard errors was fitted to assess association between each biomarker and OS. Multivariate analyses were performed for SNVs and MS-indels. Multivariable logistic regression, estimated through generalized estimating equations, was fitted to assess association of SNVs (cut-off at median) and MSI (cut-off at median) with response. Multivariable Cox-regression model with robust standard errors was fitted to assess association of SNVs (cut-off at median) and MSI (cut-off at median) with overall survival. Statistical significance was calculated using Welch’s unequal variances t-test and the Wilcoxon–Mann-Whitney test, for parametric and non-parametric data, respectively. Among MMRD tumors, a single outlier (annotated with a star) was excluded from p-value estimation, as this was a brain tumor which transformed from low to high-grade over several years which plausibly led to higher MS-indel accumulation. All p-values were 2-sided, with a cut-off of 0.05 for significance. Statistical analyses were performed with SPSS v.20, R v.3.5 and Python v.2.7. The generated plots were edited for aesthetics using Adobe Illustrator v.23.0.1.
Reporting Summary
Further information on research design is available in the Nature Research Reporting Summary linked to this article.
Online content
Any methods, additional references, Nature Research reporting summaries, source data, extended data, supplementary information, acknowledgements, peer review information; details of author contributions and competing interests; and statements of data and code availability are available at 10.1038/s41591-021-01581-6.
Supplementary information
Supplementary Figs. 1–11 and Supplementary Table 1
Acknowledgements
This research is supported by a Stand Up to Cancer- Bristol-Meyers Squibb Catalyst Research Grant (Grant Number: SU2C-AACR-CT07-17; U.T.), which is administered by the American Association for Cancer Research, the scientific partner of SU2C, BioCanRx (FY17/18/ES8; U.T.)- Canada’s Immunotherapy Network (a Network Centre of Excellence), the Canadian Institutes for Health Research (CIHR) grant (PJT-156006; U.T.), the CIHR Joint Canada-Israel Health Research Program (108188-001; U.T.), the V Foundation for Cancer Research (T2019-016; U.T.), St. Baldrick’s Foundation International Scholar Award (with generous support from the Team Campbell Foundation; Grant number: 697257; A.D.), Meagan’s Hug (MW-2014-10; U.T.), LivWise Foundation, the Zane Cohen Centre, BRAINchild Foundation, the Elmaagacli Family Fund, Guglietti We Love You Connie Foundation (P.O.), SickKids Research Training Center Clinician-Scientist Training Program (Fall 2019 award; A.D.), Early Researcher Award from the Ontario Ministry of Research and Innovation (A.S.), the Canada Research Chair in Childhood Cancer Genomics (A.S.), and the Robert J. Arceci Innovation Award from the St. Baldrick’s Foundation (A.S.).
Extended data
Source data
Excel with all clinical and sequencing results used for statistical analyses
Author contributions
D.M., U.T. and E.B. planned the study. A.D. and U.T. wrote the manuscript. A.C. and M.S. reported the radiology. N.A., C.H. and O.K. reported the pathology. S.S., A.S., D.C., M.Z., S.S., A.N. and T.P. were responsible for the bioinformatics analysis. J.C., Y.M., H.L. and G.G. were responsible for the microsatellite indel analysis. S.S. and P.O. were responsible for the flow cytometry studies. A.D., S.S., Z.A.L. and W.X. analysed the statistics. V.B., A.E. and M.E. were involved in patient enrolment and sample coordination. Those involved in patient management included E.B., D.M., V.C., L.F.N., L.S., S.C., M.O., R.D., G.A.C., S.C., V.L., A.R., M.O., G.M., S.L., A.B., V.M., E.O., R.L.D.M., A.D., M.S., C.F., D.S., D.S., K.C., S.C., M.M., P.T., D.Z., B.G., A.V.D., N.H., D.G., R.M., K.E.N., M.Z., O.M., D.M., T.L., A.L., D.M., T.S., L.Y.Y., J.K. A.B., L.H., S.L.F., S.Z., I.S., D.S., P.D., M.T., A.K., D.T., D.M., A.V., M.A., C.D., M.A. and U.T. All authors have reviewed and agreed to the contents of the manuscript.
Data availability
All data relevant to this work are available at the European Genome Phenome Archive (EGA: https://ega-archive.org/studies/EGAS00001005579; Study EGAS00001005579; Dataset EGAD00001008036) and can be accessed through communication with the corresponding author. Clinical data are listed in Supplementary Table 1. Reference genomes were downloaded from the publicly available resources at https://genome.ucsc.edu. Source data are provided with this paper.
Competing interests
The authors declare no competing interests.
Footnotes
Peer review information Nature Medicine thanks Pratiti Bandopadhayay and the other, anonymous, reviewer(s) for their contribution to the peer review of this work. Javier Carmona was the primary editor on this article and managed its editorial process and peer review in collaboration with the rest of the editorial team.
Publisher’s note Springer Nature remains neutral with regard to jurisdictional claims in published maps and institutional affiliations.
These authors contributed equally: Anirban Das, Sumedha Sudhaman, Daniel Morgenstern.
Extended data
are available for this paper at 10.1038/s41591-021-01581-6.
Supplementary information
The online version contains supplementary material available at 10.1038/s41591-021-01581-6.
References
- 1.Cortez D. Replication-coupled DNA repair. Mol. Cell. 2019;74:866–876. doi: 10.1016/j.molcel.2019.04.027. [DOI] [PMC free article] [PubMed] [Google Scholar]
- 2.Campbell BB, et al. Comprehensive analysis of hypermutation in human cancer. Cell. 2017;171:1042–1056. doi: 10.1016/j.cell.2017.09.048. [DOI] [PMC free article] [PubMed] [Google Scholar]
- 3.Chung J, et al. DNA polymerase and mismatch repair exert distinct microsatellite instability signatures in normal and malignant human cells. Cancer Discov. 2021;11:1176–1191. doi: 10.1158/2159-8290.CD-20-0790. [DOI] [PMC free article] [PubMed] [Google Scholar]
- 4.Mur P, et al. Role of POLE and POLD1 in familial cancer. Genet. Med. 2020;22:2089–2100. doi: 10.1038/s41436-020-0922-2. [DOI] [PMC free article] [PubMed] [Google Scholar]
- 5.Seppälä TT, et al. European guidelines from the EHTG and ESCP for Lynch syndrome: an updated third edition of the Mallorca guidelines based on gene and gender. Br. J. Surg. 2021;108:484–498. doi: 10.1002/bjs.11902. [DOI] [PMC free article] [PubMed] [Google Scholar]
- 6.Tabori U, et al. Clinical management and tumor surveillance recommendations of inherited mismatch repair deficiency in childhood. Clin. Cancer Res. 2017;23:e32–e37. doi: 10.1158/1078-0432.CCR-17-0574. [DOI] [PubMed] [Google Scholar]
- 7.Amayiri N, et al. High frequency of mismatch repair deficiency among pediatric high grade gliomas in Jordan. Int. J. Cancer. 2016;138:380–385. doi: 10.1002/ijc.29724. [DOI] [PubMed] [Google Scholar]
- 8.Shlien A, et al. Combined hereditary and somatic mutations of replication error repair genes result in rapid onset of ultra-hypermutated cancers. Nat. Genet. 2015;47:257–262. doi: 10.1038/ng.3202. [DOI] [PubMed] [Google Scholar]
- 9.Liu D, et al. Integrative molecular and clinical modeling of clinical outcomes to PD1 blockade in patients with metastatic melanoma. Nat. Med. 2019;25:1916–1927. doi: 10.1038/s41591-019-0654-5. [DOI] [PMC free article] [PubMed] [Google Scholar]
- 10.Garon EB, et al. Pembrolizumab for the treatment of non-small-cell lung cancer. N. Engl. J. Med. 2015;372:2018–2028. doi: 10.1056/NEJMoa1501824. [DOI] [PubMed] [Google Scholar]
- 11.Topalian SL’, et al. Five-year survival and correlates among patients with advanced melanoma, renal cell carcinoma, or non-small cell lung cancer treated with nivolumab. JAMA Oncol. 2019;5:1411–1420. doi: 10.1001/jamaoncol.2019.2187. [DOI] [PMC free article] [PubMed] [Google Scholar]
- 12.McGrail DJ, et al. High tumor mutation burden fails to predict immune checkpoint blockade response across all cancer types. Ann. Oncol. 2021;32:661–672. doi: 10.1016/j.annonc.2021.02.006. [DOI] [PMC free article] [PubMed] [Google Scholar]
- 13.Rousseau B, et al. The spectrum of benefit from checkpoint blockade in hypermutated tumors. N. Engl. J. Med. 2021;384:1168–1170. doi: 10.1056/NEJMc2031965. [DOI] [PMC free article] [PubMed] [Google Scholar]
- 14.Gromeier M, et al. Very low mutation burden is a feature of inflamed recurrent glioblastomas responsive to cancer immunotherapy. Nat. Commun. 2021;12:352. doi: 10.1038/s41467-020-20469-6. [DOI] [PMC free article] [PubMed] [Google Scholar]
- 15.Geoerger B, et al. Pembrolizumab in paediatric patients with advanced melanoma or a PD-L1-positive, advanced, relapsed, or refractory solid tumour or lymphoma (KEYNOTE-051): interim analysis of an open-label, single-arm, phase 1-2 trial. Lancet Oncol. 2020;21:121–133. doi: 10.1016/S1470-2045(19)30671-0. [DOI] [PubMed] [Google Scholar]
- 16.Le DT, et al. PD-1 blockade in tumors with mismatch-repair deficiency. N. Engl. J. Med. 2015;372:2509–2520. doi: 10.1056/NEJMoa1500596. [DOI] [PMC free article] [PubMed] [Google Scholar]
- 17.Le DT, et al. Phase II open-label study of pembrolizumab in treatment-refractory, microsatellite instability-high/mismatch repair-deficient metastatic colorectal cancer: KEYNOTE-164. J. Clin. Oncol. 2020;38:11–19. doi: 10.1200/JCO.19.02107. [DOI] [PMC free article] [PubMed] [Google Scholar]
- 18.André T, et al. Pembrolizumab in microsatellite-instability-high advanced colorectal cancer. N. Engl. J. Med. 2020;383:2207–2218. doi: 10.1056/NEJMoa2017699. [DOI] [PubMed] [Google Scholar]
- 19.Marabelle A, et al. Association of tumour mutational burden with outcomes in patients with advanced solid tumours treated with pembrolizumab: prospective biomarker analysis of the multicohort, open-label, phase 2 KEYNOTE-158 study. Lancet Oncol. 2020;21:1353–1365. doi: 10.1016/S1470-2045(20)30445-9. [DOI] [PubMed] [Google Scholar]
- 20.Schrock AB, et al. Tumor mutational burden is predictive of response to immune checkpoint inhibitors in MSI-high metastatic colorectal cancer. Ann. Oncol. 2019;30:1096–1103. doi: 10.1093/annonc/mdz134. [DOI] [PubMed] [Google Scholar]
- 21.Marabelle A, et al. Efficacy of pembrolizumab in patients with noncolorectal high microsatellite instability/mismatch repair-deficient cancer: results from the phase II KEYNOTE-158 study. J. Clin. Oncol. 2020;38:1–10. doi: 10.1200/JCO.19.02105. [DOI] [PMC free article] [PubMed] [Google Scholar]
- 22.Sampson JH, Gunn MD, Fecci PE, Ashley DM. Brain immunology and immunotherapy in brain tumours. Nat. Rev. Cancer. 2020;20:12–25. doi: 10.1038/s41568-019-0224-7. [DOI] [PMC free article] [PubMed] [Google Scholar]
- 23.Geoerger B, et al. Atezolizumab for children and young adults with previously treated solid tumours, non-Hodgkin lymphoma, and Hodgkin lymphoma (iMATRIX): a multicentre phase 1-2 study. Lancet Oncol. 2020;21:134–144. doi: 10.1016/S1470-2045(19)30693-X. [DOI] [PubMed] [Google Scholar]
- 24.Merchant MS, et al. Phase I clinical trial of ipilimumab in pediatric patients with advanced solid tumors. Clin. Cancer Res. 2016;22:1364–1370. doi: 10.1158/1078-0432.CCR-15-0491. [DOI] [PMC free article] [PubMed] [Google Scholar]
- 25.Davis KL, et al. Nivolumab in children and young adults with relapsed or refractory solid tumours or lymphoma (ADVL1412): a multicentre, open-label, single-arm, phase 1-2 trial. Lancet Oncol. 2020;21:541–550. doi: 10.1016/S1470-2045(20)30023-1. [DOI] [PMC free article] [PubMed] [Google Scholar]
- 26.Martin-Romano P, et al. Evidence of pseudoprogression in patients treated with PD1/PDL1 antibodies across tumor types. Cancer Med. 2020;9:2643–2652. doi: 10.1002/cam4.2797. [DOI] [PMC free article] [PubMed] [Google Scholar]
- 27.Bouffet E, et al. Immune checkpoint inhibition for hypermutant glioblastoma multiforme resulting from germline biallelic mismatch repair deficiency. J. Clin. Oncol. 2016;34:2206–2211. doi: 10.1200/JCO.2016.66.6552. [DOI] [PubMed] [Google Scholar]
- 28.Wen PY, et al. Updated response assessment criteria for high-grade gliomas: response assessment in neuro-oncology working group. J. Clin. Oncol. 2010;28:1963–1972. doi: 10.1200/JCO.2009.26.3541. [DOI] [PubMed] [Google Scholar]
- 29.Eisenhauer EA, et al. New response evaluation criteria in solid tumours: revised RECIST guideline (version 1.1) Eur. J. Cancer. 2009;45:228–247. doi: 10.1016/j.ejca.2008.10.026. [DOI] [PubMed] [Google Scholar]
- 30.Yoshida T, Furuta H, Hida T. Risk of tumor flare after nivolumab treatment in patients with irradiated field recurrence. Med. Oncol. 2017;34:34. doi: 10.1007/s12032-017-0895-4. [DOI] [PubMed] [Google Scholar]
- 31.Alexandrov LB, et al. The repertoire of mutational signatures in human cancer. Nature. 2020;578:94–101. doi: 10.1038/s41586-020-1943-3. [DOI] [PMC free article] [PubMed] [Google Scholar]
- 32.Touat M, et al. Mechanisms and therapeutic implications of hypermutation in gliomas. Nature. 2020;580:517–523. doi: 10.1038/s41586-020-2209-9. [DOI] [PMC free article] [PubMed] [Google Scholar]
- 33.McGranahan N, et al. Clonal neoantigens elicit T cell immunoreactivity and sensitivity to immune checkpoint blockade. Science. 2016;351:1463–1469. doi: 10.1126/science.aaf1490. [DOI] [PMC free article] [PubMed] [Google Scholar]
- 34.Le DT, et al. Mismatch repair deficiency predicts response of solid tumors to PD-1 blockade. Science. 2017;357:409–413. doi: 10.1126/science.aan6733. [DOI] [PMC free article] [PubMed] [Google Scholar]
- 35.Mandal R, et al. Genetic diversity of tumors with mismatch repair deficiency influences anti-PD-1 immunotherapy response. Science. 2019;364:485–491. doi: 10.1126/science.aau0447. [DOI] [PMC free article] [PubMed] [Google Scholar]
- 36.Maruvka YE, et al. Analysis of somatic microsatellite indels identifies driver events in human tumors. Nat. Biotechnol. 2017;35:951–959. doi: 10.1038/nbt.3966. [DOI] [PMC free article] [PubMed] [Google Scholar]
- 37.Llosa NJ, et al. The vigorous immune microenvironment of microsatellite instable colon cancer is balanced by multiple counter-inhibitory checkpoints. Cancer Discov. 2015;5:43–51. doi: 10.1158/2159-8290.CD-14-0863. [DOI] [PMC free article] [PubMed] [Google Scholar]
- 38.Huang AC, et al. T-cell invigoration to tumour burden ratio associated with anti-PD-1 response. Nature. 2017;545:60–65. doi: 10.1038/nature22079. [DOI] [PMC free article] [PubMed] [Google Scholar]
- 39.Watts TH. TNF/TNFR family members in costimulation of T cell responses. Annu. Rev. Immunol. 2005;23:23–68. doi: 10.1146/annurev.immunol.23.021704.115839. [DOI] [PubMed] [Google Scholar]
- 40.Clouthier DL, et al. An interim report on the investigator-initiated phase 2 study of pembrolizumab immunological response evaluation (INSPIRE) J. Immunother. Cancer. 2019;7:72. doi: 10.1186/s40425-019-0541-0. [DOI] [PMC free article] [PubMed] [Google Scholar]
- 41.Blumenthal DT, et al. Pembrolizumab: first experience with recurrent primary central nervous system (CNS) tumors. J. Neurooncol. 2016;129:453–460. doi: 10.1007/s11060-016-2190-1. [DOI] [PubMed] [Google Scholar]
- 42.Haworth KB, et al. Going back to class I: MHC and immunotherapies for childhood cancer. Pediatr. Blood Cancer. 2015;62:571–576. doi: 10.1002/pbc.25359. [DOI] [PMC free article] [PubMed] [Google Scholar]
- 43.Majzner RG, et al. Assessment of programmed death-ligand 1 expression and tumor-associated immune cells in pediatric cancer tissues. Cancer. 2017;123:3807–3815. doi: 10.1002/cncr.30724. [DOI] [PubMed] [Google Scholar]
- 44.Khasraw M, Reardon DA, Weller M, Sampson JH. PD-1 inhibitors: do they have a future in the treatment of glioblastoma? Clin. Cancer Res. 2020;26:5287–5296. doi: 10.1158/1078-0432.CCR-20-1135. [DOI] [PMC free article] [PubMed] [Google Scholar]
- 45.Kato S, et al. Expression of TIM3/VISTA checkpoints and the CD68 macrophage-associated marker correlates with anti-PD1/PDL1 resistance: implications of immunogram heterogeneity. Oncoimmunology. 2020;9:1708065. doi: 10.1080/2162402X.2019.1708065. [DOI] [PMC free article] [PubMed] [Google Scholar]
- 46.Stahl M, et al. Risk of recurrence and survival after relapse in patients with Ewing sarcoma. Pediatr. Blood Cancer. 2011;57:549–553. doi: 10.1002/pbc.23040. [DOI] [PubMed] [Google Scholar]
- 47.London WB, et al. Historical time to disease progression and progression-free survival in patients with recurrent/refractory neuroblastoma treated in the modern era on Children’s Oncology Group early-phase trials. Cancer. 2017;123:4914–4923. doi: 10.1002/cncr.30934. [DOI] [PMC free article] [PubMed] [Google Scholar]
- 48.Hayes-Jordan AA, et al. Colon cancer in patients under 25 years old: a different disease? J. Am. Coll. Surg. 2020;230:648–656. doi: 10.1016/j.jamcollsurg.2019.12.043. [DOI] [PubMed] [Google Scholar]
- 49.Akinkuotu AC, Maduekwe UN, Hayes-Jordan A. Surgical outcomes and survival rates of colon cancer in children and young adults. Am. J. Surg. 2021;221:718–724. doi: 10.1016/j.amjsurg.2021.02.010. [DOI] [PubMed] [Google Scholar]
- 50.Wang J, et al. Metastatic patterns and survival outcomes in patients with stage IV colon cancer: a population-based analysis. Cancer Med. 2020;9:361–373. doi: 10.1002/cam4.2673. [DOI] [PMC free article] [PubMed] [Google Scholar]
- 51.Bajorin DF, et al. Long-term survival in metastatic transitional-cell carcinoma and prognostic factors predicting outcome of therapy. J. Clin. Oncol. 1999;17:3173–3181. doi: 10.1200/JCO.1999.17.10.3173. [DOI] [PubMed] [Google Scholar]
- 52.Azad NS, et al. Nivolumab Is effective in mismatch repair-deficient noncolorectal cancers: results from arm Z1D-A subprotocol of the NCI-MATCH (EAY131) Study. J. Clin. Oncol. 2020;38:214–222. doi: 10.1200/JCO.19.00818. [DOI] [PMC free article] [PubMed] [Google Scholar]
- 53.Thomas R, Wang W, Su DM. Contributions of age-related thymic involution to immunosenescence and inflammaging. Immun. Ageing. 2020;17:2. doi: 10.1186/s12979-020-0173-8. [DOI] [PMC free article] [PubMed] [Google Scholar]
- 54.Campbell BB, et al. Mutations in the RAS/MAPK pathway drive replication repair deficient hypermutated tumors and confer sensitivity to MEK inhibition. Cancer Discov. 2021;11:1454–1467. doi: 10.1158/2159-8290.CD-20-1050. [DOI] [PMC free article] [PubMed] [Google Scholar]
- 55.Cloughesy TF, et al. Neoadjuvant anti-PD-1 immunotherapy promotes a survival benefit with intratumoral and systemic immune responses in recurrent glioblastoma. Nat. Med. 2019;25:477–486. doi: 10.1038/s41591-018-0337-7. [DOI] [PMC free article] [PubMed] [Google Scholar]
- 56.Bai R, Lv Z, Xu D, Cui J. Predictive biomarkers for cancer immunotherapy with immune checkpoint inhibitors. Biomark. Res. 2020;8:34. doi: 10.1186/s40364-020-00209-0. [DOI] [PMC free article] [PubMed] [Google Scholar]
- 57.Turajlic S, et al. Insertion-and-deletion-derived tumour-specific neoantigens and the immunogenic phenotype: a pan-cancer analysis. Lancet Oncol. 2017;18:1009–1021. doi: 10.1016/S1470-2045(17)30516-8. [DOI] [PubMed] [Google Scholar]
- 58.Terry RL, et al. Immune profiling of pediatric solid tumors. J. Clin. Invest. 2020;130:3391–3402. doi: 10.1172/JCI137181. [DOI] [PMC free article] [PubMed] [Google Scholar]
- 59.Platten M, et al. A vaccine targeting mutant IDH1 in newly diagnosed glioma. Nature. 2021;592:463–468. doi: 10.1038/s41586-021-03363-z. [DOI] [PMC free article] [PubMed] [Google Scholar]
- 60.Antonios JP, et al. Detection of immune responses after immunotherapy in glioblastoma using PET and MRI. Proc. Natl Acad. Sci. USA. 2017;114:10220–10225. doi: 10.1073/pnas.1706689114. [DOI] [PMC free article] [PubMed] [Google Scholar]
- 61.Kim KH, et al. The first-week proliferative response of peripheral blood PD-1(+)CD8(+) T cells predicts the response to anti-PD-1 therapy in solid tumors. Clin. Cancer Res. 2019;25:2144–2154. doi: 10.1158/1078-0432.CCR-18-1449. [DOI] [PubMed] [Google Scholar]
- 62.Li H, Durbin R. Fast and accurate short read alignment with Burrows-Wheeler transform. Bioinformatics. 2009;25:1754–1760. doi: 10.1093/bioinformatics/btp324. [DOI] [PMC free article] [PubMed] [Google Scholar]
- 63.DePristo MA, et al. A framework for variation discovery and genotyping using next-generation DNA sequencing data. Nat. Genet. 2011;43:491–498. doi: 10.1038/ng.806. [DOI] [PMC free article] [PubMed] [Google Scholar]
- 64.McKenna A, et al. The Genome Analysis Toolkit: a MapReduce framework for analyzing next-generation DNA sequencing data. Genome Res. 2010;20:1297–1303. doi: 10.1101/gr.107524.110. [DOI] [PMC free article] [PubMed] [Google Scholar]
- 65.Van der Auwera GA, et al. From FastQ data to high confidence variant calls: the Genome Analysis Toolkit best practices pipeline. Curr. Protoc. Bioinformatics. 2013;43:11.10.1–11.10.33. doi: 10.1002/0471250953.bi1110s43. [DOI] [PMC free article] [PubMed] [Google Scholar]
- 66.Yang SYC, et al. Landscape of genomic alterations in high-grade serous ovarian cancer from exceptional long- and short-term survivors. Genome Med. 2018;10:81. doi: 10.1186/s13073-018-0590-x. [DOI] [PMC free article] [PubMed] [Google Scholar]
- 67.Cibulskis K, et al. Sensitive detection of somatic point mutations in impure and heterogeneous cancer samples. Nat. Biotechnol. 2013;31:213–219. doi: 10.1038/nbt.2514. [DOI] [PMC free article] [PubMed] [Google Scholar]
- 68.Saunders CT, et al. Strelka: accurate somatic small-variant calling from sequenced tumor-normal sample pairs. Bioinformatics. 2012;28:1811–1817. doi: 10.1093/bioinformatics/bts271. [DOI] [PubMed] [Google Scholar]
- 69.Koboldt DC, et al. VarScan 2: somatic mutation and copy number alteration discovery in cancer by exome sequencing. Genome Res. 2012;22:568–576. doi: 10.1101/gr.129684.111. [DOI] [PMC free article] [PubMed] [Google Scholar]
- 70.Danecek P, et al. The variant call format and VCFtools. Bioinformatics. 2011;27:2156–2158. doi: 10.1093/bioinformatics/btr330. [DOI] [PMC free article] [PubMed] [Google Scholar]
- 71.McLaren W, et al. The Ensembl Variant Effect Predictor. Genome Biol. 2016;17:122. doi: 10.1186/s13059-016-0974-4. [DOI] [PMC free article] [PubMed] [Google Scholar]
- 72.Rosenthal R, McGranahan N, Herrero J, Taylor BS, Swanton C. DeconstructSigs: delineating mutational processes in single tumors distinguishes DNA repair deficiencies and patterns of carcinoma evolution. Genome Biol. 2016;17:31. doi: 10.1186/s13059-016-0893-4. [DOI] [PMC free article] [PubMed] [Google Scholar]
- 73.Warren RL, et al. Derivation of HLA types from shotgun sequence datasets. Genome Med. 2012;4:95. doi: 10.1186/gm396. [DOI] [PMC free article] [PubMed] [Google Scholar]
- 74.Nariai N, et al. HLA-VBSeq: accurate HLA typing at full resolution from whole-genome sequencing data. BMC Genomics. 2015;16(Suppl. 2):S7. doi: 10.1186/1471-2164-16-S2-S7. [DOI] [PMC free article] [PubMed] [Google Scholar]
- 75.Iafolla MAJ, et al. Predicting toxicity and response to pembrolizumab through germline genomic HLA class 1 analysis. JNCI Cancer Spectr. 2021;5:pkaa115. doi: 10.1093/jncics/pkaa115. [DOI] [PMC free article] [PubMed] [Google Scholar]
- 76.Bjerregaard AM, Nielsen M, Hadrup SR, Szallasi Z, Eklund AC. MuPeXI: prediction of neo-epitopes from tumor sequencing data. Cancer Immunol. Immunother. 2017;66:1123–1130. doi: 10.1007/s00262-017-2001-3. [DOI] [PMC free article] [PubMed] [Google Scholar]
- 77.Jurtz V, et al. NetMHCpan-4.0: improved peptide-MHC class I interaction predictions integrating eluted ligand and peptide binding affinity data. J. Immunol. 2017;199:3360–3368. doi: 10.4049/jimmunol.1700893. [DOI] [PMC free article] [PubMed] [Google Scholar]
- 78.Hundal J, et al. pVAC-Seq: a genome-guided in silico approach to identifying tumor neoantigens. Genome Med. 2016;8:11. doi: 10.1186/s13073-016-0264-5. [DOI] [PMC free article] [PubMed] [Google Scholar]
- 79.Shen R, Seshan VE. FACETS: allele-specific copy number and clonal heterogeneity analysis tool for high-throughput DNA sequencing. Nucleic Acids Res. 2016;44:e131. doi: 10.1093/nar/gkw520. [DOI] [PMC free article] [PubMed] [Google Scholar]
- 80.Carter SL, et al. Absolute quantification of somatic DNA alterations in human cancer. Nat. Biotechnol. 2012;30:413–421. doi: 10.1038/nbt.2203. [DOI] [PMC free article] [PubMed] [Google Scholar]
- 81.Ionescu DN, Downes MR, Christofides A, Tsao MS. Harmonization of PD-L1 testing in oncology: a Canadian pathology perspective. Curr. Oncol. 2018;25:e209–e216. doi: 10.3747/co.25.4031. [DOI] [PMC free article] [PubMed] [Google Scholar]
- 82.Dobin A, et al. STAR: ultrafast universal RNA-seq aligner. Bioinformatics. 2013;29:15–21. doi: 10.1093/bioinformatics/bts635. [DOI] [PMC free article] [PubMed] [Google Scholar]
- 83.Li B, Dewey CN. RSEM: accurate transcript quantification from RNA-Seq data with or without a reference genome. BMC Bioinformatics. 2011;12:323. doi: 10.1186/1471-2105-12-323. [DOI] [PMC free article] [PubMed] [Google Scholar]
- 84.Newman AM, et al. Robust enumeration of cell subsets from tissue expression profiles. Nat. Methods. 2015;12:453–457. doi: 10.1038/nmeth.3337. [DOI] [PMC free article] [PubMed] [Google Scholar]
- 85.Newman AM, et al. Determining cell type abundance and expression from bulk tissues with digital cytometry. Nat. Biotechnol. 2019;37:773–782. doi: 10.1038/s41587-019-0114-2. [DOI] [PMC free article] [PubMed] [Google Scholar]
- 86.Chen B, Khodadoust MS, Liu CL, Newman AM, Alizadeh AA. Profiling tumor infiltrating immune cells with CIBERSORT. Methods Mol. Biol. 2018;1711:243–259. doi: 10.1007/978-1-4939-7493-1_12. [DOI] [PMC free article] [PubMed] [Google Scholar]
- 87.Sturm G, et al. Comprehensive evaluation of transcriptome-based cell-type quantification methods for immuno-oncology. Bioinformatics. 2019;35:i436–i445. doi: 10.1093/bioinformatics/btz363. [DOI] [PMC free article] [PubMed] [Google Scholar]
- 88.Rohr-Udilova N, et al. Deviations of the immune cell landscape between healthy liver and hepatocellular carcinoma. Sci. Rep. 2018;8:6220. doi: 10.1038/s41598-018-24437-5. [DOI] [PMC free article] [PubMed] [Google Scholar]
- 89.Gu Z, Eils R, Schlesner M. Complex heatmaps reveal patterns and correlations in multidimensional genomic data. Bioinformatics. 2016;32:2847–2849. doi: 10.1093/bioinformatics/btw313. [DOI] [PubMed] [Google Scholar]
- 90.Racle J, Gfeller D. EPIC: a tool to estimate the proportions of different cell types from bulk gene expression data. Methods Mol. Biol. 2020;2120:233–248. doi: 10.1007/978-1-0716-0327-7_17. [DOI] [PubMed] [Google Scholar]
- 91.Mulder DT, et al. CapTCR-seq: hybrid capture for T-cell receptor repertoire profiling. Blood Adv. 2018;2:3506–3514. doi: 10.1182/bloodadvances.2017014639. [DOI] [PMC free article] [PubMed] [Google Scholar]
- 92.Bolotin DA, et al. MiXCR: software for comprehensive adaptive immunity profiling. Nat. Methods. 2015;12:380–381. doi: 10.1038/nmeth.3364. [DOI] [PubMed] [Google Scholar]
- 93.Kaplinsky J, Arnaout R. Robust estimates of overall immune-repertoire diversity from high-throughput measurements on samples. Nat. Commun. 2016;7:11881. doi: 10.1038/ncomms11881. [DOI] [PMC free article] [PubMed] [Google Scholar]
Associated Data
This section collects any data citations, data availability statements, or supplementary materials included in this article.
Supplementary Materials
Supplementary Figs. 1–11 and Supplementary Table 1
Data Availability Statement
All data relevant to this work are available at the European Genome Phenome Archive (EGA: https://ega-archive.org/studies/EGAS00001005579; Study EGAS00001005579; Dataset EGAD00001008036) and can be accessed through communication with the corresponding author. Clinical data are listed in Supplementary Table 1. Reference genomes were downloaded from the publicly available resources at https://genome.ucsc.edu. Source data are provided with this paper.


