

Abstract
Background:
Alcohol, insulin resistance (IR), and hepatitis C (HCV) are all significant contributors to adverse outcomes of chronic liver disease. Latinos are disproportionately affected by these risk factors. We investigated the relationship between alcohol use and insulin action in a large prospective Latino cohort with and without HCV.
Methods:
One hundred fifty-three non-diabetic Latinos (60 HCV+, 93 HCV-) underwent clinical evaluation and metabolic testing; 56 had repeat testing over a median follow-up of 1.5 years. Peripheral IR and hepatic IR were measured via steady‐state plasma glucose (SSPG) and endogenous glucose production during a 2-step 240-minute insulin suppression test. Insulin secretion (IS) was measured using the graded glucose infusion test. Alcohol use was categorized as none, moderate (≤1 drink/day for women and ≤2 drinks/day for men), and heavy (not moderate). Multivariable models including HCV status assessed associations of alcohol use with baseline SSPG, hepatic IR and IS, and with changes in these parameters over time.
Results:
Overall, the median age was 44 years, 63.4% were male, 66.7% overweight/obese, and 31.9% had heavy lifetime alcohol use (60.4% moderate lifetime alcohol use). SSPG and IS were similar by levels of alcohol use at baseline and alcohol use was not statistically significantly associated with change in these measures over time. However, lifetime daily heavy alcohol use (vs not heavy, coef 2.4 μU-mg/kg-min-ml, p=0.04) and HCV status (coef 4.4 μU-mg/kg-min-ml, p=0.0003) were independently associated with higher baseline hepatic IR, and current heavy alcohol use was associated with greater change in hepatic IR in follow-up (coef 5.8 μU-mg/kg-min-ml, p=0.03).
Conclusions:
In this Latino cohort, lifetime and current heavy alcohol use influenced hepatic IR and its change over time. Strategies to improve rates of alcohol cessation along with lifestyle modification and anti-HCV therapy to reduce metabolic risk are critical to prevent adverse liver and metabolic outcomes in Latinos.
Keywords: hepatic insulin resistance, alcohol use disorder, insulin secretion, SSPG, Hispanic
Overview of Manuscript:
Alcohol use adversely influences hepatic insulin resistance and its rate of change over time in Latino individuals with and without chronic hepatitis C infection. Alcohol cessation represents a highly critical intervention in addition to other risk reduction measures for prevention of adverse metabolic and liver-related outcomes and should be prioritized in Latinos.
Introduction
Alcohol use is a major cause of morbidity and mortality worldwide, accounting for 3 million deaths in 2016.(WHO, 2018) In the US, the Latino population is particularly at-risk for adverse consequences of alcohol and alcohol-related morbidity,(Witbrodt et al., 2014) as well as a rising mortality rate due to alcohol-associated liver disease (ALD), which increased in the Latino population from 8.6 per 100,000 in 2007 to 10.1 in 2016.(Kim et al., 2018) Latinos are also disproportionately affected by other risk factors for liver disease, including obesity, impaired insulin action,(Lorenzo et al., 2012) and hepatitis C (HCV) infection.(Rodriguez-Torres, 2008) These liver disease risk factors are all intertwined as diabetes is an extra-hepatic manifestation of HCV(Jacobson et al., 2010, Serfaty, 2017) and alcohol use impacts insulin resistance (IR)(Schrieks et al., 2015, Facchini et al., 1994, Kerr et al., 2019, Knott et al., 2015, Lai et al., 2019, Park et al., 2019, Tatsumi et al., 2018) and insulin secretion (IS).(Flanagan et al., 2002, Tatsumi et al., 2018)
The effect of alcohol use on insulin action in Latinos with coexisting risk factors is not fully understood but is likely influenced by the amount of alcohol consumed, given alcohol’s dose-dependent effects on insulin action. Some studies, but not all,(Schrieks et al., 2015) have found that low to moderate alcohol use decreases IR and diabetes risk,(Knott et al., 2015, Lai et al., 2019, Kerr et al., 2019, Schrieks et al., 2015, Facchini et al., 1994) whereas heavy alcohol use increases risk.(Lai et al., 2019, Park et al., 2019, Tatsumi et al., 2018) With regards to IS, for which there are less data, studies of non-diabetic individuals have shown unexpectedly an increase in IS with higher alcohol use,(Tatsumi et al., 2018) while in healthy individuals IS decreases with moderate alcohol use.(Flanagan et al., 2002)
In the setting of chronic liver disease, alcohol and IR have a synergistic effect on liver disease progression.(Carr and Correnti, 2015) Both alcohol and IR also independently influence fibrosis progression in HCV infection.(Hui et al., 2003, Singal and Anand, 2007) Prior studies have been limited by use of surrogate measures of IR, such as the homeostasis model assessment (HOMA), as this has been shown to have high misclassification rates and significant within-person variability in the setting of HCV infection.(Mukhtar et al., 2013, Lam et al., 2010) Considering the complexity of interaction among these factors, it is critical to disentangle the contribution of alcohol to impaired insulin action among Latinos using direct measures to effectively implement preventative and treatment strategies for at-risk individuals.
In this study, we aimed to comprehensively investigate the relationship between graded alcohol use and directly measured insulin action in a large prospective cohort of nondiabetic Latinos with or without HCV infection using detailed clinical, metabolic and genetic measurements. We also evaluated the impact of alcohol use as well as persistent and new clinical and metabolic risk factors on change in insulin action over time.
Methods
Study Participants
Non-diabetic Latino individuals of 18 years or older with and without chronic HCV were recruited at San Francisco General Hospital between June 1, 2002 through January 1, 2016 to evaluate the relationship between HCV infection and insulin action. Latino ethnicity was defined by self-report of Latino ethnicity of all four biologic grandparents and both parents.(Burman et al., 2015, Humes KR, 2010) Chronic HCV was confirmed by detectable HCV viral load. Exclusion criteria included a history of diabetes (based on fasting glucose ≥ 126 mg/dL, 120-minute glucose ≥ 200 mg/dL on oral glucose tolerance test (OGTT), prior diagnosis of diabetes, or use of antidiabetic medications), human immunodeficiency virus (HIV), chronic hepatitis B virus (HBV), or other medical conditions limiting their ability to participate in the study. HCV-infected individuals were excluded if they had other causes of liver disease, cirrhosis (clinical or histologic), decompensated liver disease, and prior or current HCV therapy. This study was approved by the UCSF Committee on Human Research, and all participants provided written informed consent.
Study Procedures
At an initial screening visit, patients underwent demographic and clinical history, anthropometric measurements (height, weight, body mass index (BMI), and waist circumference), and laboratory evaluation. Detailed alcohol history and physical activity level including duration and intensity of physical activity(Ainsworth et al., 2000) were obtained. All patients were offered follow-up testing at ≥6 months and those willing to participate underwent clinical and metabolic evaluation at baseline and repeat evaluation at follow-up (median of 1.5 years). Genetic assessment including ancestry estimation and detection of polymorphisms in the alcohol-metabolizing enzyme cytochrome P450 2E1 were performed at baseline.(Uribe et al., 2018)
Alcohol Use Measurements
A thorough drinking history was obtained for each patient via face-to-face interview at each study visit. Recent drinking behavior over the prior 12 months was assessed(Kerr et al., 2019), as well as lifetime drinking behavior. Current alcohol use in the prior twelve months was captured and alcohol use was categorized as none, moderate and heavy, and duration of alcohol use and abstinence were also captured.(NIAAA, 2020) Moderate alcohol use for women was defined as up to one drink per day and no more than 7 drinks per week, and for men, up to two drinks per day and no more than 14 drinks per week. (NIAAA, 2020) Heavy alcohol use was defined as more than moderate, which also includes binge drinking defined as 4+ drinks for women and 5+ drinks for men on the same occasion. Lifetime alcohol use history was obtained using the validated Lifetime Drinking History instrument(Jacob et al., 2006, Friesema et al., 2004) designed to capture an individual’s alcohol use and patterns from the onset of regular drinking. Lifetime daily alcohol use was similarly categorized as none, moderate use as up to one drink (13.6 grams of alcohol) per day for women and up to two drinks (27.2 grams of alcohol) per day for men, and heavy use as any use exceeding moderate. (NIAAA, 2020)
Metabolic Testing
Metabolic testing was performed during a 3-day inpatient visit to the UCSF Clinical and Translational Science Institute’s Clinical Research Center as previously described.(Uribe et al., 2018) During this stay, an OGTT (day 1), insulin suppression test (steady-state plasma glucose [SSPG], day 2), and IS and insulin clearance rate (graded glucose infusion test [GGIT], day 3) were performed.
On hospital day 1 after a 12-hour fast, a 75g OGTT was performed to evaluate for undiagnosed diabetes (120-minute glucose level ≥ 200mg/dL.(ADA, 2015)) Based on OGTT results, participants who met diagnostic criteria for diabetes or impaired glucose tolerance (IGT), defined as 2h plasma glucose ≥ 140 mg/dl, were excluded. On hospital day 2, the 2-step insulin suppression test (IST; low dose and high dose) was performed as previously described.(Mukhtar et al., 2013, Uribe et al., 2018) Plasma glucose and insulin levels were measured from 210 to 240 minutes during the high-dose period, and these levels were averaged to represent the SSPG and steady-state plasma insulin (SSPI) concentrations. SSPG measures the peripheral (muscle) resistance of tissues to insulin-mediated glucose uptake, therefore higher SSPG levels represent higher degrees of peripheral IR. IST is considered a direct physiologic measurement of IR.(Yip et al., 1998) The SSPG is highly correlated (r=0.87) with the M value obtained during the euglycemic, hyperinsulinemic clamp technique.(Knowles et al., 2013)
Hepatic glucose production measured by infusion of deuterated glucose ([6,6-d2]-glucose) following priming to reach isotopic steady state during the insulin suppression test.(Uribe et al., 2018) Briefly, exogenous insulin levels were achieved to simulate basal (fasting) conditions (SSPI at ~10–15 μU/mL) to partially inhibit endogenous insulin production. At these levels, endogenous glucose production (EGP) is not considerably suppressed from fasting rates. Therefore, we were able to assess the ability of basal insulin to maintain glucose homeostasis by measuring the rate of (hepatic) EGP. Mass spectrometric analysis was used to quantify hepatic glucose production by the isotope dilution technique. Steady-state plasma glucose enrichment was measured during a constant intravenous infusion of deuterated glucose.(Christiansen et al., 2000, Schwarz et al., 1995) EGP (mg/kg-min) = (deuterated glucose infusion rate/deuterated glucose enrichment) – deuterated glucose infusion rate. Hepatic IR was then calculated as EGP (mg/kg-min) × insulin (μU/mL).
On hospital day 3, a GGIT to measure insulin secretory function was performed as previously described.(Kim et al., 2014, Uribe et al., 2018) Patients received graded intravenous infusions of glucose at increasing rates (1, 2, 3, 4, 6, 8 mg/kg/min). Each rate was administered for 40 minutes. Fasting glucose, insulin, and C-peptide concentrations were measured prior to the infusion, and then again at 30 and 40 minutes into each infusion period. The last two values were averaged at the end of each infusion period to calculate the mean for that infusion. The area under the curve (AUC) for glucose, insulin, and C-peptide were then calculated. Insulin secretion rates (ISRs) were derived by deconvolution of peripheral plasma C-peptide concentrations, using a two-compartment model of C-peptide kinetics and standard parameters for C-peptide clearance. This was estimated for each participant based on their body surface area and age. The mean ISRs before and during the six glucose infusion periods were plotted against the corresponding mean glucose for each participant. This constructed a dose-response relationship, and the best-fit line was then drawn through the data to allow comparison of ISRs at the same glucose level. The ISR at molar increments of plasma glucose from 5 to 9 mmol/l was therefore obtained by interpolation, and the total integrated area under the curve (ISR-AUC) was calculated using the trapezoidal rule.
Estimation of Ancestry for Latino Individuals
The Latino population is an admixed group assumed to be comprised of three ancestral populations: African, European, and Native American. To identify and control for the heterogeneity among Latino people from different origins, we estimated the proportion of global ancestry for each individual using the genotype data of 37 West Africans, 42 European Americans, and 30 Native Americans.(Yaeger et al., 2008) One hundred and four autosomal ancestry informative markers (AIMs) across the genome were used for the inference of individual ancestry proportions for our Latino participants (%African, %Native American, and %European heritage).(Tsai et al., 2005) These AIMs were selected because their allele frequencies vary between those of African, European, and Native American populations. Samples were genotyped using Sequenom iPlex platform. The population structure for Latino individuals was inferred by a model-based clustering method,(Pritchard JK, 2000) which assumes the loci are at Hardy-Weinberg equilibrium and linkage equilibrium within each ancestral population group. This method introduces population structure to the participants, so the assumed equilibrium is achieved. The method was implemented in the software package STRUCTURE (version 2.2) (http://pritchardlab.stanford.edu/structure.html), which was used to analyze the population structure of Latino individuals in our study.
CYP2EI Genotyping
All patients underwent genetic analysis (as previously described(Burman et al., 2016)) to detect polymorphisms in the cytochrome P4502E1 (CYP2E1) Rsal c2 allele, which is an alcohol metabolizing enzyme that has a relatively high frequency in Latino populations, and lower frequency in Whites and African Americans.(Beulens et al., 2007, Neafsey et al., 2009, Wan et al., 1998) Polymorphisms in the CYP2E1 and the homozygous mutant allele (c2/c2) have been associated with higher rates of transcriptional activity, protein levels, enzyme activity, and ALD.(Wan et al., 1998)
Statistical Analysis
Baseline characteristics of study participants were reported using mean ± standard deviation, median with minimum to maximum value, or proportions. The characteristics were compared by categories of lifetime alcohol use and by HCV status. P-values were obtained by Kruskal-Wallis or Mann-Whitney tests and chi-squared tests as appropriate. Our primary analysis used linear regression to estimate the associations of HCV and current graded alcohol intake with the primary outcomes of SSPG, hepatic IR, ISR-AUC, and change in these measurements over time. Additional a priori selected predictor variables were age, sex, BMI (continuous variable [kg/m2], and categorical as normal weight [<25 kg/m2], overweight [≥ 25 kg/m2] and obese [≥ 30 kg/m2]), waist circumference, ancestry proportions, CYP2E1 mutations (homozygous c2/c2, heterozygous c1/c2), US birth, alcohol use (duration, lifetime daily alcohol use, years of abstinence), current tobacco use, physical activity intensity, physical activity duration, family history of diabetes, time (in years) between initial and follow-up visits, laboratory values at baseline and follow up (ALT, AST, HDL, triglycerides, and ferritin). Interaction terms to assess the relationship between each outcome and HCV status in conjunction with graded alcohol use (categorized as moderate and heavy) were created (e.g., HCV*moderate alcohol, noHCV*moderate alcohol, HCV*heavy alcohol, etc). Additionally, potential explanatory variables that may have influenced the observed relationships between predictors and changes in outcome measures during follow-up were evaluated and included changes in: BMI, waist circumference, ALT, AST, alcohol use (from none to moderate, none to heavy, moderate to heavy, etc), and physical activity intensity and duration. The predictor variables, interaction terms, and explanatory variables were included in multivariable analyses.
To address any missing values, in particular those for alcohol use and activity level assessments, a multiple imputation technique(Sterne et al., 2009) followed by linear regression modeling was used when evaluating factors associated with changes in metabolic parameters. We used the MCMC method for imputation in SAS proc MI to create 20 imputation data sets. Imputed values were based on all predictor and outcome variables. After imputation, any observations from outcome variables that were originally missing were reset back to missing prior to analysis, to ensure only directly measured metabolic tests in analysis of the outcome were included in the final data set. We then used proc MIAnalyze to synthesize the results of fitting multivariable linear regressions to the 20 imputed data sets. We selected multivariable models by forward stepwise selection with an entry criterion of P < 0.05 for candidate predictors. For multivariable analysis of SSPG, hepatic IR, and ISR-AUC at baseline, HCV, lifetime daily heavy alcohol, and duration of alcohol use were forced into the model. For the multivariable models of change in metabolic parameters, HCV and time to follow-up were forced into all models and change in SSPG was also included in the ISR-AUC model. For all models evaluating change in SSPG, hepatic IR, and ISR-AUC over time, we further evaluated how the estimated effects changed due to addition of any one of several possible explanatory variables. All analyses were performed using the Statistical Analysis System version 9.4 (SAS Institute, Cary, NC).
Results
Cohort Characteristics
One hundred fifty-three non-diabetic Latino participants with (n = 60) or without (n = 93) HCV were enrolled in the study. Table 1 summarizes overall patient characteristics and categorized by HCV infection status. Overall, the median age was 44, most participants were male (63.4%), overweight or obese (BMI ≥ 25 kg/m2, 66.7%), and reported a family history of diabetes (64.1%). Two thirds (66.4%) of the patients were born outside of the US (66.4%) and with high proportion of Native American and European ancestry. Among the 60 HCV-infected participants, the mean duration of HCV infection was estimated at 23.7 ± 11.8 years; 73.3% had HCV genotype 1 (15.0% genotype 2, 11.7% genotype 3), with a mean log10HCV viral load of 5.8 ± 0.6 IU/ml. Forty-two HCV-infected participants had a liver biopsy; 40 (95.2%) had mild to moderate inflammation (grade ≤ 2), 16 (38.9%) had steatosis (34.1% with grade 1 at ≤ 33%), and 3 (7.1%) had no fibrosis and 31 (73.8%) had mild to moderate fibrosis (stage ≤ 2).
Table 1.
Baseline patient, laboratory, and metabolic characteristics by hepatitis C status
| Characteristic | Overall | Without HCV (N=93)* | With HCV (N=60)* | p value |
|---|---|---|---|---|
| Age (years), median (min-max) | 44 (20–63) | 40 (20–60) | 48.5 (26–63) | <0.0001 |
| Male sex, N (%) | 97 (63.4) | 57 (61.3) | 40 (66.7) | 0.5 |
| BMI (kg/m2), mean ± SD | 27.3 ± 4.4 | 27.4 ± 4.3 | 27.3 ± 4.6 | 0.72 |
| Overweight/obese (BMI ≥ 25kg/m2), N (%) | 102 (66.7) | 64 (68.8) | 38 (63.3) | 0.48 |
| Waist circumference (cm), mean ± SD | 93.6 1 ± 1.4 | 92.9 ± 10.9 | 94.6 ± 12.1 | 0.59 |
| % Native American, mean ± SD | 40.3 ± 20.1 | 44.9 ± 19.7 | 32.8 ± 18.5 | 0.0003 |
| US born, N (%) | ||||
| 51 (33.6) | 19 (20.4) | 32 (54.2) | <0.0001 | |
| Current smoker, N (%) | ||||
| 41 (27.0) | 14 (15.1) | 27 (45.8) | <0.0001 | |
| Tobacco use (pack-years), median (min-max) | ||||
| 0.5 (0–74) | 0 (0–60) | 7 (0–74) | <0.0001 | |
| Intravenous drug use, N (%) | 42 (27.5) | 0 (0) | 42 (70) | <0.0001 |
| Lifetime daily alcohol (g), median (min-max) | ||||
| 7.0 (0–422) | 4.3 (0–422) | 24.4 (0–237) | ||
| Insufficient (< 150 mins/week) | 22 (17.6) | 13 (15.7) | 9 (21.4) | |
| Vigorous | 19 (15.2) | 10 (12.0) | 9 (21.4) | |
| Family history of diabetes, N (%) | 98 (64.1) | 66 (71) | 32 (53.3) | 0.026 |
| Mean ALT (U/L) ± SD | 52.2 ± 58 | 27.7 ± 12.1 | 90.1 ± 77.6 | <0.0001 |
| Mean AST (U/L) ± SD | 41.0 ± 33.6 | 25.7 ± 5.9 | 64.8 ± 43.7 | <0.0001 |
| Mean total cholesterol (mg/dL) ± SD | 178.9 ± 35.8 | 190 ± 33.2 | 162 ± 33.1 | <0.0001 |
| Mean LDL (mg/dL) ± SD | ||||
| 104.4 ± 30.7 | 115 ± 28.1 | 88.3 ± 27.5 | <0.0001 | |
| Mean HDL (mg/dL) ± SD | 52.2 ± 14.2 | 51.3 ± 13 | 53.6 ± 15.8 | 0.22 |
| Mean triglycerides (mg/dL) ± SD | 113.9 ± 70.2 | 125 ± 77.3 | 96.5 ± 53.6 | 0.015 |
| Median ISR-AUC (pmol/min) (min-max) | ||||
| 1530.4 (657.9–6566.8) | 1550 (658–6570) | 1430 (699–3750) | 0.6 | |
| Median SSPG (mg/dL) (min-max) | 130 (39–316.3) | 112 (43–271) | 145 (39–316) | 0.074 |
| Median hepatic IR (μU-mg/kg-min-ml) (min-max) | ||||
| 15.5 (6.3–43.4) | 14 (6.25–33.4) | 19.4 (8.4–43.4 | <0.0001 |
Unless otherwise noted in the table
Min = minimum, max = maximum, BMI = body mass index, SD = standard deviation, ALT = alanine aminotransferase, AST = aspartate aminotransferase, LDL = low-density lipoprotein, HDL = high-density lipoprotein, SSPG = steady-state plasma glucose, ISR = insulin secretion rate, AUC = area under the curve, IR = insulin resistance, HCV = hepatitis C virus
In comparing the HCV and non-HCV groups (Table 1), statistically significant differences in demographic, clinical, and metabolic testing parameters are as follows. The HCV participants were older (median 48.5 years vs 40 years, p < 0.0001), a higher proportion were US born [54.2% (n=59) vs 20.4% (n=93), p < 0.0001], and had a higher median lifetime alcohol use [24.4 grams alcohol/day (n=45) vs 4.3 grams alcohol/day (n=93), p = 0.0001] compared to the non-HCV group. With respect to laboratory parameters, as expected, HCV participants had higher baseline ALT (median ALT 65.5 vs 25 U/L, p < 0.0001) and AST levels (median AST 51.5 vs 25 U/L, p < 0.0001) as well as lower low-density lipoprotein (LDL) (median 87 vs 107 mg/dL, p < 0.0001). With respect to metabolic testing parameters at baseline, when compared to non-HCV participants, those with HCV had lower ISR-AUC [median 1430 (n=57) vs 1550 pmol/min (n=92), p = 0.6] and increased peripheral IR [SSPG, median 145 (n=60) vs 112 mg/dL (n=93), p = 0.07], but these did not reach statistical significance. However, hepatic IR was statistically significantly increased in HCV compared to non-HCV group [median 19.4 (n=46) vs 14.0 μU-mg/kg-min-ml (n=93), p < 0.0001, respectively].
All participants were genotyped for polymorphisms in the alcohol metabolizing gene CYP2E1 and there were no statistically significant differences between HCV and non-HCV groups (p = 0.32). Three (2.0%) participants were found to have the homozygous mutant allele (c2/c2), 35 (23.3%) participants were heterozygous (c1/c2), and 112 (74.7%) had no CYP2E1 mutation.
Characteristics by Lifetime Alcohol Use
Among the 138 participants who completed the Lifetime Drinking Questionnaire, cohort characteristics were categorized by lifetime daily alcohol use as none (n=10), moderate (n=84) and heavy (n=44) and summarized in Table 2. Those with moderate alcohol use were less likely to be male, smoke cigarettes, or have a history of injection drug use. In addition, although there were no significant differences in the BMI across the three groups, those with moderate alcohol use had lower waist circumference compared to those with no alcohol or heavy alcohol use (mean 91.7 ± 12.5 cm vs 98.1 ± 8.3 cm vs 96.8 ± 9.8 cm, p = 0.01, respectively). Both ALT and AST were highest in the heavy alcohol use group (mean ALT 58.2 ± 50.0 U/L, mean AST 48.8 ± 41.0 U/L), and lowest in the moderate alcohol use group (mean ALT 45.9 ± 65.5 U/L, mean AST 35.2 ± 31.7 U/L).
Table 2.
Baseline patient, laboratory, and metabolic characteristics by level of lifetime daily alcohol use category
| Characteristic | No Lifetime Alcohol Use (N=10)* | Moderate Lifetime Alcohol Use (N=84)* | Heavy Lifetime Alcohol Use (N=44)* | p value |
|---|---|---|---|---|
| Age (years), median (min-max) | 42 (26–63) | 44 (20–60) | 44.5 (23–59) | 0.81 |
| Male sex, N (%) | 7 (70.0) | 47 (56.0) | 34 (77.3) | 0.05 |
| BMI (kg/m2), mean ± SD | 27.8 ± 4.0 | 27 ± 4.7 | 28.2 ± 4.4 | 0.24 |
| Overweight/obese (BMI ≥ 25kg/m2), N (%) | 7 (70.0) | 54 (64.3) | 32 (72.7) | 0.62 |
| Waist circumference (cm), mean ± SD | 98.1 ± 8.3 | 91.7 ± 12.5 | 96.8 ± 9.8 | 0.01 |
| % Native American, mean ± SD | 26.2 ± 20.4 | 44.4 ± 19.9 | 39.2 ± 17.9 | 0.09 |
| US born, N (%) | ||||
| 4 (40.0) | 20 (23.8) | 21 (48.8) | ||
| Current smoker, N (%) | ||||
| 4 (44.4) | 14 (16.7) | 19 (43.2) | ||
| Tobacco use (pack-years), mean ± SD | ||||
| 5.4 ± 12.4 | 3.4 ± 8.9 | 9.6 ± 13.5 | ||
| Intravenous drug use, N (%) | 3 (30.0) | 12 (14.3) | 16 (36.4) | 0.02 |
| Lifetime daily alcohol (g), median (min-max) | 0.0 (0.0–0.0) | 3.4 (0.04–19.9) | 39.5 (18.5–422) | <0.0001 |
| Insufficient (< 150 mins/week) | 0 (0.0) | 12 (15.4) | 10 (25.6) | |
| Vigorous | 1 (12.5) | 11 (14.1) | 7 (17.9) | |
| Family history of diabetes, N (%) | 5 (50.0) | 58 (69.0) | 30 (68.2) | 0.47 |
| Mean ALT (U/L) ± SD | 51.1 ± 49.2 | 45.9 ± 65.5 | 58.2 ± 50 | 0.02 |
| Mean AST (U/L) ± SD | 41.9 ± 24.7 | 35.2 ± 31.7 | 48.8 ± 41.0 | 0.0007 |
| Mean total cholesterol (mg/dL) ± SD | 188 ± 44.6 | 185 ± 34.7 | 168 ± 32.9 | 0.09 |
| Mean LDL (mg/dL) ± SD | ||||
| 113 ± 36.6 | 108 ± 30.7 | 96.3 ± 27.3 | ||
| Mean HDL (mg/dL) ± SD | 51.7 ± 12.7 | 53.6 ± 13.4 | 50.4 ± 16.6 | 0.28 |
| Mean triglycerides (mg/dL) ± SD | 116 ± 76.8 | 116 ± 75.6 | 112 ± 64.5 | 0.99 |
| Median ISR-AUC (pmol/min) (min-max) | 1330 (699–6570) | 1400 (686–4680) | 1730 (658–3760) | 0.12 |
| Median SSPG (mg/dL) (min-max) | 141 (48–239) | 114 (43–316) | 133 (39–310) | 0.97 |
| Median hepatic IR (μU-mg/kg-min-ml) (min-max) | 13.7 (9.6–27.0) | 13.8 (6.3–33.4) | 18.1 (8.3–43.4) | 0.006 |
| Positive HCV status, N (%) | 4 (40.0) | 17 (20.2) | 24 (54.5) | 0.0004 |
Unless otherwise noted in the table
Min = minimum, max = maximum, BMI = body mass index, SD = standard deviation, ALT = alanine aminotransferase, AST = aspartate aminotransferase, LDL = low-density lipoprotein, HDL = high-density lipoprotein, SSPG = steady-state plasma glucose, ISR = insulin secretion rate, AUC = area under the curve, IR = insulin resistance, HCV = hepatitis C virus
Insulin Resistance and Insulin Secretion by Lifetime Alcohol Use
At baseline, metabolic tests by lifetime alcohol use (Table 2) showed that ISR-AUC was increased in those with heavy alcohol use compared to those with moderate or no alcohol use (median 1730 vs 1400 vs 1330 pmol/min, respectively) and SSPG was lowest in the moderate alcohol group compared to those with none or heavy alcohol use (median 114 vs 141 or 133 mg/dL, respectively), but these did not reach statistical significance.
With respect to hepatic IR at baseline, those with heavy alcohol use had higher hepatic IR compared to those with moderate or none (median 18.1 vs 13.8 vs 13.7 μU-mg/kg-min-ml, respectively, p = 0.006). Moreover, those with heavy alcohol use (vs none/moderate) had higher hepatic IR irrespective of HCV status. The median hepatic IR for individuals with moderate or no alcohol use and without HCV was 13.2 μU-mg/kg-min-ml (range 6.3–33.4) versus with HCV at 18.6 μU-mg/kg-min-ml (range 11.3–27.6) (p=0.001). The hepatic IR in those with heavy alcohol use and without HCV was 16 μU-mg/kg-min-ml (range 8.3–33.2) versus 20 μU-mg/kg-min-ml (range 8.4–43.4) in those with HCV (p=0.07) (Figure 1).
Figure 1: Baseline hepatic insulin resistance by lifetime daily alcohol use and hepatitis C (HCV) status.
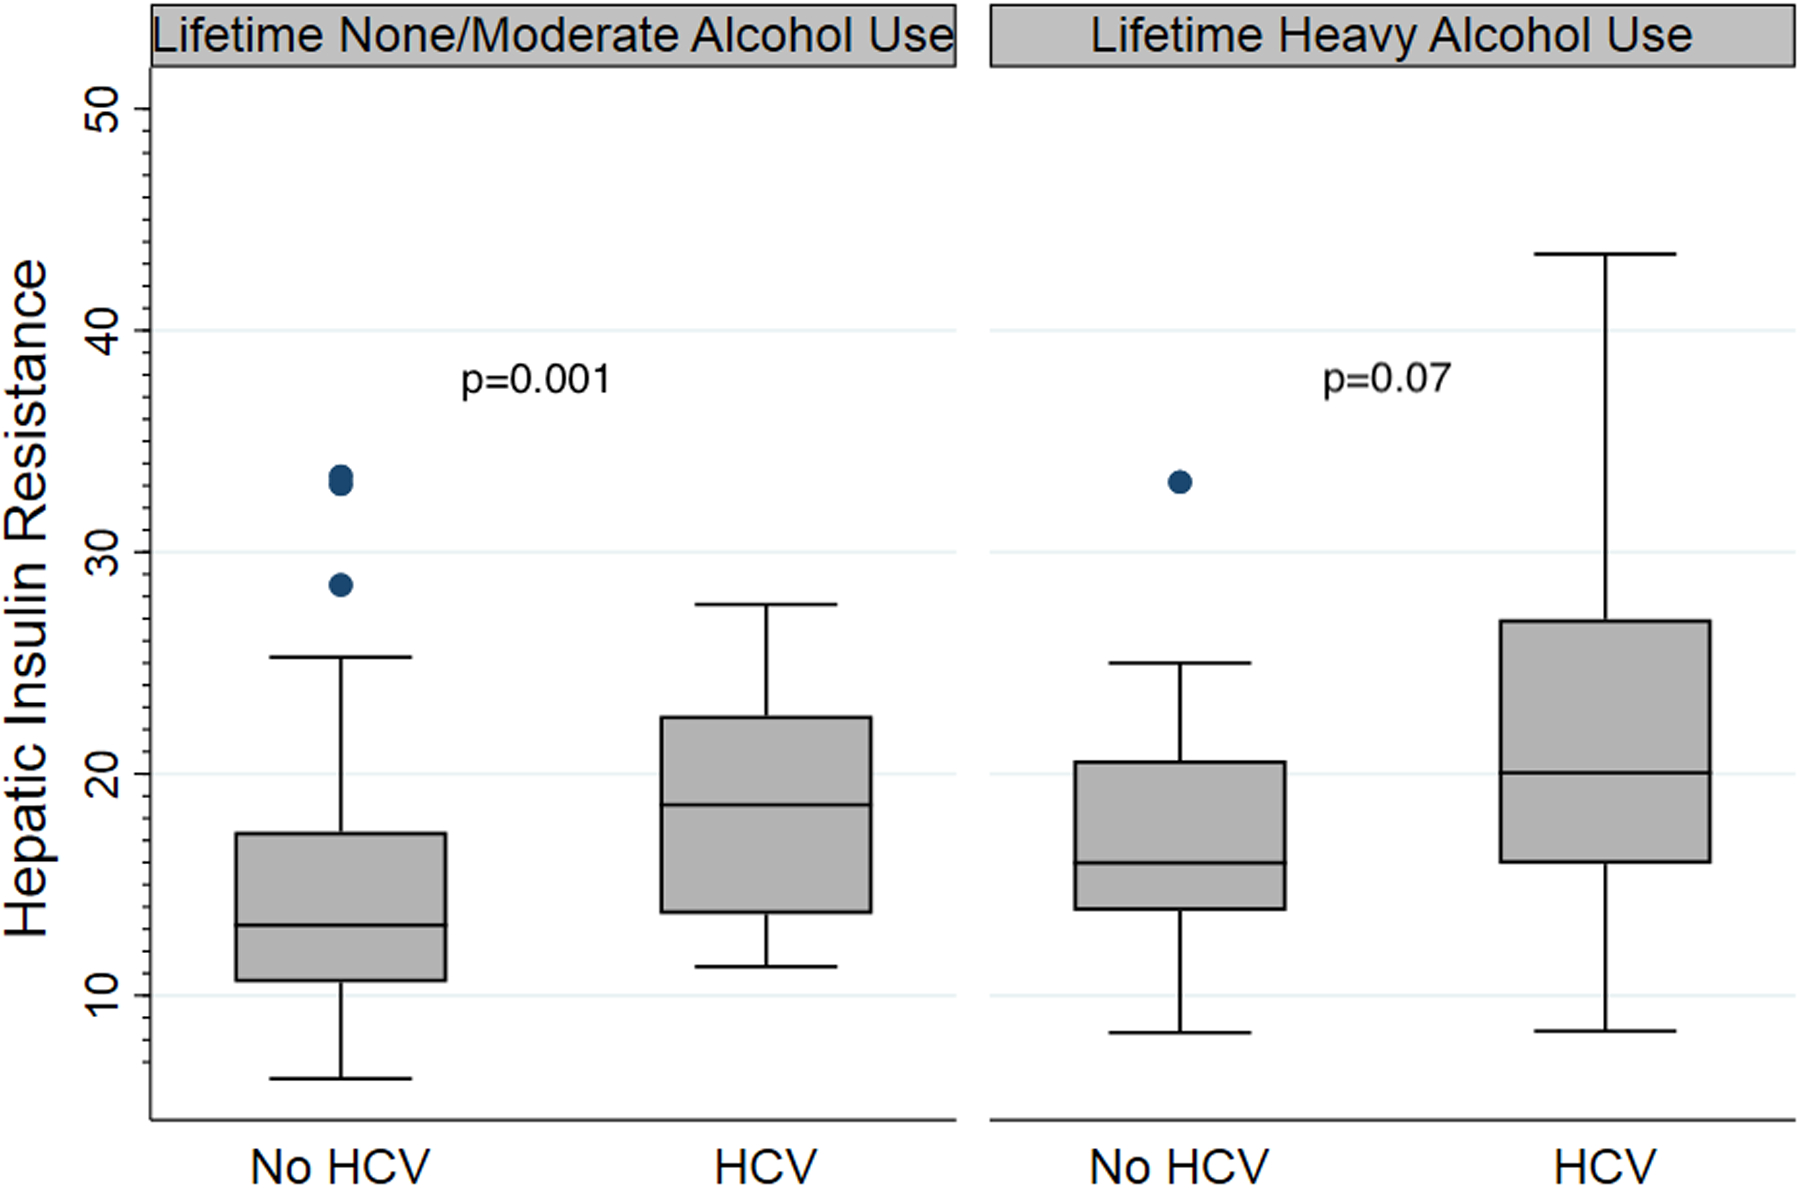
Boxplots showing median baseline hepatic IR [(line), interquartile range (box outline), minimum to maximum values (whiskers) and outliers (dots)] in participants by lifetime daily alcohol use category (none/moderate vs heavy) and HCV status (no HCV vs HCV). Hepatic IR was higher with lifetime daily heavy alcohol use irrespective of HCV status. Median hepatic IR for individuals with none or moderate alcohol use without HCV was 13.2 μU-mg/kg-min-ml (range 6.3–33.4) vs with HCV 18.6 μU-mg/kg-min-ml (range 11.3–27.6) (p=0.001). For participants with lifetime daily heavy alcohol use, hepatic IR for those without HCV was 16 μU-mg/kg-min-ml (range 8.3–33.2) versus 20 μU-mg/kg-min-ml (range 8.4–43.4) in those with HCV (p=0.07).
IR = insulin resistance; HCV = hepatitis C virus
Impact of Alcohol Use on Insulin Secretion and Resistance
Table 3 summarizes results of univariate analysis of the outcome measures of IS and IR. Although duration of alcohol use was associated with lower ISR-AUC (coef −13.7 pmol/min per years of use, p = 0.01), lifetime daily alcohol amount (coef 5.1 pmol/min per 10g/day, p = 0.58) or lifetime daily heavy alcohol use (vs none/moderate, coef 140.7 pmol/min, p = 0.30) were not statistically significantly associated with ISR-AUC. BMI, waist circumference, and triglyceride levels were associated with higher ISR-AUC, while age and HDL levels were associated with lower ISR-AUC. With respect to peripheral IR, female sex, BMI, ALT, and triglyceride and HDL levels were associated with SSPG, but lifetime daily alcohol use (coef 1.1 mg/dL, 95% CI −0.8 to 2.9) and lifetime daily heavy alcohol use (vs none/moderate, coef −1.7 mg/dL, 95% CI −29.1 to 25.6) did not appear to influence SSPG. On the other hand, lifetime daily heavy alcohol use (vs none/moderate, coef 3.9 mg/dL, 95% CI 1.5 to 6.2) was associated with hepatic IR. Other factors that also influenced hepatic IR included HCV status, and ALT, AST, and HDL levels.
Table 3.
Univariable analysis of factors associated with baseline metabolic parameters
| ISR-AUC | SSPG | Hepatic IR | |||||||
|---|---|---|---|---|---|---|---|---|---|
| Characteristic | Coef | 95% CI | p value* | Coef | 95% CI | p value | Coef | 95% CI | p value |
| Age (per decade) | −222.7 | −344.5 to −101 | 0.0003 | 11.3 | −0.7 to 23.3 | 0.06 | 0.7 | −0.4 to 1.8 | 0.19 |
| Female sex | −151.9 | −418.5 to 114.6 | 0.26 | 29.2 | 4.1 to 54.3 | 0.02 | −2.1 | −4.3 to 0.3 | 0.08 |
| Ancestry proportions | |||||||||
| African, per 10% | 16.7 | −136.2 to 169.6 | 0.83 | 8.8 | −6.0 to 23.6 | 0.24 | −0.1 | −1.4 to 1.1 | 0.83 |
| European, per 10 % | Ref | Ref | Ref | Ref | Ref | Ref | Ref | Ref | Ref |
| Native American, per 10% | 26.7 | −36.4 to 89.7 | 0.41 | 3.9 | −2.2 to 9.9 | 0.21 | −0.4 | −1.0 to 0.2 | 0.15 |
| US born | 67.6 | −201.4 to 336.6 | 0.62 | −11.3 | −37.3 to 14.8 | 0.40 | 2.0 | −0.4 to 4.4 | 0.10 |
| BMI (per 5kg/m2) | 395.1 | 258.4 to 531.9 | <0.0001 | 42.4 | 30.2 to 54.6 | <0.0001 | 0.7 | −0.5 to 2.0 | 0.23 |
| Waist circumference (by 5 cm) | 132.8 | 80.6 to 185.0 | <0.0001 | 15.1 | 10.3 to 20.0 | <0.0001 | 0.4 | −0.1 to 0.9 | 0.08 |
| Duration of alcohol (years) | −13.7 | −24.5 to −2.9 | 0.01 | 0.2 | −0.8 to 1.3 | 0.68 | 0.02 | −.08 to 0.1 | 0.66 |
| Alcohol abstinence (years) | 0.2 | −10.8 to 11.2 | 0.97 | 0.7 | −0.5 to 2.0 | 0.25 | 0.02 | −0.1 to 0.1 | 0.74 |
| Current alcohol use (vs none) | |||||||||
| Moderate | 11.5 | −277.2 to 300.1 | 0.94 | −17.4 | −45.1 to 10.4 | 0.22 | −0.8 | −3.3 to 1.8 | 0.56 |
| Heavy | 239.3 | −119.4 to 597.9 | 0.19 | −5.7 | −40.5 to 29.1 | 0.75 | 1.6 | −1.6 to 4.7 | 0.33 |
| Lifetime daily alcohol (per 10 g/day) | 5.1 | −13.2 to 23.5 | 0.58 | 1.1 | −0.8 to 2.9 | 0.26 | 0.2 | 0.01 to 0.3 | 0.03 |
| Lifetime daily heavy alcohol (vs none or moderate) | 140.7 | −126.8 to 408.2 | 0.30 | −1.7 | −29.1 to 25.6 | 0.90 | 3.9 | 1.5 to 6.2 | 0.001 |
| Current smoker | −99.8 | −389.1 to 189.6 | 0.50 | −15.7 | −43.4 to 12.0 | 0.27 | 2.6 | 0.1 to 5.1 | 0.04 |
| Physical activity duration (vs none) | |||||||||
| Recommended | −226.5 | −810.2 to 357.2 | 0.45 | −55.3 | −111.3 to 0.7 | 0.05 | −0.3 | −5.4 to 4.7 | 0.90 |
| Insufficient | 28.3 | −604.9 to 661.4 | 0.93 | −32.1 | −92.6 to 28.4 | 0.30 | −1.5 | −7.0 to 4.0 | 0.60 |
| Physical activity intensity (vs mild) | |||||||||
| Moderate | −112.7 | −400.5 to 175.2 | 0.44 | −10.5 | −39.9 to 18.8 | 0.48 | 0.2 | −2.2 to 2.5 | 0.89 |
| Vigorous | −126.4 | −498.7 to 245.8 | 0.51 | −13.9 | −53.6 to 25.9 | 0.49 | 1.6 | −1.5 to 4.8 | 0.31 |
| Family history of diabetes | 121.8 | −144.0 to 387.7 | 0.37 | 19.1 | −6.4 to 44.5 | 0.14 | 0.5 | −1.9 to 2.8 | 0.70 |
| ALT (log2 U/L) | 4.5 | −120.8 to 129.8 | 0.94 | 21.5 | 9.9 to 33.0 | 0.0003 | 2.2 | 1.2 to 3.3 | <0.0001 |
| AST (log2 U/L) | −55.3 | −221.8 to 111.2 | 0.52 | 20.9 | 5.2 to 36.6 | 0.009 | 2.9 | 1.5 to 4.2 | <0.0001 |
| Ferritin (per 10 ng/mL) | −0.9 | −11.6 to 9.7 | 0.86 | 1.6 | 0.6 to 2.6 | 0.002 | 0.1 | 0.05 to 0.2 | 0.003 |
| HDL (per 10 mg/dL) | −167.4 | −257.8 to −76.9 | 0.0003 | −19.7 | −27.8 to −11.6 | <0.0001 | −0.8 | −1.5 to −0.01 | 0.047 |
| Triglycerides (per 10 mg/dL) | 32.2 | 14.7 to 49.6 | 0.0003 | 2.9 | 1.2 to 4.6 | 0.0008 | 0.04 | −0.1 to 0.2 | 0.59 |
| Positive HCV status | −104.4 | −367.6 to 158.7 | 0.44 | 24.8 | −0.1 to 49.7 | 0.05 | 5.1 | 2.9 to 7.3 | <0.0001 |
ISR = insulin secretion rate; AUC = area under the curve; SSPG = steady-state plasma glucose; IR = insulin resistance; coef = coefficient; CI = confidence interval; BMI = body mass index; ref = reference; ALT = alanine aminotransferase; AST = aspartate aminotransferase; PA = physical activity; HDL = high-density lipoprotein; HCV = hepatitis C virus
On multivariable analysis (Table 4) that included HCV status, lifetime daily heavy alcohol use and alcohol duration, ISR-AUC was independently associated with age, BMI, and triglycerides, but did not have a statistically significant association with HCV status (coef 120.4 pmol/min, 95% CI −132.3 to 373.1) or lifetime daily heavy alcohol use (coef 86.8 pmol/min, 95% CI −153.8 to 327.4). Adjustment for waist circumference (a surrogate for central obesity) did not significantly modify the estimated effects of HCV or lifetime heavy alcohol use. Moreover, the observed estimated effects of age, BMI or triglyceride levels on ISR-AUC remained similar when accounting for degrees of IR. With inclusion of interaction terms to assess how much the effect of current alcohol use differed by HCV status (all p > 0.05), in individuals without HCV, ISR-AUC appeared to be higher with heavy alcohol use (coef 286.3 pmol/min vs none, 95% CI −126.4 to 699.0) than those with moderate alcohol use (coef 47.3 pmol/min, 95% CI −283.3 to 378.0). However, in those with HCV, heavy or moderate alcohol use appeared to have a similar effect on ISR-AUC (coef 66.7 pmol/min, 95% CI −379.0 to 512.5 vs coef 79.8 pmol/min, 95% CI −322.9 to 482.5, respectively).
Table 4.
Multivariable analysis of factors associated with peripheral and hepatic insulin resistance and insulin secretion at baseline
| ISR-AUC (N=149) |
SSPG (N=153) |
Hepatic IR (N=139) |
|||||||
|---|---|---|---|---|---|---|---|---|---|
| Predictor variable | Coef | 95% CI | p value* | Coef | 95% CI | p value | Coef | 95% CI | p value |
| HCV status | 120.4 | −132.3 to 373.1 | 0.35 | 4.5 | −24.9 to 33.9 | 0.77 | 4.4 | 2.0 to 6.7 | 0.0003 |
| Lifetime daily heavy alcohol (vs none or moderate) | 86.8 | −153.8 to 327.4 | 0.48 | −12.2 | −34.4 to 10.1 | 0.28 | 2.4 | 0.1 to 4.6 | 0.04 |
| Duration of alcohol (years) | −3.9 | −15.2 to 7.4 | 0.50 | −0.05 | −0.9 to 0.8 | 0.91 | −0.04 | −0.1 to 0.1 | 0.34 |
| Age (per decade) | −236.5 | −370.2 to −102.9 | 0.0005 | -- | -- | -- | -- | -- | -- |
| Female sex | -- | -- | -- | 51.7 | 30.4 to 73.1 | <0.0001 | -- | -- | -- |
| BMI (per 5 kg/m2) | 374.2 | 246.2 to 502.2 | <0.0001 | 30.6 | 19.6 to 41.6 | <0.0001 | -- | -- | -- |
| ALT (log2 U/L) | -- | -- | -- | 24.4 | 10.8 to 38.1 | 0.0005 | -- | -- | -- |
| HDL (per 10 mg/dL) | -- | -- | -- | −16.5 | −23.9 to −9.1 | <0.0001 | −0.8 | −1.5 to −0.1 | 0.03 |
| Triglycerides (per 10 mg/dL) | 25.9 | 10.1 to 41.8 | 0.001 | 1.6 | 0.2 to 3.1 | 0.03 | -- | -- | -- |
| Ferritin (per 10 ng/mL) | -- | -- | -- | -- | -- | -- | 0.1 | 0.01 to 0.2 | 0.03 |
p-value < 0.05 is statistically significant (bolded)
ISR = insulin secretion rate; AUC = area under the curve; SSPG = steady-state plasma glucose; IR = insulin resistance; coef = coefficient; CI = confidence interval; HCV = hepatitis C virus; BMI = body mass index; ALT = alanine aminotransferase; HDL = high-density lipoprotein
With respect to IR, multivariable analysis showed that female sex, BMI, and ALT and triglyceride levels were associated with higher and HDL was associated with lower SSPG (Table 4). However, alcohol use category or duration of alcohol use was not associated with SSPG levels, although, SSPG appeared to be lower in those with moderate alcohol use who did not have HCV (coef −13.9 mg/dL vs none, 95% CI −43.0 to 15.1, p = 0.35) than those with HCV (coef −3.2 mg/dL, 95% CI −38.0 to 31.6, p = 0.86) (data not shown). With respect to hepatic IR, lifetime daily heavy alcohol use (vs none/moderate; coef 2.4 μU-mg/kg-min-ml, 95% CI 0.1–4.6) and also HCV infection (coef 4.4 μU-mg/kg-min-ml, 95% CI 2.0 to 6.7) were independently associated with increased hepatic IR (Table 4). A sensitivity analysis using waist circumference as a measure of central obesity in the models produced similar estimated effects for lifetime daily heavy alcohol use (vs none/moderate; coef 2.4 μU-mg/kg-min-ml, 95%CI 0.03 to 4.8, p=0.048) and HCV infection (coef 4.1 μU-mg/kg-min-ml, 95%CI 1.6 to 6.6, p=0.0001). Additional analysis evaluating the impact of moderate alcohol use among those with or without HCV showed that the effect of moderate use (vs none) on hepatic IR appeared to be higher in those with HCV than those without HCV (coef 1.6 μU-mg/kg-min-ml, 95% CI −2.4 to 5.7, p = 0.43 and coef 0.07 μU-mg/kg-min-ml, 95% CI −3.0. to 3.1, p = 0.96, respectively), but these were not statistically significant.
Effect of Alcohol Use on Changes in Insulin Secretion and Insulin Resistance Over Time
Fifty-six participants underwent follow-up [median 1.5 (0.5 to 3.5) years] of whom 23 had HCV, 19 had lifetime daily heavy alcohol use, and 6 had current heavy alcohol use. There were no statistically significant differences (all p>0.05) in median age (46 years vs 44 years), sex (36% vs 37% female), HCV infection (38% vs 35%), median BMI (27.5 vs 26.5 mg/kg2), and alcohol use (moderate alcohol, 60% vs 63%, and heavy alcohol 36% vs 30%) among those who had versus those who did not agree to follow-up testing, respectively.
Overall, the mean change in ISR-AUC was −344.1 ± 861.0 pmol/min, SSPG was 9.4 ± 54.5 mg/dl, and hepatic IR was 2.3 ± 7.9 μU-mg/kg-min-ml on follow-up. On univariable analysis, lifetime daily alcohol use was not statistically significantly associated with change in ISR-AUC (coef 14.5 pmol/min per 10 grams of alcohol/day, 95% CI −42.0 to 71.0) or change in SSPG (coef −1.4 mg/dL per 10 grams of alcohol/day, 95% CI −5.6 to 2.9 mg/dL). Current alcohol use category (vs no alcohol use) was also not statistically significantly associated with change in ISR-AUC (coef −290.9 pmol/min, 95% CI −743.7 to 161.9 for moderate use and coef −82 pmol/min, 95% CI −681.9 to 517.9 for heavy use) or change in SSPG (coef 15.3 mg/dL, 95% CI −18.3 to 48.9 for moderate use and coef 30.3 mg/dL, 95% CI 27.3 to 31.9 for heavy use). However, while lifetime daily alcohol use was not statistically significantly associated with change in hepatic IR (coef 0.2 μU-mg/kg-min-ml, 95% CI −0.5 to 0.8), current heavy alcohol use was associated with 5.6 points greater change in hepatic IR (95% CI 0.0 to 11.2) compared to those with no alcohol use.
On multivariable analysis which included HCV status and duration of follow-up, BMI was associated with lesser change (average of −625.3 points per 5 kg/m2, 95% CI −916.2 to −334.3) and HCV was associated with greater change (average of 411.8 points higher vs no HCV, 95% CI 38.0 to 785.6) in ISR-AUC when accounting for change in insulin resistance (SSPG) on follow-up (Table 5). While no baseline factor had p<0.05 for predicting change in SSPG, age was associated with an average of 3.1 points lesser change per decade (95% CI −5.3 to −1.0) and current heavy alcohol use was associated with an average of 5.8 points greater change (95% CI 0.6 to 11.1) in hepatic IR compared to those with no current alcohol use (Table 5). In addition, the impact of current heavy alcohol use on change in hepatic IR remained similar when controlling for changes in alcohol use, BMI, AST, ALT or physical activity over time (< 15% change in coef in all cases).
Table 5.
Multivariable analysis of factors associated with change in peripheral and hepatic insulin resistance and insulin secretion over time (N=56)
| Change in ISR-AUC | Change in SSPG | Change in hepatic IR | |||||||
|---|---|---|---|---|---|---|---|---|---|
| Predictor variable | Coef | 95% CI | p value* | Coef | 95% CI | p value | Coef | 95% CI | p value |
| HCV status | 411.8 | 38.0 to 785.6 | 0.03 | −23.9 | −53.1 to 5.3 | 0.11 | −0.8 | −5.1 to 3.4 | 0.70 |
| Time to follow up | −267.8 | −776.8 to 241.2 | 0.30 | 3.8 | −31.1 to 38.6 | 0.83 | 4.5 | −4.8 to 13.9 | 0.34 |
| Change in SSPG | 2.6 | −0.3 to 5.5 | 0.08 | -- | -- | -- | -- | -- | -- |
| BMI (per 5kg/m2) | −625.3 | −916.2 to −334.3 | <0.0001 | -- | -- | -- | -- | -- | -- |
| Age (per decade) | -- | -- | -- | -- | -- | -- | −3.1 | −5.3 to −1.0 | 0.0042 |
| Current alcohol (vs none) | |||||||||
| Moderate | -- | -- | -- | -- | -- | -- | −0.9 | −5.3 to 3.5 | 0.68 |
| Heavy | -- | -- | -- | -- | -- | -- | 5.8 | 0.6 to 11.1 | 0.03 |
p-value < 0.05 is statistically significant (bolded)
ISR = insulin secretion rate; AUC = area under the curve; SSPG = steady-state plasma glucose; IR = insulin resistance; coef = coefficient; CI = confidence interval; HCV = hepatitis C virus; BMI = body mass index
Discussion
In this large cohort of nondiabetic Latinos with and without HCV, we found that both HCV and alcohol use influenced hepatic IR. Importantly, participants with lifetime daily heavy alcohol use had higher hepatic IR when compared to those with moderate or no alcohol use, irrespective of HCV status. Additionally, current heavy alcohol use was associated with greater change in hepatic IR over time compared to those with no alcohol use. On the other hand, while certain demographic and clinical factors were associated with SSPG and ISR-AUC in this cohort, alcohol use did not appear to influence these parameters at baseline or at follow up. As expected, HCV status was associated with higher hepatic IR at baseline, and interestingly, impacted insulin secretion but did not statistically significantly impact insulin resistance over time.
Latinos are one of the largest and fastest growing ethnic minority groups in the United States(Vespa J, 2020) and are disproportionately impacted by alcohol-related morbidity and mortality,(Witbrodt et al., 2014) impaired glucose regulation(Lorenzo et al., 2012) and HCV.(Rodriguez-Torres, 2008) With the introduction of highly effective anti-HCV therapies, there are now reported steady increases in the prevalence of and mortality due to metabolically-related liver diseases, namely nonalcoholic fatty liver disease (NAFLD) as well as ALD, especially among the Latino population.(Kim et al., 2018) While studies show that the metabolic parameters can improve with HCV eradication,(Russo et al., 2020) it does not fully eliminate the risk. Therefore, evaluation of the interplay between alcohol use and metabolic derangements in Latinos with or without coexisting HCV are timely and critical to addressing both metabolic and liver disease disparities in this population.
It is known that HCV results in a cascade of metabolic abnormalities. Its influence on insulin action involves direct and indirect effects on insulin signaling pathways, enhanced lipolysis resulting in increased free fatty acids, and effects on regulation of adipocyte genes that modify insulin sensitivity.(Knobler and Malnick, 2016) On the other hand, the underlying mechanism by which alcohol affects insulin action is not well understood.(Steiner et al., 2015) While the relationship in healthy individuals is often referred to as J-shaped, with reported improvement in insulin resistance with moderate alcohol use and worsening with heavy alcohol use, this finding is not always consistent across studies.(Schrieks et al., 2015) With respect to insulin secretion, limited data suggest that heavy alcohol use appears to increase insulin secretion.(Tatsumi et al., 2018) Importantly, the relationship between alcohol use and insulin action in patients with underlying liver disease, including HCV, has not been well investigated.
We have previously shown that Latino ethnicity was associated with peripheral insulin resistance,(Mukhtar et al., 2013) and in those with HCV who had normal weight, moderate alcohol use was associated with better peripheral insulin sensitivity independent of ethnicity.(Burman et al., 2016) Moreover among Latinos, hepatic IR was the only metabolic parameter of insulin action that statistically significantly increased following short-term discontinuation of moderate alcohol use, but HCV status was associated with lesser change in hepatic IR.(Uribe et al., 2018) Thus, the observed potential non-harmful effect of moderate alcohol use in this population required further investigation. In the current study with a comprehensive assessment of lifetime and current alcohol use and longitudinal follow up in a large Latino cohort, we show that moderate alcohol use, irrespective of HCV status, did not appear to influence insulin action. Although not statistically significant, there was a trend towards increased hepatic IR and SSPG with moderate alcohol use in HCV, compared to those without HCV, suggesting a potentially harmful effect in that setting.
Several observations are noted in this study. Known risk factors including age, BMI, dyslipidemia and liver inflammation contributed to SSPG or increased ISR-AUC independent of alcohol use and HCV status. Female gender was also associated with higher SSPG as previously reported by our group.(Gonzales et al., 2016, Mukhtar et al., 2013) We have previously shown that in general, women are at increased risk for elevated SSPG in HCV compared to men,(Gonzales et al., 2016, Mukhtar et al., 2013) and this finding is independent of menopausal status. While the reason for this observation is not clear, and some have attributed physical activity level as a potential contributor, but in this study, levels of physical activity were not statistically significantly associated with SSPG. With respect to alcohol use, we have confirmed that both lifetime and current heavy alcohol use are particularly harmful to hepatic IR. Heavy alcohol use has also been associated with increase in visceral fat in some populations(Molenaar et al., 2009, Kondoh et al., 2014), which in turn may influence hepatic IR. Although surrogate measures of increased adiposity using BMI and waist circumference was accounted for, measurements of regional body fat depots were not performed in our study. The contribution of visceral fat using computed tomography scan or magnetic resonance imaging to the relationship between alcohol use and insulin resistance requires investigation in future studies. Given the role of hepatic IR in the pathogenesis of diabetes(Petersen et al., 2017), heavy alcohol cessation is not only important in liver disease but also potentially for diabetes prevention in this population.
This study has several strengths and some limitations. The strengths include quantification of alcohol use with validated measures, use of directly measured parameters of insulin action, and comprehensive evaluation of risk factors including physical activity, in a longitudinal cohort. Our sample size is relatively large compared to other similar studies using directly measured IR and ISR-AUC, due to accuracy of these measures and impracticality of performing extensive 3 days of inpatient testing in a larger sample.(Kim et al., 2014, Mukhtar et al., 2013, Lim et al., 2019, Gastaldi et al., 2019) As glucose concentrations can affect glucose clearance independent of insulin levels, IST can be viewed as semiquantitative measure of insulin sensitivity. Nevertheless, IST is a highly reproducible measure that is less labor-intensive and less technically demanding than the euglycemic hyperinsulinemic clamp and estimates of insulin sensitivity determined by IST correlate highly (r~0.9) with reference standard clamp estimates as shown in various population.(Knowles et al., 2013, Muniyappa et al., 2008) It should be noted that the graded glucose infusion technique to calculate insulin secretion used a model containing parameters for C peptide kinetics that were estimated for each subject. However, this approach should give estimates of insulin secretion rates that differ by only 10–12% for each individual and 1–2% for group means from those obtained with individual parameters, even in a sample heterogeneous in terms of insulin resistance. (Van Cauter et al., 1992) In addition, insulin secretion was measured at the end of each 40 min of a stepped glucose infusion (non-steady state), and it is possible that longer infusion periods will lead to different estimates of the β-cell secretory response to incremental increases in plasma glucose. Unless dynamics of insulin secretion and clearance disproportionally changed between groups, it is less likely that this confounded the estimates obtained. While the lifetime alcohol use and physical activity questionnaires were missing in a limited number of participants, multiple imputation to handle missing data was used in order to reduce potential bias. A biomarker of alcohol use was not utilized in this study for confirmation of chronic or recent alcohol use and self-report may be subject to recall bias. However, as biomarkers do not provide categorization of graded alcohol use (a main predictor for this study), similar to prior studies(Burman et al., 2015, Burman et al., 2016, Kerr et al., 2019), self-reported alcohol use was utilized. Moreover, the evaluation of recent alcohol defined over the prior 12 months to allow for metabolic changes was supplemented by a validated instrument that measures amount and frequency while accounting for phases of alcohol use over the lifetime to assess moderate and heavy alcohol consumption history. In the non-HCV group, there were two participants who had ALT > 30 U/L and reported mild alcohol use. Although etiologies of other liver disease using serology and patient history were ruled out, due to lack of approval of elastography in the US when the participants were enrolled, we could not rule out underlying NAFLD. However, it is unlikely that these participants contributed substantially to the results of this study.
In summary, this study provides evidence that alcohol use adversely influences hepatic IR and its rate of change over time in Latino individuals independent of other metabolic abnormalities including HCV. Given the rising incidence of NAFLD and ALD in this population, alcohol cessation represents a highly critical intervention in addition to other risk reduction measures for prevention of adverse metabolic and liver-related outcomes and should be prioritized in Latinos.
Financial support:
This work was in part supported by NIH, K24AA022523 (M.K.), T32DK060414 (R.K.), and the UCSF Liver Center (P30 DK026743).
Conflict of Interest:
M. K. is a recipient of research grant (to her institution) from Gilead Sciences and Intercept Pharmaceuticals, and she has served as consultant for Gilead Sciences. R.K., J.K-F., P.B, B.G., D.H., C.E., M.H. do not have any disclosures relevant to this manuscript.
List of Abbreviations:
- IR
insulin resistance
- HCV
hepatitis C virus
- SSPG
steady-state plasma glucose
- IS
insulin secretion
- ALD
alcohol-associated liver disease
- HOMA
homeostasis model assessment
- OGTT
oral glucose tolerance test
- HIV
human immunodeficiency virus
- HBV
hepatitis B virus
- BMI
body mass index
- GGIT
graded glucose infusion test
- IGT
impaired glucose tolerance
- IST
insulin suppression test
- SSPI
steady state plasma insulin
- EGP
endogenous glucose production
- AUC
area under the curve
- ISR
insulin secretion rate
- AIMs
ancestry informative markers
- CYP2E1
cytochrome P4502E1
- LDL
low-density lipoprotein
- coef
coefficient
- CI
confidence interval
- NAFLD
non-alcoholic fatty liver disease
Footnotes
ClinicalTrials.gov Identifier: NCT01858012
References
- ADA (2015) Standards of medical care in diabetes - 2015: summary of revisions. Diabetes Care 38:S4. [DOI] [PubMed] [Google Scholar]
- Ainsworth BE, Haskell WL, Whitt MC, Irwin ML, Swartz AM, Strath SJ, O’Brien WL, Bassett DR Jr., Schmitz KH, Emplaincourt PO, Jacobs DR Jr., AS Leon (2000) Compendium of physical activities: an update of activity codes and MET intensities. Med Sci Sports Exerc 32:S498–504. [DOI] [PubMed] [Google Scholar]
- Beulens JW, Rimm EB, Hendriks HF, Hu FB, Manson JE, Hunter DJ, Mukamal KJ (2007) Alcohol consumption and type 2 diabetes: influence of genetic variation in alcohol dehydrogenase. Diabetes 56:2388–2394. [DOI] [PubMed] [Google Scholar]
- Burman BE, Bacchetti P, Ayala CE, Gelman N, Melgar J, Khalili M (2015) Liver inflammation is a risk factor for prediabetes in at-risk latinos with and without hepatitis C infection. Liver Int 35:101–107. [DOI] [PMC free article] [PubMed] [Google Scholar]
- Burman BE, Bacchetti P, Khalili M (2016) Moderate Alcohol Use and Insulin Action in Chronic Hepatitis C Infection. Dig Dis Sci 61:2417–2425. [DOI] [PMC free article] [PubMed] [Google Scholar]
- Carr RM, Correnti J (2015) Insulin resistance in clinical and experimental alcoholic liver disease. Ann N Y Acad Sci 1353:1–20. [DOI] [PMC free article] [PubMed] [Google Scholar]
- Christiansen MP, Linfoot PA, Neese RA, Hellerstein MK (2000) Effect of dietary energy restriction on glucose production and substrate utilization in type 2 diabetes. Diabetes 49:1691–1699. [DOI] [PubMed] [Google Scholar]
- Facchini F, Chen YD, Reaven GM (1994) Light-to-moderate alcohol intake is associated with enhanced insulin sensitivity. Diabetes Care 17:115–119. [DOI] [PubMed] [Google Scholar]
- Flanagan DE, Pratt E, Murphy J, Vaile JC, Petley GW, Godsland IF, Kerr D (2002) Alcohol consumption alters insulin secretion and cardiac autonomic activity. Eur J Clin Invest 32:187–192. [DOI] [PubMed] [Google Scholar]
- Friesema IH, Veenstra MY, Zwietering PJ, Knottnerus JA, Garretsen HF, Lemmens PH (2004) Measurement of lifetime alcohol intake: utility of a self-administered questionnaire. Am J Epidemiol 159:809–817. [DOI] [PubMed] [Google Scholar]
- Gastaldi G, Gomes D, Schneiter P, Montet X, Tappy L, Clement S, Negro F (2019) Treatment with direct-acting antivirals improves peripheral insulin sensitivity in non-diabetic, lean chronic hepatitis C patients. PLoS One 14:e0217751. [DOI] [PMC free article] [PubMed] [Google Scholar]
- Gonzales CA, Bacchetti P, Khalili M (2016) Impact of gender and menopausal status on metabolic parameters in chronic hepatitis C infection. J Viral Hepat 23:232–239. [DOI] [PMC free article] [PubMed] [Google Scholar]
- Hui JM, Sud A, Farrell GC, Bandara P, Byth K, Kench JG, McCaughan GW, George J (2003) Insulin resistance is associated with chronic hepatitis C virus infection and fibrosis progression [corrected]. Gastroenterology 125:1695–1704. [DOI] [PubMed] [Google Scholar]
- Humes KR JN, Ramirez RR of U.S. Census Bureau. Overview of Race and Hispanic Origin: 2010. Available at: https://www.census.gov/prod/cen2010/briefs/c2010br-02.pdf. Accessed April 2020.
- Jacob T, Seilhamer RA, Bargeil K, Howell DN (2006) Reliability of Lifetime Drinking History among alcohol dependent men. Psychol Addict Behav 20:333–337. [DOI] [PubMed] [Google Scholar]
- Jacobson IM, Cacoub P, Dal Maso L, Harrison SA, Younossi ZM (2010) Manifestations of chronic hepatitis C virus infection beyond the liver. Clin Gastroenterol Hepatol 8:1017–1029. [DOI] [PubMed] [Google Scholar]
- Kerr WC, Ye Y, Williams E, Lui CK, Greenfield TK, Lown EA (2019) Lifetime Alcohol Use Patterns and Risk of Diabetes Onset in the National Alcohol Survey. Alcohol Clin Exp Res 43:262–269. [DOI] [PMC free article] [PubMed] [Google Scholar]
- Kim D, Li AA, Gadiparthi C, Khan MA, Cholankeril G, Glenn JS, Ahmed A (2018) Changing Trends in Etiology-Based Annual Mortality From Chronic Liver Disease, From 2007 Through 2016. Gastroenterology 155:1154–1163 e1153. [DOI] [PMC free article] [PubMed] [Google Scholar]
- Kim SH, Liu A, Ariel D, Abbasi F, Lamendola C, Grove K, Tomasso V, Ochoa H, Reaven G (2014) Effect of salsalate on insulin action, secretion, and clearance in nondiabetic, insulin-resistant individuals: a randomized, placebo-controlled study. Diabetes Care 37:1944–1950. [DOI] [PMC free article] [PubMed] [Google Scholar]
- Knobler H, Malnick S (2016) Hepatitis C and insulin action: An intimate relationship. World J Hepatol 8:131–138. [DOI] [PMC free article] [PubMed] [Google Scholar]
- Knott C, Bell S, Britton A (2015) Alcohol Consumption and the Risk of Type 2 Diabetes: A Systematic Review and Dose-Response Meta-analysis of More Than 1.9 Million Individuals From 38 Observational Studies. Diabetes Care 38:1804–1812. [DOI] [PubMed] [Google Scholar]
- Knowles JW, Assimes TL, Tsao PS, Natali A, Mari A, Quertermous T, Reaven GM, Abbasi F (2013) Measurement of insulin-mediated glucose uptake: direct comparison of the modified insulin suppression test and the euglycemic, hyperinsulinemic clamp. Metabolism 62:548–553. [DOI] [PMC free article] [PubMed] [Google Scholar]
- Kondoh T, Takase H, Yamaguchi TF, Ochiai R, Katashima M, Katsuragi Y, Sakane N (2014) Association of dietary factors with abdominal subcutaneous and visceral adiposity in Japanese men. Obes Res Clin Pract 8:e16–25. [DOI] [PubMed] [Google Scholar]
- Lai YJ, Hu HY, Lee YL, Ko MC, Ku PW, Yen YF, Chu D (2019) Frequency of alcohol consumption and risk of type 2 diabetes mellitus: A nationwide cohort study. Clin Nutr 38:1368–1372. [DOI] [PubMed] [Google Scholar]
- Lam KD, Bacchetti P, Abbasi F, Ayala CE, Loeb SM, Shah V, Wen MJ, Reaven GM, Maher JJ, Khalili M (2010) Comparison of surrogate and direct measurement of insulin resistance in chronic hepatitis C virus infection: impact of obesity and ethnicity. Hepatology 52:38–46. [DOI] [PMC free article] [PubMed] [Google Scholar]
- Lim TR, Hazlehurst JM, Oprescu AI, Armstrong MJ, Abdullah SF, Davies NP, Flintham R, Balfe P, Mutimer DJ, McKeating JA, Tomlinson JW (2019) Hepatitis C virus infection is associated with hepatic and adipose tissue insulin resistance that improves after viral cure. Clin Endocrinol (Oxf) 90:440–448. [DOI] [PMC free article] [PubMed] [Google Scholar]
- Lorenzo C, Lee R, Haffner SM (2012) Impaired glucose tolerance and obesity as effect modifiers of ethnic disparities of the progression to diabetes: the San Antonio Heart Study. Diabetes Care 35:2548–2552. [DOI] [PMC free article] [PubMed] [Google Scholar]
- Molenaar EA, Massaro JM, Jacques PF, Pou KM, Ellison RC, Hoffmann U, Pencina K, Shadwick SD, Vasan RS, O’Donnell CJ, Fox CS (2009) Association of lifestyle factors with abdominal subcutaneous and visceral adiposity: the Framingham Heart Study. Diabetes Care 32:505–510. [DOI] [PMC free article] [PubMed] [Google Scholar]
- Mukhtar NA, Bacchetti P, Ayala CE, Melgar J, Christensen S, Maher JJ, Khalili M (2013) Insulin sensitivity and variability in hepatitis C virus infection using direct measurement. Dig Dis Sci 58:1141–1148. [DOI] [PMC free article] [PubMed] [Google Scholar]
- Muniyappa R, Lee S, Chen H, Quon MJ (2008) Current approaches for assessing insulin sensitivity and resistance in vivo: advantages, limitations, and appropriate usage. Am J Physiol Endocrinol Metab 294:E15–26. [DOI] [PubMed] [Google Scholar]
- Neafsey P, Ginsberg G, Hattis D, Johns DO, Guyton KZ, Sonawane B (2009) Genetic polymorphism in CYP2E1: Population distribution of CYP2E1 activity. J Toxicol Environ Health B Crit Rev 12:362–388. [DOI] [PubMed] [Google Scholar]
- NIAAA. National Institute on Alcohol Abuse and Alcoholism. Drinking levels defined. https://www.niaaa.nih.gov/alcohol-health/overview-alcohol-consumption/moderate-binge-drinking. Accessed: November 3, 2020.
- Park SY, Jeong SJ, Ustulin M, Chon S, Woo JT, Lim JE, Oh B, Rhee SY (2019) Incidence of Diabetes Mellitus in Male Moderate Alcohol Drinkers: A Community-Based Prospective Cohort Study. Arch Med Res 50:315–323. [DOI] [PubMed] [Google Scholar]
- Petersen MC, Vatner DF, Shulman GI (2017) Regulation of hepatic glucose metabolism in health and disease. Nat Rev Endocrinol 13:572–587. [DOI] [PMC free article] [PubMed] [Google Scholar]
- Pritchard JK SM, Donnelly P (2000) Inference of population structure using multilocus genotype data. Genetics 155:945–959. [DOI] [PMC free article] [PubMed] [Google Scholar]
- Rodriguez-Torres M (2008) Latinos and chronic hepatitis C: a singular population. Clin Gastroenterol Hepatol 6:484–490. [DOI] [PubMed] [Google Scholar]
- Russo FP, Zanetto A, Gambato M, Bortoluzzi I, Al Zoairy R, Franceschet E, De Marchi F, Marzi L, Lynch EN, Floreani A, Farinati F, Schaefer B, Burra P, Zoller H, Mega A (2020) Hepatitis C virus eradication with direct-acting antiviral improves insulin resistance. J Viral Hepat 27:188–194. [DOI] [PubMed] [Google Scholar]
- Schrieks IC, Heil AL, Hendriks HF, Mukamal KJ, Beulens JW (2015) The effect of alcohol consumption on insulin sensitivity and glycemic status: a systematic review and meta-analysis of intervention studies. Diabetes Care 38:723–732. [DOI] [PubMed] [Google Scholar]
- Schwarz JM, Neese RA, Turner S, Dare D, Hellerstein MK (1995) Short-term alterations in carbohydrate energy intake in humans. Striking effects on hepatic glucose production, de novo lipogenesis, lipolysis, and whole-body fuel selection. J Clin Invest 96:2735–2743. [DOI] [PMC free article] [PubMed] [Google Scholar]
- Serfaty L (2017) Metabolic Manifestations of Hepatitis C Virus: Diabetes Mellitus, Dyslipidemia. Clin Liver Dis 21:475–486. [DOI] [PubMed] [Google Scholar]
- Singal AK, Anand BS (2007) Mechanisms of synergy between alcohol and hepatitis C virus. J Clin Gastroenterol 41:761–772. [DOI] [PubMed] [Google Scholar]
- Steiner JL, Crowell KT, Lang CH (2015) Impact of Alcohol on Glycemic Control and Insulin Action. Biomolecules 5:2223–2246. [DOI] [PMC free article] [PubMed] [Google Scholar]
- Sterne JA, White IR, Carlin JB, Spratt M, Royston P, Kenward MG, Wood AM, Carpenter JR (2009) Multiple imputation for missing data in epidemiological and clinical research: potential and pitfalls. BMJ 338:b2393. [DOI] [PMC free article] [PubMed] [Google Scholar]
- Tatsumi Y, Morimoto A, Asayama K, Sonoda N, Miyamatsu N, Ohno Y, Miyamoto Y, Izawa S, Ohkubo T (2018) Association between alcohol consumption and incidence of impaired insulin secretion and insulin resistance in Japanese: The Saku study. Diabetes Res Clin Pract 135:11–17. [DOI] [PubMed] [Google Scholar]
- Tsai HJ, Choudhry S, Naqvi M, Rodriguez-Cintron W, Burchard EG, Ziv E (2005) Comparison of three methods to estimate genetic ancestry and control for stratification in genetic association studies among admixed populations. Hum Genet 118:424–433. [DOI] [PubMed] [Google Scholar]
- Uribe LA, Bacchetti P, Gelman N, Burchard E, Fitch M, Hellerstein M, Khalili M (2018) Impact of Moderate Alcohol Discontinuation on Insulin Action and Secretion in Latinos With and Without Hepatitis C. Alcohol Clin Exp Res 42:492–499. [DOI] [PMC free article] [PubMed] [Google Scholar]
- Van Cauter E, Mestrez F, Sturis J, Polonsky KS (1992) Estimation of insulin secretion rates from C-peptide levels. Comparison of individual and standard kinetic parameters for C-peptide clearance. Diabetes 41:368–377. [DOI] [PubMed] [Google Scholar]
- Vespa J ML, Armstrong DM. Demographic Turning Points for the United States: Population Projections for 2020 to 2060. online]. February 2020. census.gov.
- Wan YJ, Poland RE, Lin KM (1998) Genetic polymorphism of CYP2E1, ADH2, and ALDH2 in Mexican-Americans. Genet Test 2:79–83. [DOI] [PubMed] [Google Scholar]
- WHO. World Health Organization. (2018). Global status report on alcohol and health 2018. World Health Organization. https://apps.who.int/iris/handle/10665/274603. Accessed: November 3, 2020. Available. [Google Scholar]
- Witbrodt J, Mulia N, Zemore SE, Kerr WC (2014) Racial/ethnic disparities in alcohol-related problems: differences by gender and level of heavy drinking. Alcohol Clin Exp Res 38:1662–1670. [DOI] [PMC free article] [PubMed] [Google Scholar]
- Yaeger R, Avila-Bront A, Abdul K, Nolan PC, Grann VR, Birchette MG, Choudhry S, Burchard EG, Beckman KB, Gorroochurn P, Ziv E, Consedine NS, Joe AK (2008) Comparing genetic ancestry and self-described race in african americans born in the United States and in Africa. Cancer Epidemiol Biomarkers Prev 17:1329–1338. [DOI] [PMC free article] [PubMed] [Google Scholar]
- Yip J, Facchini FS, Reaven GM (1998) Resistance to insulin-mediated glucose disposal as a predictor of cardiovascular disease. J Clin Endocrinol Metab 83:2773–2776. [DOI] [PubMed] [Google Scholar]