

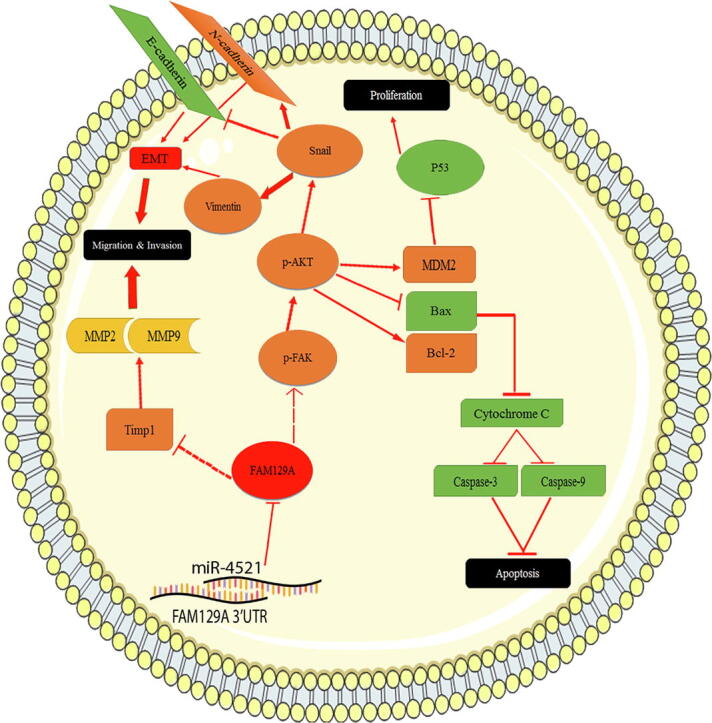
Graphical abstract
Schematic illustration of the miR-4521-FAM129A axis in HCC malignancy. FAM129A negatively correlates with miR-4521, leading to suppressed migration and invasion by the TIMP-1/MMP9/MMP2 and EMT pathways. miR-4521-FAM129A axial regulation reduces proliferation and induced apoptosis via the p-FAK/p-AKT/MDM2/P53 and p-FAK/p-AKT /BCL-2/BAX/Cytochrome-C/Caspase-3/Caspase-9 pathways, respectively.
Keywords: HCC, miR-4521, FAM129A, Proliferation, EMT, Apoptosis
Highlights
-
•
MiR-4521 deficiency reversely correlates with FAM129A upregulation in HCC.
-
•
MiR-4521 suppresses the in vitro migration and invasion capacities of HCC cells.
-
•
FAM129A is a direct and efficient target of miR-4521 in HCC cell invasiveness.
-
•
MiR-4521-FAM129A axis regulates HCC progression and metastasis via TIMP-1/MMP2/MMP9 and p-FAK/p-AKT pathway.
Abstract
Introduction
Globally, hepatocellular carcinoma (HCC) is the sixth most common malignancy and it has the fourth highest mortality. MicroRNAs play a significant part in biological processes in cell formation and advancement by targeting genes in many cancers including HCC.
Objective
In the present study we examine the involvement of miR-4521 and FAM129A correlations in HCC occurrence and progression.
Methods
Expression levels of miR-4521 and FAM129A in HCC tissues and cells were detected. Immunohistochemistry was carried out to detect expression of FAM129A, MMP9 and TIMP-1 in HCC tissues. Western blot assays were used to examine expression levels of different genes involve in signaling pathways. Transwell chamber, MTT and wound healing assays were performed to check cell migration, invasion and proliferation rates.
Results
Overexpression of FAM129A positively correlated with upregulation of MMP9 and negatively correlated with TIMP-1 in HCC patient samples, which encouraged progression and metastasis of HCC. An antagonistic relation between miR-4521 and FAM129A was detected in current study, down-regulation of miR-4521 and up-regulation of FAM129A was demonstrated in HCC tissues and cell lines as compare to normal tissue samples and the normal cell line LO2. Overexpressing miR-4521 and silencing FAM129A impaired HCC cell migratory and invasive properties and suppressed cell proliferation. Mutually, miR-4521-FAM129A axial regulation inhibited in vitro proliferation of cells by promoting apoptosis through the p-FAK/p-AKT/MDM2/P53 and p-FAK/p-AKT/BCL-2/BAX/Cytochrome-C/Caspase-3/Caspase-9 pathways, respectively, and suppressed the migration and invasion capabilities of HCCLM3 and HepG2 cells via the TIMP-1/MMP9/MMP2 and p-FAK/p-AKT pathway.
Conclusion
Our work found the axial regulation mechanism of miR-4521-FAM129A in HCC. Deficiency of miR-4521 and abundance of FAM129A synergistically enhanced cancer progression by increasing cell proliferation and malignant invasion and by inhibiting apoptosis. These discoveries suggest that miR-4521/FAM129A might play a vital role in hepatic cancer progression and could be a candidate for its therapy.
Introduction
Hepatocellular carcinoma (HCC) is the sixth most common type of malignant cancers worldwide, and ranks as the second highest cause of cancer related deaths [1], [2], [3]. High occurrence of HCC is reported in South Eastern Asia, Eastern Asia and Sub-Saharan Africa [4]. Tumor metastasis is a multistep process that can be divided into other distinct processes including extracellular matrix (ECM) modulation, invasion, translocation and migration that eventually form metastatic nodules [5], [6]. For improved prognosis of HCC and for treatment and early diagnosis, in depth study of the molecular mechanism of HCC metastasis is urgently required.
MicroRNAs are single stranded non-coding RNAs of about 18 ~ 24 nucleotides. Although microRNAs have no coding potential, they are molecules of interest as they are able to regulate many biological mechanisms, including cell pathogenesis [7]. MicroRNAs are reported to be involved in various biological cell functions including proliferation, apoptosis, metastasis and differentiation [8], [9]. They act as post transcriptional controllers by inhibiting the translation or by breaking mRNA into fragments [10]. miR-4521, as a member of the tRNA-derived small RNAs, plays a role in different cancers including renal cancer [11], breast cancer [12], esophageal adenocarcinoma [13], pancreatic ductal adenocarcinoma [14] and chronic lymphocytic leukemia (CLL) [15]. A recent study reported that miR-4521 targets FAM129A and acts as a tumor suppressor in ccRCC advancement through pathways including BAX, BCL-2, MMP2, MMP9, MDM2, P53 and TIMP-1 [11]. miR-4521 is also considered as a potential diagnostic biomarker in patients with focal cortical dysplasia (FCD) and refractory epilepsy [16]. It has also been reported that miR-4521 regulates hepatic fibrosis in humans infected by Schistosoma japoniscum and shows alteration in expression level in microcystin-LR induced hepatotoxins [17], [18]. But despite this regulation of hepatic fibrosis and its involvement in MC-LR induced hepatotoxicity in humans, no other study has been reported on the specific role of miR-4521 in liver cancer.
Family with sequence similarity 129 Member A (FAM129A), also known as Niban and C1orf24, is located on chromosome 1q25.3, is expressed in the cytoplasm [19], and was first identified in renal carcinogenesis of Eker rats [20]. Due to its overexpression, it is considered as a candidate marker in head and neck squamous cell carcinoma and squamous dysplasia [21], thyroid carcinoma [19], renal carcinoma [11] and prostate cancer [22]. It has been reported that under UV radiation, phosphorylation of FAM129A by AKT takes place in human glioblastoma and lung cancer cells, which results in proteasomal degradation of p53 [23] suggesting that FAM129A acts as a protector of cell life under stressful conditions. Moreover, it has been shown that induce level of FAM129A during ER stress may regulate protein translation machineries and modulate cell death signaling [24].
Our previous study predicted and found that miR-4521 binds to the 3232–3238 site of FAM129A [11]. In this study we have discovered that FAM129A is overexpressed in HCC patients and is positively correlated with MMP9 and negatively correlated with TIMP-1, which promotes HCC progression. In addition, we explored the expression of miR-4521 and FAM129A in HCC tissue samples and cells and found an antagonistic relationship between them. Moreover, the in vitro role of miR-4521 was investigated in detail. Overexpression of miR-4521 and knockdown of FAM129A results in reduction of migration, invasion, proliferation and amplification of apoptosis in HCCLM3 and HepG2 in comparison with the NC group. miR-4521-FAM129A axis mediated the malignant activities of HCC cancer cells via the p-FAK/p-AKT pathway. Our findings reveal that miR-4521 plays an important role as a tumor suppressor in HCC through regulation of FAM129A. miR-4521-FAM129A axis regulated pathways possibly offer valuable suggestions for HCC diagnosis and treatment.
Materials and methods
Ethics statement
The studies involving human participants were reviewed and approved by the Committee of Medical Ethics of Dalian Medical University, ethical number 014, year 2019. All protocols were carried out according to permitted guidelines and rules. The patients/participants provided their written informed consent to participate in this study.
Tissue samples
27 frozen human HCC tissues and their respective non-tumor liver tissues (17 male and 10 female patients, 7 patients aged ≥ 60 and 20 < 60) were collected from the division of Hepatobiliary and Pancreatic Surgery, Department of Surgery, the Second Affiliated Hospital of Dalian Medical University, Dalian, China. No patient received any chemo/radiotherapy before surgery. Tissue samples were well-preserved in liquid nitrogen immediately after the surgical resection.
Immunohistochemistry (IHC) assay
Expression levels of FAM129A (Proteintech, USA), MMP9 (Proteintech, USA) and TIMP-1 (Proteintech, USA) were determined by IHC assay in HCC tissue arrays. A biotin-streptavidin horseradish peroxidase (HRP) detection system (ZSGB-BIO, China) was used to treat samples according to the manufacturer’s guidelines and a DAB (diaminobenzidine) kit (ZSGB-BIO, China) was used to envision images using a BX63 microscope (Olympus, Japan). Score I represents IHC immunoreactive intensity and was classified into four ranks, 0 (negative), 1 (weak), 2 (moderate) and 3 (strong), whereas Score II signifies the observed positively stained cells, and the DAB staining level of each sample was categorized as 0 (none), 1 (1–10% cells per field), 2 (10–50%), 3 (51–75%) and 4 (>76%). The IHC immunoreactivity degree is the product of Score I and Score II and ranges from 0 to 12. The scores were considered in following way: 0–2 as negative (−), 3–5 as weak (+), 6–8 as moderate (++), and 9–12 as strong (+++). Scoring of IHC assays was done independently by two experienced pathologists.
Cell culture
Human hepatocellular carcinoma (HCC) cells HCCLM3 and HepG2 and normal liver cell line LO2 were used, and purchased from the Chinese Academy of Sciences, Shanghai, China. The genotyping analysis of two HCC cell lines were performed by extracting DNA from cells using the genomic extraction kit of Axygen, amplifying by STR amplification protocol, then the STR loci and sex gene Amelogenin were detected using an ABI 3730xl genetic analyzer. There were no multiple alleles and mutations found in the two cell lines. HCCLM3 and LO2 were cultured in Dulbecco’s modified Eagle’s medium (DMEM), (Gibco, USA) with 10% fetal bovine serum (FBS) (ExCell Bio, China) and 100U/mL streptomycin (Gibco, USA). HepG2 was cultured in 85% RPMI-1640 (Gibco, USA) medium supplemented by 15% fetal bovine serum (FBS) (ExCell Bio, China) and 100U/mL streptomycin (Gibco, USA). Cells were incubated in a humidified incubator at 37 °C with 5% CO2.
Reagents
miR-4521 mimic and its negative control miR-NC were purchased from GenePharma (Suzhou China). FAM129A si-RNA and its negative control NC-RNA were ordered from RiboBio (Guangzhou, China).
Transfection
For the purpose of transfection, miR-4521 mimic with its miRNA negative control (miR-NC), and small interfering RNA for FAM129A (si-FAM129A) with negative control (si-NC) were used. For transfection, 1 mL of HCCLM3 and HepG2 with density of 2x10⁵ cells per mL were implanted in a well of a six-well-plate for 12 h. At a confluence of ~ 75%, cells were then transfected by miR-4521 mimics (4 μL), miR-NC (4 μL), si-FAM129A (4 μL) and si-NC (4 μL) with the concentration of 20 μM in serum free medium with the addition of 4 μL lipofectamineTM 2000 reagent (Invitrogen, USA) for 20 min at room temperature. A mixture of 100 μL transfected cells were continuously incubated at 37 °C with 5% CO2 for 24 h and 48 h. Cells were collected from each group by using trypsin-EDTA (0.25%, Gibco, USA) at the respective times and transfection efficiency was measured.
Western blot assay
Total protein extraction was carried out with both groups of HCCLM3 and HepG2 transfected cells using radioimmunoprecipitation assay buffer (Tris-HCl, 150 mM NaCl, 50 mM, pH 8.0, 1% Triton X-100, 0.5% sodium deoxycholate, 0.1% SDS in the presence of 1 mM Na3VO4, 1 μg/mL leupeptin and 0.5 mM PMSF). After centrifugation of lysates at 12000 rpm for 15 min at 4 °C, the supernatant was collected. Using the Bradford assay, equal quantity (35μg) of each group protein sample was determined for Western blot assay. The samples were separated by 10% SDS-PAGE after heating for 5 min in the loading buffer. Electrophoretic transfer of protein bands was accomplished on a nitrocellulose (NC) membrane (Millipore, Merck), followed by blocking non-specific binding with skim milk 5% (w/v), (BD, USA) with TBST (pH 7.5, 0.1% Tween-20, 50 mM Tris and 100 mM NaCl), for 2 h at RT and then incubating overnight with shaking at 4 °C with primary antibodies. The primary antibodies used were FAM129A (1:800, Proteintech, Cat#21333–1-AP, USA), GAPDH (1:4000, Proteintech, Cat#10494–1-AP, USA), TIMP-1(1:1000, Proteintech, Cat#16644–1-AP, USA), MMP2 (1:500, Proteintech, Cat#10373–2-AP, USA), MMP9 (1:500, Proteintech, Cat#10373–2-AP, USA), MDM2 (1:500, Proteintech, Cat#19058–1-AP, USA), P53 (1:500, Proteintech, Cat#21891-1AP, USA), BCL-2 (1:1000, Proteintech, Cat#12789–1-AP, USA) and BAX (1:1000, Proteintech, Cat#50599–2-Ig, USA), Caspase-9 (1:1000, Abcam, Cat#ab185719, USA), p-FAK (1:500, Cell Signaling Technology Cat#3283, USA), Cytochrome-C (1:1000, Proteintech, Cat#10993–1-AP, USA), Caspase-3 (1:1000, Cell Signaling Technology Cat#9662, USA), p-AKT (1:500, Cell Signaling Technology Cat#9271, USA), E-cadherin (1:1000, Proteintech, Cat#20874–1-AP, USA), N-cadherin (1:1000, Proteintech, Cat# 22018–1-AP, USA), Snail (1:1000, Proteintech, Cat# 13099–1-AP, USA), Vimentin (1:1000, Proteintech, Cat# 10366–1-AP, USA). TBST was used to wash the membrane for 3 × 10 min. Later the secondary antibodies were introduced onto the membrane, incubated for 2 h, and then washed again for 3 × 10 min with TBST. Bands of protein were envisioned through ECL (Avanta, USA) and analyzed by the Bio-Rad ChemiDocTM MP system (Bio-Rad, USA). The unpaired Student’s t-test and ANOVA were carried out to calculate differences between groups.
Quantitative real-time RT-PCR (qRT-PCR) assay
TrizolTM reagent (Invitrogen, USA) was used for total RNA extraction from each group of cells. Then, the cDNA reverse transcription was performed using EasyScript® RT/RI Enzyme Mix and gDNA Eraser kit (TransGen Biotech, China). qRT-PCR was carried out using SYBR Green Master (ROX) (Roche, USA) with an Applied Biosystems StepOneTM Real-Time PCR System (Applied Biosystems, USA). snRNA U6 and β-actin (ACTB) were used as internal references for miR-4521 and mRNA levels of FAM129A, respectively. The 2-ΔΔCT method was used for analyzing relative levels of molecules of interest. Primer sequences designed for FAM129A and ACTB and U6 are provided in Table 1.
Table 1.
Primers used in this study.
| Gene | Primer | Sequence |
|---|---|---|
| FAM129A |
F R |
5′-CTCAGCCCTTTGTGGTCCT-3′ 5′-CTCCTGTCGGAAGAATTGCAC-3′ |
| ACTB | F R |
5′-AGGCCAACCGCGAGAAG-3′ 5′AGAGCCTGGATAGCAACGTACA-3′ |
| U6 | F R |
5′-CTCGCTTCGGCAGCACA-3′ 5′-AACGCTTCACGAATTTGCGT-3′ |
F = Forward, R = Reverse.
Migration and invasion assay
In vitro migration. Migratory capabilities of HCCLM3 and HepG2 cells were studied using a 24-well-plate Boyden chamber assay. Approximately 1 × 10⁴ HCCLM3 and HepG2 cells in 200 μL serum-free DMEM and RPMI-1640, respectively, were seeded onto the superior section of a transwell chamber with a polycarbonate filter unit (pore size 8 μm, Corning, USA). Chambers were then fixed into 24-well plates containing of 600 μL DMEM or RPMI-1640 accompanied with 20% FBS and then incubated at 37 °C with 5% CO2 for 24 h.
In vitro invasion. The chambers were layered by 50 μL ice cold extracellular matrix gel (ECM, Sigma, USA) with a dilution factor of 1:39 with DMEM for HCCLM3 and RPMI-1640 for HepG2 cells, respectively, and incubated for 1 h at 37 °C. 1 × 10⁴ cells were sown into the upper chamber of the transwell with 200 μL serum-free medium. The chambers were then fixed into 24-well plates containing 600 μL DMEM or RPMI-1640 with 20% FBS, and incubated for 24 h at 37 °C with 5% CO2. After 24 h, the non-invaded cells at the surface of the insert were detached using a swab, and invaded cells on the lower surface were stained with 0.5% crystal violet for 1 h, and then fixed with 100% methanol for 30 min before washing with PBS and counting using an upright light microscope (Olympus, Japan). The differences in triplicate experiments between miR-NC, miR-4521 mimic, si-NC and si-FAM129A were analyzed by using the unpaired Student’s t-test.
Cell proliferation and clonogenic assay
Cell proliferation rates were investigated by MTT assay. The transfected cells from each group were sown into a 96-well plate at 3 × 03 cells/well in 100 μL RPMI-1640 supplemented with 15% FBS per well for HepG2 and 3 × 10³ cells in DMEM supplemented with 10% FBS per well for HCCLM3, incubated with 5% CO2 at 37 °C for 24, 48, 72 and 96 h separately. MTT reagent (5 mg/mL) was used following the manufacturer’s protocol (Coolaber, Beijing, China) to treat each group for 4 h in darkness, and then replaced by 150 μL DMSO to diffuse formazan crystals. Finally, absorbance was measured at 492 nm by means of a microplate reader (Thermo, USA) for cell density quantification. The variances from different experiments between miR-NC, miR-4521 mimic, si-NC and si-FAM129A groups were interpreted using the unpaired Student’s t-test. Graphs are presented as absorbance versus time.
Colony formation aptitude was measured using 1000 dissociated cells in 2 mL RPMI-1640 supplemented with 15% FBS for HepG2 and 2 mL DMEM with10% FBS for HCCLM3 were seeded into six-well plates and kept at 37 °C with 5% CO2 for 14 days. When colonies appeared, they were fixed with 100% methanol (AR, Sigma, USA) for half an hour. The colony number in each well was counted after dying with 0.1% crystal violet. Triplicate experiments were performed for all groups.
Wound healing assay
After 24 h of transfection, the cells were allowed to grow to 80–90%. Then a linear perpendicular scratch wound was drawn with a 200 μL sterile pipette tip on the monolayer of cells, and the supernatant and debris were removed by PBS wash. To envision wandering cells, images were taken at 0, 24, and 48 h after scratching and the gap distance between miR-NC/miR-4521 and si-NC/si-FAM129A was measured and quantified using the ImageJ software. Unpaired Student’s t-test was applied to interpret difference between mean ± standard deviation of three different experiments. Graphs are presented as wound closure % versus time.
Immunofluorescence assay
HCCLM3 cells were transfected with miR-NC/miR-4521 mimics and si-NC/si-FAM129A. Each group contained 2x10⁴mL cells with 10% FBS DMEM. After 24 h of transfection, cells were fixed using 4% formaldehyde for 20 min at RT and blocked with 0.3% bovine serum albumin for 1 h to avoid non-specific binding. Incubation with FAM129A primary antibody (1:800, Proteintech, USA) was at 4 °C overnight in the dark. Then PBS was used to wash the cells and they were incubated with secondary antibody for 1 h in the dark at RT. Then 200 µL of 4′, 6-diamidino-2-phenylindole (DAPI), with concentration of 10 µg/mL, was used to dye HCCLM3 cells in the dark for 20 min at RT. Finally, an Olympus Bx3 upright fluorescence microscope was used to take images.
Statistical analysis and data processing
The data were processed as mean ± standard deviation for three independent experiments. A Student’s t test was used to calculate the difference between two groups. To calculate the differences from more than two groups, the one-way ANOVA test was executed. For IHC Chi-square and spearman rank correlation test was used. Overall data interpretations were achieved with SPSS (version 16.0, SPSS Inc.) and Graph pad prism 6.0. P ≤ 0.05 was considered as a standard of statistical significance value.
Results
MiR-4521 negatively regulates with FAM129A in HCC tissues and cells
To study the contributions of miR-4521 and FAM129A in the progression of hepatocellular carcinoma, we investigated the levels of expression of miR-4521 and FAM129A in tumorous tissues in comparison with their adjacent non-tumor tissues, as well as in HCC cells (HCCLM3 and HepG2) compared with a normal liver cell line LO2. qRT-PCR assay data showed a significantly lower level of miR-4521 in HCC tissues as compared to normal non-tumorous tissues (P = 0.0011, Fig. 1A), downregulation of miR-4521 was not significantly related to age and gender, while more deficiency of miR-4521 was observed in patients with advanced TNM stages. FAM129A mRNA levels were considerably higher in tumorous tissues compared to non-tumorous tissues (P = 0.0345, Fig. 1B). Upregulation of FAM129A was related to patient’s TNM stages (P = 0.0298) but not related to age and gender (P > 0.05). Moreover, FAM129A levels increases in patients with T3-4 stages as compared to patients with T1-2 stages. In addition, our statistical analysis showed a negative correlation between abridged miR-4521 and overexpressed FAM129A expression levels in HCC patients’ tumorous tissues (P < 0.0001, Fig. 1C).
Fig. 1.

miR-4521 and FAM129A expressions in HCC tissues and cell lines. (A and B) miR-4521 was downregulated and FAM129A was upregulated in HCC tumorous tissues compared with adjacent normal tissues with statistical significance (P = 0.0011, P = 0.0345) through the unpaired Student’s t-test analysis with a mean ± SD of 27 cases. (C) miR-4521 downregulation and FAM129A upregulation in HCC tumorous tissues were inversely correlated (P < 0.0001) using the Spearman correlation test. (D) miR-4521 mRNA was downregulated in HCC cells compared with LO2 cells. (E) FAM129A mRNA and (F) protein levels were increased in HCC cells compared with LO2 cells. ANOVA test was employed for difference analysis. (G) Negative and positive expression of FAM129A, MMP9 and TIMP-1. *, ** and *** denote P values below 0.05, 0.01 and 0.001.
To further confirm the relationship in HCC cells, qRT-PCR and western blot analyses were carried out. The expression level of miR-4521 mRNA was notably reduced in HCCLM3 and HepG2 cells compared with LO2 (P = 0.0018, Fig. 1D). Consistent with patient tissues data, the mRNA levels of FAM129A were also elevated in HCCLM3 and HepG2 cells compared to LO2 (P = 0.0042, Fig. 1E). In accordance, FAM129A protein levels were detected higher in HCCLM3 and HepG2 cells than LO2 (P = 0.0251, Fig. 1F), respectively. These results suggest an inverse correlation between the expressions of miR-4521 and FAM129A.
FAM129A overexpression is associated with HCC development and progression in tumorous tissues
A tissue microarray consisting of 208 HCC tumorous tissues was used to identify the expression patterns of FAM129A, MMP9 and TIMP-1. As shown in Table 2, expression of FAM129A and MMP9 was low in 62 (29.8%) and 61 (29.3%) samples with immunoreactivity -/+, and high in 146 (70.1%) and 147 (70.6%) samples with ++/+++ immunoreactivity, respectively, whereas expression of TIMP-1 was low in 132 (63.4%) samples and high in 76 (36.5%) samples. The overall trend showed high expressions of both FAM129A and MMP9 and low TIMP-1expression. The correlation in expression of FAM129A, MMP9 and TIMP-1 with clinicopathologic parameters of HCC patients was further studied in detail by using chi-Square test as shown in Table 3. High expression of FAM129A, MMP9 and low expression level of TIMP-1 was not related to patient age or gender, however, expressions of FAM129A and MMP9 were significantly related in T4vsT1 and T2vsT4 (P < 0.05), whereas expression of TIMP-1 was associated with Edmonson grade (IIIvsI, P = 0.05). In addition, FAM129A and MMP9 showed more positive and higher expression in tissue samples with advance stages and Edmonson grades whereas TIMP-1 expression was stronger in initial TNM stages and Edmonson grades. These results imply that high expression of FAM129A and MMP9 positively correlates with TNM stage and Edmonson grade in HCC samples while the expression level of TIMP-1 decreases in higher TNM stages and Edmonson grades. To further investigate the role of FAM129A in HCC progression we analyzed the inter-correlations between FAM129A, MMP9 and TIMP-1. As shown in Table 4, a positive correlation was found between FAM129A and MMP9 (P = 0.0001, r = 0.545) while a significant negative correlation was observed for FAM129A and TIMP-1(P = 0.0001, r = -0.333) and MMP9 and TIMP-1(P = 0.0001, r = -0.325). These findings indicate the clinical possibility of FAM129A facilitating HCC progression and metastasis via a positive correlation with MMP9 and a negative correlation with TIMP-1.
Table 2.
IHC assay of expressions of FAM129A, MMP9 and TIMP-1 in 208 patient samples.
| Protein | Group | Total | - | + | ++ | +++ |
|---|---|---|---|---|---|---|
| FAM129A | Tumorous Tissue | 208 | 9 | 53 | 111 | 35 |
| MMP9 | Tumorous Tissue | 208 | 11 | 50 | 113 | 34 |
| TIMP-1 | Tumorous Tissue | 208 | 33 | 99 | 58 | 18 |
Negative (−), Weak (+), Moderate (++), Strong (+++).
Table 3.
IHC assay of clinical association of FAM129A, MMP9 and TIMP-1 with HCC progression and metastasis.
| FAM129A | MMP9 | TIMP-1 | ||||||||||||||||
|---|---|---|---|---|---|---|---|---|---|---|---|---|---|---|---|---|---|---|
| Total | − | + | ++ | +++ | P | − | + | ++ | +++ | P | − | + | ++ | +++ | P | |||
| Age | ≥60 | 39 | 4 | 8 | 24 | 3 | 4 | 8 | 24 | 3 | 4 | 20 | 11 | 4 | ||||
| <60 | 169 | 6 | 45 | 87 | 31 | 0.101 | 7 | 41 | 90 | 31 | 0.170 | 29 | 81 | 45 | 14 | 0.754 | ||
| Total | 208 | |||||||||||||||||
| Gender | Male | 171 | 6 | 43 | 91 | 31 | 8 | 38 | 95 | 30 | 25 | 84 | 46 | 16 | ||||
| Female | 37 | 3 | 10 | 20 | 4 | 0.470 | 3 | 11 | 19 | 4 | 0.474 | 8 | 15 | 12 | 2 | 0.549 | ||
| Total | 208 | |||||||||||||||||
| T1 | 12 | 2 | 2 | 8 | 0 | 2 | 2 | 7 | 1 | 3 | 6 | 2 | 1 | |||||
| T1 VS T2 | T2 | 120 | 5 | 35 | 68 | 12 | 0.157 | 5 | 33 | 66 | 16 | 0.269 | 16 | 55 | 36 | 13 | 0.613 | |
| T2 | 120 | 5 | 35 | 68 | 12 | 5 | 33 | 66 | 16 | 16 | 55 | 36 | 13 | |||||
| T2 VS T3 | T3 | 60 | 2 | 15 | 28 | 15 | 0.070 | 4 | 14 | 33 | 9 | 0.838 | 11 | 27 | 18 | 4 | 0.704 | |
| T3 | 60 | 2 | 15 | 28 | 15 | 4 | 14 | 33 | 9 | 11 | 27 | 18 | 4 | |||||
| T3 VS T4 | T4 | 16 | 0 | 0 | 9 | 7 | 0.098 | 0 | 0 | 8 | 8 | 0.008 | 3 | 11 | 2 | 0 | 0.266 | |
| TNM Stage | T4 | 16 | 0 | 0 | 9 | 7 | 0 | 0 | 8 | 8 | 3 | 11 | 2 | 0 | ||||
| T4 VS T1 | T1 | 12 | 2 | 2 | 8 | 0 | 0.013 | 2 | 2 | 7 | 1 | 0.005 | 3 | 6 | 2 | 1 | 0.585 | |
| T3 | 60 | 2 | 15 | 28 | 15 | 4 | 14 | 33 | 9 | 11 | 27 | 18 | 4 | |||||
| T3 VS T1 | T1 | 12 | 2 | 2 | 8 | 0 | 0.063 | 2 | 2 | 7 | 1 | 0.628 | 3 | 6 | 2 | 1 | 0.810 | |
| T2 | 120 | 5 | 35 | 68 | 12 | 5 | 33 | 66 | 16 | 16 | 55 | 36 | 13 | |||||
| T2 VS T4 | T4 | 16 | 0 | 0 | 9 | 7 | 0.001 | 0 | 0 | 8 | 8 | 0.001 | 3 | 11 | 2 | 0 | 0.164 | |
| I | 40 | 0 | 14 | 19 | 7 | 1 | 13 | 22 | 4 | 6 | 15 | 14 | 5 | |||||
| I VS II | II | 129 | 6 | 31 | 75 | 17 | 0.367 | 8 | 28 | 71 | 22 | 0.356 | 15 | 62 | 40 | 12 | 0.685 | |
| Edmonson Grade | II | 129 | 6 | 31 | 75 | 17 | 8 | 28 | 71 | 22 | 15 | 62 | 40 | 12 | ||||
| II VS III | III | 39 | 1 | 6 | 20 | 12 | 0.073 | 1 | 7 | 24 | 7 | 0.758 | 9 | 21 | 9 | 0 | 0.065 | |
| III | 39 | 1 | 6 | 20 | 12 | 1 | 7 | 24 | 7 | 9 | 21 | 9 | 0 | |||||
| III VS I | I | 40 | 0 | 14 | 19 | 7 | 0.248 | 1 | 13 | 22 | 4 | 0.441 | 6 | 15 | 14 | 5 | 0.053 | |
IHC; immunohistochemistry, HCC; hepatocellular carcinoma.
Table 4.
Expression correlations of FAM129A with MMP9 and TIMP-1, and MMP9 with TIMP-1.
|
− |
FAM129A + |
++ |
+++ |
Total |
P and r |
||
| − | 4 | 7 | 0 | 0 | 11 | ||
| MMP9 | + | 4 | 24 | 20 | 1 | 49 | P = 0.0001 |
| ++ | 1 | 20 | 78 | 15 | 114 | r = 0.545 | |
| +++ | 0 | 1 | 15 | 18 | 34 | ||
|
− |
TIMP-1 + |
++ |
+++ |
Total |
P and r |
||
| − | 2 | 0 | 2 | 7 | 11 | ||
| MMP9 | + | 9 | 14 | 16 | 10 | 49 | P = 0.0001 |
| ++ | 14 | 69 | 30 | 1 | 114 | r = −0.325 | |
| +++ | 8 | 16 | 10 | 0 | 34 | ||
|
− |
FAM129A + |
++ |
+++ |
Total |
P and r |
||
| − | 1 | 10 | 11 | 11 | 33 | ||
| TIMP-1 | + | 1 | 13 | 69 | 16 | 99 | P = 0.0001 |
| ++ | 1 | 19 | 31 | 7 | 58 | r = −0.333 | |
| +++ | 6 | 10 | 2 | 0 | 18 |
Positive correlation between FAM129A and MMP9 whereas FAM129A and MMP9 are negatively correlated with TIMP-1.
MiR-4521 overexpression suppresses FAM129A expression in HCC cells
Additionally, to investigate whether miR-4521 deregulation disturbs FAM129A expression in HCCLM3 and HepG2 cells, we observed that transient transfection of miR-4521 mimic leads its expressions to increase 14771- and 14893-fold in HCCLM3 cells, and 70617- and 170168-fold in HepG2 cells at 24 h and 48 h, respectively (Fig. 2A). Overexpression of miR-4521 affects FAM129A mRNA levels, which were reduced by 37% (P = 0.0019) and 41.4% (P = 0.030) in HCCLM3 and by 24% (P = 0.0224) and 47.8% (P = 0.0026) in HepG2 cells at 24 h and 48 h (Fig. 2B), respectively.
Fig. 2.

miR-4521 overexpression reduced FAM129A expression in HCC cells. (A) Overexpression of miR-4521 in HCCLM3 and HepG2 cells at 24 h and 48 h. (B) FAM129A mRNA expression decreased in miR-4521 overexpressing HCCLM3 and HepG2 cells. (C) FAM129A protein expression level changes by miR-4521 overexpressing HCCLM3 and HepG2 cells. (D) Immunofluorescence assay of FAM129A expression pattern alterations in HCCLM3 cells. For each assay three different experiments were performed and shown as mean ± SD. The Unpaired Student’s t-test analysis was used to show differences. *, **, *** and **** indicate P values < 0.05, 0.01, 0.001 and 0.0001, respectively.
Western blots were performed to measure protein levels of FAM129A. miR-4521 upregulation resulted in reduction of protein expression levels of FAM129A in HCCLM3 by 45% (P = 0.0034) and 35% (P = 0.0149), whereas in HepG2 diminishing FAM129A expressions of 41.6% (P = 0.0178) and 51% (P = 0.0054) were observed at 24 h and 48 h (Fig. 2C). Moreover, immunofluorescence staining assays further confirmed lower and poor expression of FAM129A in HCCLM3 cells treated with miR-4521 mimics (Fig. 2D). These results suggest that miR-4521 upregulation significantly reduces the mRNA as well as the protein levels of FAM129A in miR-4521 mimic transfected cells compared to miR-NC. These findings collectively suggest that miR-4521 negatively regulates FAM129A through direct binding in HCC.
Overexpressed miR-4521 reduces HCC progression in vitro
To further determine the role of miR-4521 in HCC, miR-4521 mimic was introduced into HCC cells (HCCLM3 and HepG2) to investigate its effects on in vitro cell activities. miR-4521 overexpression adversely affected colony-formation abilities in HCCLM3 and HepG2 cells. The clonogenic formation assay revealed the number of colonies formed for miR-4521 mimic transfected HCCLM3 was 221 ± 23, decreased by about 36.9% from that (349 ± 24) of miR-NC-transfected group cells (P = 0.0026, Fig. 3A). At the same time, the colony-forming capacity decreased through the overexpressed miR-4521 in HepG2 cells by 29% (colony number decreased from 370 ± 44 to 263 ± 40, P = 0.0372, Fig. 3C). Furthermore, miR-4521 overexpression decreased the size of colonies in HCCLM3 and HepG2 cells.
Fig. 3.

miR-4521 overexpression on the bio-behaviors of HCCLM3 and HepG2. Overexpressed miR-4521 decreased the colony forming and proliferation abilities of (A and B) HCCLM3 and (C and D) HepG2 cells. (E and F) Transwell chamber assays showed that overexpression of miR-4521 reduced migration and invasion of HCCLM3 and HepG2 cells in vitro. (G and H) Wound healing assays showed low motility rates of cells transfected with miR-4521 mimic compared with miR-NC HCCLM3 and HepG2 cells. The statistics of 3 individual experiments for each assay are shown as mean ± SD. The unpaired Student’s t-test analysis was used to determine the variances. *, **and *** refer to P values below 0.05, 0.01 and 0.001.
To measure the rate of proliferation in hepatic cancer, MTT assay was then executed. The results showed that overexpressing miR-4521 significantly decreased proliferation in HCCLM3 by 16.9% (P = 0.0325), 18.0% (P = 0.0264) and 14.5% (P = 0.0014) at 48, 72 and 96 h (Fig. 3B) and in miR-4521 mimic transfected HepG2 cells the proliferation rate decreased by 16.7% (P = 0.0067), 17.7% (P = 0.0066), 19.1% (P = 0.0041) and 20% (P = 0.0051) at 24, 48, 72 and 96 h (Fig. 3D), respectively.
To further investigate the effect of miR-4521 upregulation on the migration and invasion aptitudes of HCCLM3 and HepG2 cells, Boyden transwell assays were used. miR-4521 overexpression abridged the migration, invasion and motility abilities of HCCLM3 and HepG2. As a result of miR-4521 overexpression, the quantity of average migrated cells per field was reduced from 204 ± 18.0 to 132 ± 9 for HCCLM3 cells (P = 0.0034, Fig. 3E), and from 230 ± 34 to 103 ± 8 for HepG2 cells (P = 0.003, Fig. 3F). Dependably, the mean number of invaded cells/field was reduced from 197 ± 24 to 108 ± 7 for HCCLM3 cells (P = 0.0034, Fig. 3E), and from 357 ± 21 to 187 ± 12 for HepG2 cells (P = 0.0003, Fig. 3F). Our data suggest tumor-suppressive features of miR-4521 in HCC tumorigenesis and suppression of the migrative and invasive capabilities of HCCLM3 and HepG2.
In addition, comparative cell motility was determined based on wound closure percentages. The wound healing assay exposed the low motility rate of cells transfected with miR-4521 mimic at 0, 24 and 48 h. As shown in Fig. 3G, the percentages of wound closures for miR-NC transfected HCCLM3 group cells were 46% (0.46 ± 0.03) and 72% (0.72 ± 0.011) at 24 and 48 h, while those for miR-4521 mimic transfected HCCLM3 group cell decreased to 31% (0.312 ± 0.016, P = 0.0024) and 61% (0.602 ± 0.031, P = 0.0026). The wound closure percentages for miR-NC-transfected HepG2 cells were 13% (0.12 ± 0.036), and 50% (0.502 ± 0.026), at 24 h and 48 h, while those for miR-4521 mimic transfected HepG2 group cells were 5% (0.046 ± 0.009, P = 0.0198) and 30% (0.308 ± 0.007, P = 0.0002, Fig. 3H), respectively. These results signify that miR-4521 acts as a tumor suppressor in hepatic cancer development and metastasis.
Knockdown of FAM129A decreased the migratory properties of HCCLM3 and HepG2 cells
To investigate the biological role of FAM129A in HCC, we first downregulated FAM129A with si-FAM129A in comparison with si-NC transfected HCCLM3 and HepG2 cells. The expression levels of FAM129A protein were reduced by 54% (P = 0.003) and 42% (P = 0.0109) in HCCLM3 (Fig. 4A) and by 27% (P = 0.0468) and 57% (P = 0.0078) in HepG2 cells (Fig. 4B) at 24 and 48 h, respectively. Consistently, mRNA levels of FAM129A were reduced to 55% (P = 0.0003) and 22% (P = 0.0136) in HCCLM3 and 23% (P = 0.0246) and 49% (P = 0.0031) in HepG2 cells transfected with si-FAM129A as compared to si-NC (Fig. 4C and 4D). Immunofluorescence staining assays showed poor and fuzzy expression of FAM129A in HCCLM3 cells transfected with si-FAM129A (Fig. 4E).
Fig. 4.

Knockdown of FAM129A inhibits in vitro malignant activities of hepatic cancer. (A and B) WB analysis of FAM129A protein expression levels in cells transfected with si-FAM129A compared with si-NC. (C and D) mRNA expression levels of FAM129A in HCCLM3 and HepG2 cells transfected with si-FAM129A compared with si-NC. (E) Immunofluorescence assays show FAM129A expression in HCCLM3 cells transfected by si-NC/si-FAM129A. (F and G) Colony formation assays and proliferation assays show that transfection of the siRNA of FAM129A significantly reduces colony formation and proliferation of HCCLM3 and (H and I) HepG2 cells, respectively. (J and K) The migration and invasion were determined by Transwell chamber assays for HCCLM3 and HepG2 cells followed by knockdown of FAM129A. (L and M) Wound healing assays showed decreased motility rate in si-FAM129A transfected HCCLM3 and HepG2 cells compared with si-NC. For each assay three different experiments were performed and presented by mean ± SD and to show difference Unpaired Student’s t-test was used. P < 0.05, 0.01and 0.001 are denoted by *, **and ***.
For si-FAM129A-transfected HCCLM3 and HepG2 cells, the knockdown of FAM129A abridged their colony-forming and proliferation abilities, compared with the si-NC transfected group. Clonogenic formation assay revealed that the number of colonies formed for si-transfected HCCLM3 group cells was 254 ± 36, which was a reduction of about 32% of that (374 ± 59.0) for si-NC-transfected group cells (P = 0.0407, Fig. 4F). Consistently, the colony-forming capacity was diminished through the si-FAM129A knockdown in HepG2 cells by 50% (colony number declined from 286 ± 18 to 141 ± 52, P = 0.0105, Fig. 4H). Furthermore, lower colony sizes were observed for both HCCLM3 and HepG2 cells.
The MTT assay was then carried out to measure the proliferation rate of HCC cells. The rate of proliferation of si-FAM129A-transfected HCCLM3 and HepG2 cells was significantly decreased by 13.4% (P = 0.0012), 17.5% (P = 0.0005) and 18.5% (P = 0.0005) and by 17.9% (P = 0.0051), 23.7% (P = 0.0024) and 19.4% (P = 0.0045) at 48, 72 and 96 h (Fig. 4G and 4I), respectively.
To further investigate the function of FAM129A in HCC, the migration, invasion and motility abilities of HCCLM3 and HepG2 cells were explored. As a result of knockdown of FAM129A, the average number of migrated cells/field was reduced from 497 ± 87 to 275 ± 33 for HCCLM3 cells (44.6%, P = 0.0147, Fig. 4J) and from 360 ± 69 to 200 ± 20 for HepG2 cells (44.5%, P = 0.018, Fig. 4K). The average number of invaded cells/field was reduced from 478 ± 42 to 257 ± 51 for HCCLM3 cells (46.3%, P = 0.004, Fig. 4J), and from 459 ± 54 to 263 ± 17 for HepG2 cells (42.6%, P = 0.003, Fig. 4K).
In addition, the comparative cell motility was determined based on wound closure percentage in si-FAM129A-transfected HCCLM3 and HepG2 cells at 0, 24 and 48 h, respectively. As shown in Fig. 4L, the percentages of wound closures for HCCLM3 si-NC transfected group cells were 14% (0.142 ± 0.033) and 32% (0.317 ± 0.012) at 24 and 48 h, while those for si-FAM129A transfected HCCLM3 group cells were decreased to 6% (0.05 ± 0.038, P = 0.0463) and 17% (0.168 ± 0.062, P = 0.0155). The wound closing percentages for the si-NC group of HepG2 cells were 20% (0.196 ± 0.02) and 31% (0.306 ± 0.024) at 24 and 48 h, while those for si-FAM129A transfected HepG2 group cells were 9% (0.093 ± 0.012, P = 0.0047) and 25% (0.247 ± 0.012, P = 0.0208, Fig. 4M). These results indicate that si-FAM129A has a suppressive effect in hepatic cancer metastasis.
Deregulation of miR-4521 mediates HCC malignancy via the TIMP-1/MMP9/MMP2 and p-FAK/p-AKT pathway in vitro
The results above have already shown that FAM129A expression levels are negatively regulated through miR-4521. For further validation we explored the axial regulation mechanism through WB assays. We found the protein expression levels of p-FAK (Tyr397) and p-AKT (Ser473), the downstream molecules of FAK signaling pathway, were decreased by 34% (P = 0.0119) and 49% (P = 0.002) in HCCLM3 cells and by 39% (P = 0.0336) and 44% (P = 0.0031) in HepG2 cells transfected with miR-4521 mimic compared with miR-NC (Fig. 5A). To gain a mechanistic picture of the potential role of miR-4521, the expression level of Snail and EMT markers were measured in HCCLM3 and HepG2 cells treated with miR-4521 mimic. As shown in Fig. 5B the expression level of Snail, N-cadherin and Vimentin decreased by 30% (P = 0.0446), 35% (P = 0.003) and 46% (P = 0.0245) in HCCLM3 and by 57% (P = 0.0068), 53% (P = 0.0087) and 18% (P = 0.0319) in HepG2 cells as compared to miR-NC, while E-cadherin increased 33.3% (P = 0.0387) and by 42.6% (P = 0.0152) in miR-4521 mimic transfected HCCLM3 and HepG2 cells (Fig. 5B), respectively. To further explore the malignant properties of overexpression of miR-4521, the levels of matrix metalloproteinases (MMP2 and MMP9) and their tissue inhibitor TIMP-1 were measured in miR-4521 mimic transfected HCCLM3 and HepG2 cells. Significant decreases in expression levels of MMP2 (61%, P = 0.004), and MMP9 (71.4%, P = 0.0001) in HCCLM3, and of MMP2 (43.6%, P = 0.0202) and MMP9 (56%, P < 0.0001) in HepG2 compared with miR-NC were observed, whereas elevated expression levels of TIMP-1 2.07-fold (P = 0.0011) and 1.35-fold (P = 0.0001) were observed in miR-4521 overexpressed HCCLM3 and HepG2 cells (Fig. 5C), respectively. Meanwhile, expression levels of MDM2 and BCL-2 decreased by 40.7% (P = 0.0242) and 47% (P = 0.0002) in HCCLM3 and 43% (P = 0.0314) and 31% (P = 0.0208) for HepG2 cells transfected by miR-4521 mimics compared with miR-NC. Likewise, the levels of P53, BAX, Cytochrome-C, Caspase-3 and Caspase-9 increased by 28.6% (P = 0.0125), 88% (P = 0.0070), 50.6% (P = 0.0292), 26.6% (P = 0.0016) and 114.6% (P = 0.005) in HCCLM3 and by 60.6% (P = 0.0301), 26% (P = 0.0033), 95% (P = 0.0004), 55.3% (P = 0.0010) and 52.3% (P = 0.0234) in HepG2 cells (Fig. 5D and 5E). Our data suggest that the miR-4521-FAM129A axis regulates the functions of HCCLM3 and HepG2 cells through MDM2/P53 regulating cell proliferation, through TIMP-1/MMP2/MMP9 and p-FAK/p-AKT/Snail/E-cadherin/N-cadherin/Vimentin (EMT) regulating migration and invasion, and through BCL-2/BAX/Cytochrome-C/Caspase-9/Caspase-3 regulating cellular apoptosis.
Fig. 5.

MiR-4521 overexpression regulates malignant properties of HCC cells by the p-FAK/p-AKT pathway. (A) Expression levels of p-FAK and p-AKT, (B) Snail, N-cadherin, E-cadherin and Vimentin, (C) MMP2, MMP9 and TIMP-1, (D) MDM2, P53, BAX and BCL-2, (E) Cytochrome-C, Caspase-3 and Caspase-9 were examined via WB analysis in HCCLM3 and HepG2 miR-4521 mimic transfected cells compared with miR-NC. P < 0.05, 0.01, 0.001 and 0.0001 are denoted by *, **, *** and ****.
FAM129A knockdown inhibits malignant behavior of HCC cells in vitro
Knockdown effects of FAM129A on the HCC cell’s malignant behavior were detected through WB assays. Si-FAM129A transfected HCCLM3 and HepG2 group cells showed decreased p-FAK and p-AKT protein levels by 37.6% (P = 0.0330) and 30% (P = 0.0291) in HCCLM3 and 53.7% (P = 0.0079) and 43% (P = 0.0102) in HepG2, respectively (Fig. 6A). To determine whether the typical molecular alterations of EMT occurred upon silencing FAM129A, we examined the protein levels of Snail, N-cadherin, Vimentin and E-cadherin in si-FAM129A transfected HCCLM3 and HepG2 cells. Interestingly, expressions of protein Snail, N-cadherin and Vimentin decreased by 31% (P = 0.0430), 25% (P = 0.0451) and 54% (P = 0.010) in HCCLM3 and by 50.7% (P = 0.0169), 65.6% (P = 0.0084) and 38% (P = 0.0237) in HepG2 cells, whereas E-cadherin expression increased by 50.3% (P = 0.0413) and 49.6% (P = 0.0384), respectively (Fig. 6B). To further explore the mechanistic role of FAM129A, we analyzed expression levels of MMP2, MMP9 and TIMP-1 in cells transfected with si-FAM129A as compared to si-NC, and found that expression levels of MMP2 and MMP9 were reduced by 52% (P = 0.007) and 65% (P < 0.0001) in HCCLM3 and by 33% (P = 0.0016) and 53% (P = 0.0123) in HepG2 cells, whereas TIMP-1 protein levels were increased by 32.3% (P = 0.0497) and 106.3% (P = 0.0445) in HCCLM3 and HepG2 cells, respectively (Fig. 6C). Knockdown of FAM129A resulted in decreased expression levels of MDM2 and BCL-2 by 37% (P = 0.0074) and 34% (P = 0.0064) in HCCLM3 and by 60% (P = 0.0016) and 53% (P = 0.0108) in HepG2 cells (Fig. 6D). At the same time, protein levels of P53, BAX, Cytochrome-C, Caspase-3 and Caspase-9 were increased by 110.6% (P = 0.0229), 21.6% (P = 0.0491), 104% (P = 0.0153), 116.6%, (P = 0.0128) and 47.6% (P = 0.0465) in HCCLM3 and by 123% (P = 0.0006), 55.6% (P < 0.0001), 130.6% (P = 0.0019), 113% (P = 0.009) and 145.6% (P = 0.0371) in HepG2 cells transfected with si-FAM129A as compared with si-NC, consistent with HCCLM3, respectively (Fig. 6D and 6E). Thus, the HCCLM3 and HepG2 malignancies were affected by FAM129A.
Fig. 6.

FAM129A knockdown suppressed HCC malignant behaviors and promoted apoptosis in vitro. (A) The protein expression levels of p-FAK, p-AKT, (B) Snail, N-cadherin, E-cadherin and Vimentin, (C) MMP2, MMP9 and TIMP-1, (D) MDM2, P53, BAX and BCL-2, (E) Cytochrome-C, Caspase-3 and Caspase-9 were determined by WB analysis in HCCLM3 and HepG2 si-FAM129A transfected group cells compared with si-NC. P < 0.05, 0.01, 0.001 and 0.0001 are denoted by *, **, *** and ****.
Discussion
Occurrence of hepatocellular carcinoma (HCC) is escalating and is homologous to advanced liver disease [25]. About 90% of all of the earliest hepatic malignancies result in HCC and denote a major global health problem [26]. Unfortunately, HCC shows very poor response towards immunotherapies as compared to other cancers [27]. The low survival rate for HCC is due to its usual diagnosis in the late incurable phase. Thus timely diagnosis and advances in therapies are necessary steps to increase survival times of patients suffering from HCC [28], [29].
Deregulation of microRNAs has been confirmed in nearly all kinds of human cancers [30], together with renal cancer [11], glioma [31], colon cancer [32], ovarian cancer [33], hepatocellular carcinoma [8] and bladder cancer [34]. miRNAs are generally involved in tumorigenesis via regulatory genes and signaling pathways [35]. Abnormal behavior of miR-4521 has been demonstrated in various tumors and previous studies suggest that miR-4521 is downregulated in renal cancer [11], chronic lymphocytic leukemia [15], hepatotoxicity [18] and medulloblastoma [36] and its deficiency was also reported in WJ-MSC derived neurons [37]. Due to the upregulation of miR-4521in focal cortical dysplasia (FCD), it has been considered as a potential biomarker for FCD with refractory epilepsy [16]. miR-4521, one of 11 miRNAs, has been reported as a potential prognostic biomarker for PDAC patients [14]. A study reported that the ratio of miR-4521/miR-340-5p may be a predictive factor for treatment and survival of esophageal adenocarcinoma patients [13]. Recent studies showed that miR-4521 overexpression suppressed proliferation and invasion and induce apoptosis by activating caspase-3 in medulloblastoma [11], [36]. Conversely, the role and mechanism of miR-4521 in HCC is still unidentified, and its role in the occurrence and progress of HCC needs to be determined. miRNAs mostly act by regulating target genes in tumor cells [38]. miRNAs, upon binding with the 3′-UTR region of its target genes, become post transcriptional regulators [29]. EIF4G2/PABPC-1 [39], FOXM1[36] and FAM129A [11] are target genes of miR-4521 in oxidative stress, medulloblastoma and ccRCC. Family with sequence similarity 129 member A (FAM129A), also termed as Niban, plays an important role in a different way as it may be a potential diagnostic biomarker in abdominal aortic aneurysm (AAA) by WGCNA [40]. In ovarian cancer, FAM129A was reported to be linked to chemoresistance and metastases along with other genes [41], and in prostate cancer FAM129A along with ATF4 is overexpressed in patient samples. Thus, silencing the ATF4-FAM129A axis may be a novel therapeutic agent [22]. In addition FAM129A regulates autophagy of cells in thyroid carcinoma [19]. However, no study was reported on association of miR-4521 and FAM129A in HCC. Our work demonstrated that miR-4521 deficiency negatively correlated with FAM129A upregulation in HCC tissues and cells. Furthermore, our this work aimed to reveal that overexpression of miR-4521 and knockdown of FAM129A regulates HCC malignancy by inhibiting cell proliferation via p-FAK/p-AKT/MDM2/P53 and promote apoptosis via p-FAK/p-AKT/BCL-2/BAX/Cytochrome-C/Caspase-3/Caspase-9 pathway, whereas reduction of HCC cells migration and invasion was observed via p-FAK/p-AKT/Snail/E-cadherin/N-cadherin/Vimentin and TIMP-1/MMP2/MMP9 pathways. In addition, we further confirmed FAM129A overexpression in HCC patient’s samples together with its separate positive and negative correlation with MMP9 and TIMP-1 contributed to HCC malignancy.
We validated that miR-4521 levels of expression were downregulated and FAM129A expression levels were upregulated in HCC tumorous tissue samples as compared with their corresponding non-tumorous tissues, which provides an inverse correlation between miR-4521 and FAM129A in HCC advancement (Fig. 1A, 1B and 1C). Our qRT-PCR results further confirmed that miR-4521 was downregulated, and that FAM129A was overexpressed in HCCLM3 and HepG2 cells as compared to normal liver cell line LO2 (Fig. 1D and 1E). The FAM129A protein expression level was also upregulated in HCCLM3 and HepG2 cells compared with LO2, which is consistent with mRNA levels of FAM129A (Fig. 1F). According to these findings we conclude that there is an antagonistic relationship between miR-4521 and FAM129A in HCC tissues and cells (Fig. 1). A well-established relation between miR-4521 and FAM129A can be observed in databases and is proved through luciferase reporter assays [11]. On the basis of these findings, we speculate that deficiency of miR-4521 is closely associated to overexpression of FAM129A, which strengthens HCC progression. As expected miR-4521 overexpression (Fig. 2A) not only markedly suppressed mRNA (Fig. 2B) but also decreased protein expression levels of FAM129A (Fig. 2C) by attaching to 3′-UTR of FAM129A. Immunofluorescence staining assays further confirmed much lower and dull expression of FAM129A in miR-4521 mimic-transfected HCCLM3 cells than in miR-NC-transfected cells (Fig. 2D). Furthermore, we observed significantly reduced colony forming, proliferation (Fig. 3A, 3B, 3C and 3D), migration, invasion (Fig. 3E and 3F) and motility (Fig. 3G and 3H) capacities of HCCLM3 and HepG2 cells.
To explore the function of FAM129A in HCC cells, we knocked down FAM129A by using FAM129A si-RNA. The protein and mRNA expression levels of FAM129A were significantly abridged in si-FAM129A transfected HCCLM3 and HepG2 cells compared with si-NC group cells (Fig. 4A, 4B, 4C and 4D). Subsequently, FAM129A downregulation via si-FAM129A resulted in a lower rate of colony formation and proliferation (Fig. 4F, 4G, 4H and 4I), migration and invasion (Fig. 4J and 4 K) and affected cell motility (Fig. 4L and 4 M) in HCCLM3 and HepG2 cells correspondingly. Our experimental data further confirmed that FAM129A knockdown exerts a similar effect on the malignant capacities of HCC cells as observed in miR-4521 upregulation. Moreover partial inhibition of HCC cells activities provides a clue that other compensation mechanisms might be activated within cells, which were not analyzed in current study, however further investigations are needed to better understand the underlying mechanism in cells. Despite all of the above findings, the mechanism for expression of miR-4521 and FAM129A still needs to be explored in detail.
Collected evidences show that the FAK/AKT pathway plays an important part in epithelial-mesenchymal transition (EMT) invasion and metastasis of many cancers including HCC, and FAK appears as an upstream regulator of AKT in cell metastasis [42], [43], [44]. EMT is a significant biological process of cancer-associated progression in different tumors including HCC [45], [46], [47], [48], [49]. During EMT, loss of cell–cell interaction is observed, hindering epithelial marker expressions such as E-cadherin, and encouraging mesenchymal marker expressions such as vimentin and N-cadherin, and tumor cells wander to distant organs by breaking through the extracellular matrix due to their increased invasive and migratory properties [50], [51]. FAM129A was reported as an upstream molecule of the FAK signaling pathway [52]. In the current study, by overexpressing miR-4521 and silencing FAM129A in HCC cells there was an obvious effect on cell migration and invasion (Fig. 3, Fig. 4). We demonstrated that miR-4521 overexpression and knockdown of FAM129A in HCCLM3 and HepG2 cells deactivates the FAK/AKT signaling pathway by dramatically suppressing phosphorylation of FAK and AKT at Tyr 397 and Ser 473, respectively, which reduces expression levels of Snail, a master inducer of EMT, and as a result upregulates E-cadherin (epithelial marker) and constrains N-cadherin and vimentin (mesenchymal markers), ultimately suppressing migration and invasion. Matrix metalloproteinases (MMPs) are considered one of the most important groups of proteinases. Being regulated by different tissue inhibitors, the MMPs are involved in invasion, migration, apoptosis and metastasis of cancerous cells [53]. Moreover, a previous study reported an effect of FAM129A on tumor progression by regulation of MMP2, through the FAK signaling pathway [52]. In the present study we focused on MMP2 and MMP9. We validated that miR-4521 overexpression by miR-4521 mimics and knockdown of FAM129A by si-FAM129A significantly reduced expressions of MMP2 and MMP9 by activating tissue inhibitor of metalloproteinase (TIMP-1), involved in regulation of MMPs [11], [54], [55] in HCCLM3 and HepG2 cells eventually suppressing the rate of migration and invasion. On the basis of these discoveries, it can be assumed that deficiency of miR-4521 inversely correlates with FAM129A upregulation encourages invasiveness and metastasis of hepatic cancer cells. More investigations are required to discover the detailed mechanisms of miR-4521 and FAM129A in HCC. Moreover, our IHC data of 208 patients also confirmed overexpression of FAM129A in HCC patient tissues, and a positive correlation between FAM129A and MMP9 has been observed in HCC tissues samples whereas FAM129A and MMP9 were negatively correlated with TIMP-1. Previous studies have separately revealed high expression of MMP2, MMP9 and low expression of TIMP-1 were observed in HCC cells and tissues [56], [57], [58]. However, it would be of great interest to apply IHC method to large cohort of HCC samples with detailed clinicopathological features and heterogenicity for better assessment of possible relationship of different biomarkers and their role in progression.
Abnormal expression of miR-4521 and FAM129A affected cell growth and apoptosis in HCC cells. In this work, the impacts of miR-4521 upregulation and FAM129A knockdown on HCC cell proliferation and apoptosis was reconnoitered via the p-FAK/p-AKT/MDM2/P53 and p-FAK/p-AKT/BCL-2/BAX/Cytochrome-C/Caspase-3/Caspase-9 pathways, respectively. AKT, being a downstream molecule of the FAK pathway, regulates MDM2, which sequentially regulates P53 [59], [60]. MDM2 is a negative regulator of P53. Elevated MDM2 inactivates transcriptional activity of P53 by promoting its degradation and results in cancer advancement [61], [62], [63]. Imbalances of MDM2/P53 lead to inducement of apoptosis by hindering BCL-2 and by increasing BAX [11], [64]. On the other hand, suppression of p-AKT levels also induces apoptosis by activating the BAX (pro-apoptotic gene) and by inhibiting the BCL-2 (anti-apoptotic gene) which in return releases Cytochrome-C from mitochondria, activating caspases [65]. In our present study overexpressing miR-4521 reduced FAM129A levels significantly, inhibiting expression levels of MDM2 and BCL-2 and elevating levels of P53, BAX, Cytochrome-C, Caspase-9, and Caspase-3 in HCCLM3 and HepG2 cells followed by the p-FAK/p-AKT pathway (Fig. 5). This resulted in decreased cellular proliferation and increased apoptosis. The impact of FAM129A overexpression would result in cancer cell growth and reduced apoptosis, opposite to what happens in downregulation of FAM129A in HCC cells. Following knockdown of FAM129A, the expression levels of the phosphorylated forms of FAK and AKT, MDM2 and anti-apoptotic protein BCL-2 levels were reduced, whereas the expression levels of P53, BAX Cytochrome-C, Caspase-9 and Caspase-3 increased in HCCLM3 and HepG2 cells (Fig. 6). Moreover, the current work shows that overexpressed miR-4521 and FAM129A knockdown alter the expression level of p-FAK/p-AKT pathway-related proteins as well as inhibited proliferation, migration and invasion of HCC cells. Despite of all these findings, limited inhibition of cell malignancy suggested that there must be other proteins mechanistically involved in compensation mechanisms within cells, which are worth to be investigated, as reported in one study the role of BCNP1 in cellular signaling pathways, which is not very well known protein [66], however apart from this there are numerous other proteins activated in cells and play significant role in signaling pathways, which needs to be explored. More work is required to understand the detailed role and mechanism of miR-4521, FAM129A and miR-4521-FAM129A axis in cancer.
Conclusion
Our work has demonstrated a negative correlation between miR-4521 and FAM129A in hepatic tissues and cells. miR-4521 upregulation in HCCLM3 and HepG2 cells suppressed migration and invasion, and reduced proliferation, promoting apoptosis through phosphorylation of FAK and AKT, targeting FAM129A. In addition, we further verified that miR-4521 overexpression and knockdown of FAM129A directly exerts anti-proliferative and anti-metastatic effects on HCC cells. Lack of miR-4521 and an excess of FAM129A results in cancer expansion by increasing rates of proliferation, migration and invasion of HCC cells. These consequences suggest that miR-4521/FAM129A-based targeted therapy might be a promising therapeutic treatment for hepatic cancer.
Compliance with Eethics requirements
All procedures followed were in accordance with the ethical standards of the responsible committee on human experimentation (institutional and national) and with the Helsinki Declaration of 1975, as revised in 2008 (5). Informed consent was obtained from all patients included in the study.
Human tissues were utilized after approval by the Ethical Committee of Dalian Medical University with ethical no. 014, year 2019. All protocols were carried out according to permitted guidelines and rules.
CRediT authorship contribution statement
Munawar Ayesha: Conceptualization, Methodology, Validation, Investigation, Visualization, Writing - original draft. Abbasi Majid: Methodology, Validation, Investigation, Visualization. Dongting Zhao: Methodology, Investigation. Frederick T. Greenaway: Writing - review & editing. Naimeng Yan: Methodology, Investigation. Qinlong Liu: Methodology. Shuqing Liu: Conceptualization, Supervision, Writing - review & editing. Ming-Zhong Sun: Conceptualization, Supervision, Writing - review & editing.
Declaration of competing interest
The authors declare that they have no known competing financial interests or personal relationships that could have appeared to influence the work reported in this paper.
Acknowledgements
This work was supported by grants from the National Natural Science Foundation of China (81672737, 81171957, and 81272186), the Natural Science Foundation of Liaoning (LQ2017001, LZ2019003, LZ2020045) and the Liaoning Provincial Program for Top Discipline of Basic Medical Sciences.
Footnotes
Peer review under responsibility of Cairo University.
Supplementary data to this article can be found online at https://doi.org/10.1016/j.jare.2021.05.003.
Contributor Information
Shuqing Liu, Email: lsqsmz@163.com.
Ming-Zhong Sun, Email: smzlsq@163.com.
Appendix A. Supplementary data
The following are the Supplementary data to this article:
References
- 1.Lei Q., Chen H., Zheng H., Deng F., Wang F., Li J., et al. Zygomatic bone metastasis from hepatocellular carcinoma and the therapeutic efficacy of apatinib: A case report and literature review. Medicine. 2019;98(18) doi: 10.1097/MD.0000000000014595. [DOI] [PMC free article] [PubMed] [Google Scholar]
- 2.Li L., Mo F., Hui E.P., Chan S.L., Koh J., Tang N.L.S., et al. The association of liver function and quality of life of patients with liver cancer. BMC Gastroenterol. 2019;19(1):66. doi: 10.1186/s12876-019-0984-2. [DOI] [PMC free article] [PubMed] [Google Scholar]
- 3.Kim E., Lisby A., Ma C., Lo N., Ehmer U., Hayer K.E., et al. Promotion of growth factor signaling as a critical function of beta-catenin during HCC progression. Nat. Commun. 2019;10(1):1909. doi: 10.1038/s41467-019-09780-z. [DOI] [PMC free article] [PubMed] [Google Scholar]
- 4.Liu X., Meng J., Xu H., Niu J. Alpha-fetoprotein to transaminase ratio is related to higher diagnostic efficacy for hepatocellular carcinoma. Medicine. 2019;98(17) doi: 10.1097/MD.0000000000015414. [DOI] [PMC free article] [PubMed] [Google Scholar]
- 5.Guo C., Zhao D., Zhang Q., Liu S., Sun M.Z. miR-429 suppresses tumor migration and invasion by targeting CRKL in hepatocellular carcinoma via inhibiting Raf/MEK/ERK pathway and epithelial-mesenchymal transition. Sci. Rep. 2018;8(1):2375. doi: 10.1038/s41598-018-20258-8. [DOI] [PMC free article] [PubMed] [Google Scholar]
- 6.Liu S., Guo C., Wang J., Wang B., Qi H., Sun M.Z. ANXA11 regulates the tumorigenesis, lymph node metastasis and 5-fluorouracil sensitivity of murine hepatocarcinoma Hca-P cells by targeting c-Jun. Oncotarget. 2016;7(13):16297–16310. doi: 10.18632/oncotarget.7484. [DOI] [PMC free article] [PubMed] [Google Scholar]
- 7.Liu C., Hu W., Li L.L., Wang Y.X., Zhou Q., Zhang F., et al. Roles of miR-200 family members in lung cancer: more than tumor suppressors. Future Oncol. 2018;14(27):2875–2886. doi: 10.2217/fon-2018-0155. [DOI] [PubMed] [Google Scholar]
- 8.Majid A., Wang J., Nawaz M., Abdul S., Ayesha M., Guo C., et al. miR-124-3p suppresses the invasiveness and metastasis of hepatocarcinoma cells via targeting CRKL. Fronti. Mol. Biosci. 2020;7(223) doi: 10.3389/fmolb.2020.00223. [DOI] [PMC free article] [PubMed] [Google Scholar]
- 9.Hu D., Li M., Su J., Miao K., Qiu X. Dual-targeting of miR-124-3p and ABCC4 promotes sensitivity to adriamycin in breast cancer cells. Genet. Test. Mol. Bioma. 2019;23(3):156–165. doi: 10.1089/gtmb.2018.0259. [DOI] [PubMed] [Google Scholar]
- 10.Zhao X., Chu J. MicroRNA-379 suppresses cell proliferation, migration and invasion in nasopharyngeal carcinoma by targeting tumor protein D52. Exp. Ther. Med. 2018;16(2):1232–1240. doi: 10.3892/etm.2018.6302. [DOI] [PMC free article] [PubMed] [Google Scholar] [Retracted]
- 11.Feng X., Yan N., Sun W., Zheng S., Jiang S., Wang J., et al. miR-4521-FAM129A axial regulation on ccRCC progression through TIMP-1/MMP2/MMP9 and MDM2/p53/Bcl2/Bax pathways. Cell Death Discov. 2019;5:89. doi: 10.1038/s41420-019-0167-5. [DOI] [PMC free article] [PubMed] [Google Scholar]
- 12.Camps C., Saini H.K., Mole D.R., Choudhry H., Reczko M., Guerra-Assuncao J.A., et al. Integrated analysis of microRNA and mRNA expression and association with HIF binding reveals the complexity of microRNA expression regulation under hypoxia. Mol. Cancer. 2014;13:28. doi: 10.1186/1476-4598-13-28. [DOI] [PMC free article] [PubMed] [Google Scholar]
- 13.Chiam K., Mayne G.C., Watson D.I., Woodman R.J., Bright T.F., Michael M.Z., et al. Identification of microRNA biomarkers of response to neoadjuvant chemoradiotherapy in esophageal adenocarcinoma using next generation sequencing. Ann. Surg. Oncol. 2018;25(9):2731–2738. doi: 10.1245/s10434-018-6626-z. [DOI] [PubMed] [Google Scholar]
- 14.Liao X., Wang X., Huang K., Yang C., Yu T., Han C., et al. Genome-scale analysis to identify prognostic microRNA biomarkers in patients with early stage pancreatic ductal adenocarcinoma after pancreaticoduodenectomy. Cancer Manag Res. 2018;10:2537–2551. doi: 10.2147/CMAR.S168351. [DOI] [PMC free article] [PubMed] [Google Scholar]
- 15.Pekarsky Y., Balatti V., Palamarchuk A., Rizzotto L., Veneziano D., Nigita G., et al. Dysregulation of a family of short noncoding RNAs, tsRNAs, in human cancer. PNAS. 2016;113(18):5071–5076. doi: 10.1073/pnas.1604266113. [DOI] [PMC free article] [PubMed] [Google Scholar]
- 16.Wang X., Sun Y., Tan Z., Che N., Ji A., Luo X., et al. Serum microRNA-4521 is a potential biomarker for focal cortical dysplasia with refractory epilepsy. Neurochem. Res. 2016;41(4):905–912. doi: 10.1007/s11064-015-1773-0. [DOI] [PubMed] [Google Scholar]
- 17.Cabantous S., Hou X., Louis L., He H., Mariani O., Sastre X., et al. Evidence for an important role of host microRNAs in regulating hepatic fibrosis in humans infected with Schistosoma japonicum. Int. J. Parasitol. 2017;47(13):823–830. doi: 10.1016/j.ijpara.2017.05.007. [DOI] [PubMed] [Google Scholar]
- 18.Yang S., Chen L., Wen C., Zhang X., Feng X., Yang F. MicroRNA expression profiling involved in MC-LR-induced hepatotoxicity using high-throughput sequencing analysis. J. Toxicol. Env. Heal. A. 2018;81(5):89–97. doi: 10.1080/15287394.2017.1415580. [DOI] [PubMed] [Google Scholar]
- 19.Nozima B.H., Mendes T.B., Pereira G., Araldi R.P., Iwamura E.S.M., Smaili S.S., et al. FAM129A regulates autophagy in thyroid carcinomas in an oncogene-dependent manner. Endocr. Relat. Cancer. 2019;26(1):227–238. doi: 10.1530/ERC-17-0530. [DOI] [PubMed] [Google Scholar]
- 20.Adachi H., Majima S., Kon S., Kobayashi T., Kajino K., Mitani H., et al. Niban gene is commonly expressed in the renal tumors: a new candidate marker for renal carcinogenesis. Oncogene. 2004;23(19):3495–3500. doi: 10.1038/sj.onc.1207468. [DOI] [PubMed] [Google Scholar]
- 21.Ito S., Fujii H., Matsumoto T., Abe M., Ikeda K., Hino O. Frequent expression of Niban in head and neck squamous cell carcinoma and squamous dysplasia. Head Neck. 2010;32(1):96–103. doi: 10.1002/hed.21153. [DOI] [PubMed] [Google Scholar]
- 22.Pallmann N., Livgard M., Tesikova M., Zeynep Nenseth H., Akkus E., Sikkeland J., et al. Regulation of the unfolded protein response through ATF4 and FAM129A in prostate cancer. Oncogene. 2019;38(35):6301–6318. doi: 10.1038/s41388-019-0879-2. [DOI] [PubMed] [Google Scholar]
- 23.Ji H., Ding Z., Hawke D., Xing D., Jiang B.H., Mills G.B., et al. AKT-dependent phosphorylation of Niban regulates nucleophosmin- and MDM2-mediated p53 stability and cell apoptosis. EMBO Rep. 2012;13(6):554–560. doi: 10.1038/embor.2012.53. [DOI] [PMC free article] [PubMed] [Google Scholar]
- 24.Sun G.D., Kobayashi T., Abe M., Tada N., Adachi H., Shiota A., et al. The endoplasmic reticulum stress-inducible protein Niban regulates eIF2alpha and S6K1/4E-BP1 phosphorylation. Biochem. Biophys. Res. Commun. 2007;360(1):181–187. doi: 10.1016/j.bbrc.2007.06.021. [DOI] [PubMed] [Google Scholar]
- 25.Hartke J., Johnson M., Ghabril M. The diagnosis and treatment of hepatocellular carcinoma. Semin. Diagn. Pathol. 2017;34(2):153–159. doi: 10.1053/j.semdp.2016.12.011. [DOI] [PubMed] [Google Scholar]
- 26.Grandhi M.S., Kim A.K., Ronnekleiv-Kelly S.M., Kamel I.R., Ghasebeh M.A., Pawlik T.M. Hepatocellular carcinoma: From diagnosis to treatment. Surg. Oncol. 2016;25(2):74–85. doi: 10.1016/j.suronc.2016.03.002. [DOI] [PubMed] [Google Scholar]
- 27.Zhang Q., He Y., Luo N., Patel S.J., Han Y., Gao R., et al. Landscape and dynamics of single immune cells in hepatocellular carcinoma. Cell. 2019;179(4):829–45 e20. doi: 10.1016/j.cell.2019.10.003. [DOI] [PubMed] [Google Scholar]
- 28.Zhang N, Hu Z, Qiang Y, Zhu X. Circulating miR-130b- and miR-21-based diagnostic markers and therapeutic targets for hepatocellular carcinoma. Mol. Genet. Genom. Med. 2019 doi: 10.1002/mgg3.1012. [DOI] [PMC free article] [PubMed] [Google Scholar]
- 29.Ma Y., Ma M., Ma L., Zhang F., Liu Y., Ma X. Downregulation of miR-552 in hepatocellular carcinoma inhibits cell migration and invasion, and promotes cell apoptosis via RUNX3. Exp. Therap. Med. 2019;18(5):3829–3836. doi: 10.3892/etm.2019.8061. [DOI] [PMC free article] [PubMed] [Google Scholar]
- 30.Liu F., Zhang Q., Liang Y. MicroRNA-598 acts as an inhibitor in retinoblastoma through targeting E2F1 and regulating AKT pathway. J. Cell. Biochem. 2019 doi: 10.1002/jcb.29453. [DOI] [PubMed] [Google Scholar]
- 31.Su H.Y., Lin Z.Y., Peng W.C., Guan F., Zhu G.T., Mao B.B., et al. MiR-448 downregulates CTTN to inhibit cell proliferation and promote apoptosis in glioma. Eur. Rev. Med. Pharmacol. Sci. 2018;22(12):3847–3854. doi: 10.26355/eurrev_201806_15269. [DOI] [PubMed] [Google Scholar]
- 32.Lou Q., Liu R., Yang X., Li W., Huang L., Wei L., et al. miR-448 targets IDO1 and regulates CD8(+) T cell response in human colon cancer. J. ImmunoTher. Cancer. 2019;7(1):210. doi: 10.1186/s40425-019-0691-0. [DOI] [PMC free article] [PubMed] [Google Scholar]
- 33.Min F., Chu G. Long noncoding RNA PCAT-1 knockdown prevents the development of ovarian cancer cells via microRNA-124-3p. J. Cell Biochem. 2019 doi: 10.1002/jcb.29431. [DOI] [PubMed] [Google Scholar]
- 34.Fu W., Wu X., Yang Z., Mi H. The effect of miR-124-3p on cell proliferation and apoptosis in bladder cancer by targeting EDNRB. Arch. Med. Sci. 2019;15(5):1154–1162. doi: 10.5114/aoms.2018.78743. [DOI] [PMC free article] [PubMed] [Google Scholar]
- 35.Rathod S.S., Rani S.B., Khan M., Muzumdar D., Shiras A. Tumor suppressive miRNA-34a suppresses cell proliferation and tumor growth of glioma stem cells by targeting Akt and Wnt signaling pathways. FEBS Open Bio. 2014;4(1):485–495. doi: 10.1016/j.fob.2014.05.002. [DOI] [PMC free article] [PubMed] [Google Scholar]
- 36.Senfter D., Samadaei M., Mader R.M., Gojo J., Peyrl A., Krupitza G., et al. High impact of miRNA-4521 on FOXM1 expression in medulloblastoma. Cell Death Dis. 2019;10(10):696. doi: 10.1038/s41419-019-1926-1. [DOI] [PMC free article] [PubMed] [Google Scholar]
- 37.Zhuang H., Zhang R., Zhang S., Shu Q., Zhang D., Xu G. Altered expression of microRNAs in the neuronal differentiation of human Wharton's Jelly mesenchymal stem cells. Neurosci. Lett. 2015;600:69–74. doi: 10.1016/j.neulet.2015.05.061. [DOI] [PubMed] [Google Scholar]
- 38.Guo H., Ingolia N.T., Weissman J.S., Bartel D.P. Mammalian microRNAs predominantly act to decrease target mRNA levels. Nature. 2010;466(7308):835–840. doi: 10.1038/nature09267. [DOI] [PMC free article] [PubMed] [Google Scholar]
- 39.Xie D., Zhou Y., Luo X. Amorphous silica nanoparticles induce tumorigenesis via regulating ATP5H/SOD1-related oxidative stress, oxidative phosphorylation and EIF4G2/PABPC1-associated translational initiation. PeerJ. 2019;7 doi: 10.7717/peerj.6455. [DOI] [PMC free article] [PubMed] [Google Scholar]
- 40.Chen S., Yang D., Lei C., Li Y., Sun X., Chen M., et al. Identification of crucial genes in abdominal aortic aneurysm by WGCNA. PeerJ. 2019;7 doi: 10.7717/peerj.7873. [DOI] [PMC free article] [PubMed] [Google Scholar]
- 41.Salgado-Albarran M., Gonzalez-Barrios R., Guerra-Calderas L., Alcaraz N., Estefania Sanchez-Correa T., Castro-Hernandez C., et al. The epigenetic factor BORIS (CTCFL) controls the androgen receptor regulatory network in ovarian cancer. Oncogenesis. 2019;8(8):41. doi: 10.1038/s41389-019-0150-2. [DOI] [PMC free article] [PubMed] [Google Scholar]
- 42.Hakimee H., Hutamekalin P., Tanasawet S., Chonpathompikunlert P., Tipmanee V., Sukketsiri W. Metformin inhibit cervical cancer migration by suppressing the FAK/Akt signaling pathway. Asian Pac. J. Cancer P. 2019;20(12):3539–3545. doi: 10.31557/APJCP.2019.20.12.3539. [DOI] [PMC free article] [PubMed] [Google Scholar]
- 43.Zhang X., Liu Y., Fan C., Wang L., Li A., Zhou H., et al. Lasp1 promotes malignant phenotype of non-small-cell lung cancer via inducing phosphorylation of FAK-AKT pathway. Oncotarget. 2017;8(43):75102–75113. doi: 10.18632/oncotarget.20527. [DOI] [PMC free article] [PubMed] [Google Scholar]
- 44.Wang B., Luo Y., Zhou X., Li R. Trifluoperazine induces apoptosis through the upregulation of Bax/Bcl-2 and downregulated phosphorylation of AKT in mesangial cells and improves renal function in lupus nephritis mice. Int. J. Mol. Med. 2018;41(6):3278–3286. doi: 10.3892/ijmm.2018.3562. [DOI] [PMC free article] [PubMed] [Google Scholar]
- 45.He Y., He X. MicroRNA-370 regulates cellepithelial-mesenchymal transition, migration, invasion, and prognosis of hepatocellular carcinoma by targeting GUCD1. Yonsei Med. J. 2019;60(3):267–276. doi: 10.3349/ymj.2019.60.3.267. [DOI] [PMC free article] [PubMed] [Google Scholar]
- 46.Xue Y., Xu W., Zhao W., Wang W., Zhang D., Wu P. miR-381 inhibited breast cancer cells proliferation, epithelial-to-mesenchymal transition and metastasis by targeting CXCR4. Biomed. Pharmacother. 2017;86:426–433. doi: 10.1016/j.biopha.2016.12.051. [DOI] [PubMed] [Google Scholar]
- 47.Sung W.J., Kim H., Park K.K. The biological role of epithelial-mesenchymal transition in lung cancer (Review) Oncol. Rep. 2016;36(3):1199–1206. doi: 10.3892/or.2016.4964. [DOI] [PubMed] [Google Scholar]
- 48.Zhang G., Zhang G. Upregulation of FoxP4 in HCC promotes migration and invasion through regulation of EMT. Oncol. Lett. 2019;17(4):3944–3951. doi: 10.3892/ol.2019.10049. [DOI] [PMC free article] [PubMed] [Google Scholar]
- 49.Hawsawi O., Henderson V., Burton L.J., Dougan J., Nagappan P., Odero-Marah V. High mobility group A2 (HMGA2) promotes EMT via MAPK pathway in prostate cancer. Biochem. Biophys. Res. Commun. 2018;504(1):196–202. doi: 10.1016/j.bbrc.2018.08.155. [DOI] [PMC free article] [PubMed] [Google Scholar]
- 50.Voulgari A., Pintzas A. Epithelial-mesenchymal transition in cancer metastasis: mechanisms, markers and strategies to overcome drug resistance in the clinic. BBA. 2009;1796(2):75–90. doi: 10.1016/j.bbcan.2009.03.002. [DOI] [PubMed] [Google Scholar]
- 51.Mathias R.A., Simpson R.J. Towards understanding epithelial-mesenchymal transition: a proteomics perspective. BBA. 2009;1794(9):1325–1331. doi: 10.1016/j.bbapap.2009.05.001. [DOI] [PubMed] [Google Scholar]
- 52.Zhang N., Zhou X.M., Yang F.F., Zhang Q., Miao Y., Hou G. FAM129A promotes invasion and proliferation by activating FAK signaling pathway in non-small cell lung cancer. Int. J. Clin. Exp. Path. 2019;12(3):893–900. [PMC free article] [PubMed] [Google Scholar]
- 53.Merchant N., Nagaraju G.P., Rajitha B., Lammata S., Jella K.K., Buchwald Z.S., et al. Matrix metalloproteinases: their functional role in lung cancer. Carcinogenesis. 2017;38(8):766–780. doi: 10.1093/carcin/bgx063. [DOI] [PubMed] [Google Scholar]
- 54.Lorenc Z., Waniczek D., Lorenc-Podgorska K., Krawczyk W., Domagala M., Majewski M., et al. Profile of expression of genes encoding matrix metallopeptidase 9 (MMP9), matrix metallopeptidase 28 (MMP28) and TIMP metallopeptidase inhibitor 1 (TIMP1) in colorectal cancer: Assessment of the role in diagnosis and prognostication. Med. Sci. Monitor. 2017;23:1305–1311. doi: 10.12659/MSM.901593. [DOI] [PMC free article] [PubMed] [Google Scholar]
- 55.Yan M.D., Yao C.J., Chow J.M., Chang C.L., Hwang P.A., Chuang S.E., et al. Fucoidan elevates microRNA-29b to regulate DNMT3B-MTSS1 axis and inhibit EMT in human hepatocellular carcinoma cells. Mar. Drugs. 2015;13(10):6099–6116. doi: 10.3390/md13106099. [DOI] [PMC free article] [PubMed] [Google Scholar]
- 56.Ogasawara S., Yano H., Momosaki S., Nishida N., Takemoto Y., Kojiro S., et al. Expression of matrix metalloproteinases (MMPs) in cultured hepatocellular carcinoma (HCC) cells and surgically resected HCC tissues. Oncol. Rep. 2005;13(6):1043–1048. [PubMed] [Google Scholar]
- 57.Wei Q.Y., Wu Y.Q., Fan S.Q. [Expression of matrix metalloproteinases and tissue inhibitors of matrix metalloproteinases in the hepatocellular carcinomas] Bull. Hunan Med. Univ. 2003;28(3):212–216. [PubMed] [Google Scholar]
- 58.El Tayebi H.M., Salah W., El Sayed I.H., Salam E.M., Zekri A.R., Zayed N., et al. Expression of insulin-like growth factor-II, matrix metalloproteinases, and their tissue inhibitors as predictive markers in the peripheral blood of HCC patients. Biomarkers. 2011;16(4):346–354. doi: 10.3109/1354750X.2011.573095. [DOI] [PubMed] [Google Scholar]
- 59.Takahashi K., Miyashita M., Makino H., Akagi I., Orita H., Hagiwara N., et al. Expression of Akt and Mdm2 in human esophageal squamous cell carcinoma. Exp. Mol. Pathol. 2009;87(1):42–47. doi: 10.1016/j.yexmp.2008.11.013. [DOI] [PubMed] [Google Scholar]
- 60.He S.L., Wang W.P., Yang Y.S., Li E.M., Xu L.Y., Chen L.Q. FAM3B promotes progression of oesophageal carcinoma via regulating the AKT-MDM2-p53 signalling axis and the epithelial-mesenchymal transition. J. Cell Mol. Med. 2019;23(2):1375–1385. doi: 10.1111/jcmm.14040. [DOI] [PMC free article] [PubMed] [Google Scholar]
- 61.Wang J., Zheng T., Chen X., Song X., Meng X., Bhatta N., et al. MDM2 antagonist can inhibit tumor growth in hepatocellular carcinoma with different types of p53 in vitro. J. Gastroenterol. Hepatol. 2011;26(2):371–377. doi: 10.1111/j.1440-1746.2010.06440.x. [DOI] [PubMed] [Google Scholar]
- 62.Azer S.A. MDM2-p53 interactions in human hepatocellular carcinoma: What Is the role of nutlins and new therapeutic options? J. Clin Med. 2018;7(4) doi: 10.3390/jcm7040064. [DOI] [PMC free article] [PubMed] [Google Scholar]
- 63.Ammoun S., Schmid M.C., Zhou L., Hilton D.A., Barczyk M., Hanemann C.O. The p53/mouse double minute 2 homolog complex deregulation in merlin-deficient tumours. Mol. Oncol. 2015;9(1):236–248. doi: 10.1016/j.molonc.2014.08.005. [DOI] [PMC free article] [PubMed] [Google Scholar]
- 64.Rashmi R., Kumar S., Karunagaran D. Human colon cancer cells lacking Bax resist curcumin-induced apoptosis and Bax requirement is dispensable with ectopic expression of Smac or downregulation of Bcl-XL. Carcinogenesis. 2005;26(4):713–723. doi: 10.1093/carcin/bgi025. [DOI] [PubMed] [Google Scholar]
- 65.Gajendran B., Durai P., Madhu Varier K., Chinnasamy A. A novel phytosterol isolated from Datura inoxia, RinoxiaB is a potential cure colon cancer agent by targeting BAX/Bcl2 pathway. Bioorg. Med. Chem. 2020;28(2) doi: 10.1016/j.bmc.2019.115242. [DOI] [PubMed] [Google Scholar]
- 66.Patel S.J., Trivedi G.L., Darie C.C., Clarkson B.D. The possible roles of B-cell novel protein-1 (BCNP1) in cellular signalling pathways and in cancer. J. Cell Mol. Med. 2017;21(3):456–466. doi: 10.1111/jcmm.12989. [DOI] [PMC free article] [PubMed] [Google Scholar]
Associated Data
This section collects any data citations, data availability statements, or supplementary materials included in this article.