Abstract
Study of human monocytic Myeloid-Derived Suppressor cells Mo-MDSC (CD14+ HLA-DRneg/low) has been hampered by the lack of positive cell-surface markers. In order to identify positive markers for Mo-MDSC, we performed microarray analysis comparing Mo-MDSC cells from healthy subjects versus CD14+ HLA-DRhigh monocytes. We have identified the surface ectoenzyme Vanin-2(VNN2) protein as a novel biomarker highly-enriched in healthy subjects Mo-MDSC. Indeed, healthy subjects Mo-MDSC cells expressed 68% VNN2, whereas only 9% VNN2 expression was observed on CD14+ HLA-DRhigh cells (n=4 p<0.01). The top 10 percent positive VNN2 monocytes expressed CD33 and CD11b while being negative for HLA-DR, CD3, CD15, CD19 and CD56, consistent with a Mo-MDSC phenotype. CD14+VNN2high monocytes were able to inhibit CD8 T cell proliferation comparably to traditional Mo-MDSC at 51% and 48% respectively. However, VNN2 expression on CD14+ monocytes from glioma patients was inversely correlated to their grade. CD14+VNN2high monocytes thus appear to mark a monocytic population similar to Mo-MDSC only in healthy subjects, which may be useful for tumor diagnoses.
Keywords: Immunosuppression, Mo-MDSC, VNN2, GPI-80
Summary Sentence:
Myeloid-Derived Suppressor Cells (MDSC) are identified by upregulated expression of the cell surface ectoenzyme Vanin-2 in healthy subjects
Introduction
Myeloid Derived Suppressor Cells (MDSC) were initially described in oncology patients and comprise an intrinsic part of the myeloid-cell lineage 1. MDSC are a heterogeneous population of mainly immature cells that accumulate in the peripheral blood during oncogenic transformations, inflammation and/or infection 1,2. Human MDSC classification is defined as either granulocytic CD14neg CD15+ CD33+ CD11b+, HLA-DR-non-expressors (G-MDSC) or monocyte-derived, with an expression pattern of: CD14+ CD15neg CD33+ CD11b+, HLA-DRneg/low (Mo-MDSC) based upon expression ratios of the identified markers 1,3–7.
Bone marrow derived monocytes produced in healthy individuals quickly mature into granulocytes, macrophages or dendritic cells (DC). During chronic inflammatory conditions such as cancer, increased soluble mediators, such as VEGF, GM-CSF and prostaglandins can block monocyte differentiation and result in an expanded Mo-MDSC population observed in the peripheral blood of cancer patients 8. However, even in healthy subjects, there have been reports of the presence, albeit in very low numbers, of Mo-MDSC cells9–13. Although specific markers to identify human Mo-MDSC have been described 5–14, the most common approach to specifically isolate Mo-MDSC is based upon examination of CD14+ expression together with low expression of HLA-DR followed by functional testing of T cell suppressive capacity15–17. In murine models, surface expression of Ly6C and Ly6G in combination with CD11b has been used to identify and quantify monocytic or granulocytic MDSC subtypes18–21, however, human orthologs for Ly6C and Ly6G have not been identified. The lack of definitive (+) markers for human monocyte-derived MDSC is a major obstacle that researchers cite for the delays in characterization and in situ examination of this diverse immunosuppressive population 15.
Using a microarray analysis, we have identified the enzyme Vascular non-inflammatory molecule 2 (Vanin-2/VNN2/GPI-80) as a surface protein highly expressed on Mo-MDSC from healthy individuals compared to CD14+ HLA-DRhigh cells. VNN2 is an ectoenzyme that is GPI-anchored and consists of two other isoforms, VNN1 and VNN3. Together, these three isotypes constitute the Vanin family of proteins. VNN2 was initially identified as a molecule that facilitates CD15+ neutrophil transendothelial migration 22. In addition to neutrophils, expression of VNN2 is also observed on a subset of monocytes (CD14+) 23 a marker we confirmed herein where we examined VNN2 expression on CD15neg CD14+ monocytes.
Vanins as a family of proteins possess pantetheinase activity and regulate pro-inflammatory as well as oxidative processes24,25. Interestingly, VNN2 is expressed on CD14 positive monocytes that exhibit lower capacity for antigen presentation, increased phagocytic uptake and production of reactive oxygen intermediates (ROS), along with enhanced expression of CD11b, CD32 and CD64 23. However, the effect that VNN2 has in the biologic response of Mo-MDSC has not been rigorously investigated. It has also been postulated that expression of VNN2 may mark an early undifferentiated cellular stage on self-renewing hematopoietic stem cells26.
In the current study, despite the low numbers of Mo-MDSC present in healthy subjects9–11,13, we present evidence that surface expression of VNN2 is enhanced on CD15neg Mo-MDSC and may be used to identify, quantify and isolate live human Mo-MDSC in a positive manner.
Materials and Methods
Human Subjects
Human volunteer studies were approved by the Institutional Review Board of University Hospitals Cleveland Medical Center (UHCMC). Peripheral blood samples from healthy control subjects or cancer patients were obtained following informed consent. All procedures were performed in accordance with Declaration of Helsinki principles. All cancer subjects had imaging confirmation of complete or near-complete resection, and diagnosis of corresponding brain cancer confirmed by pathology. The sample size (n) in figures identify number of different donor cells. Healthy subjects were enrolled as described previously12. For micro-array studies, a minimum of 250mL of blood was needed to obtain sufficient numbers of Mo-MDSCs per array, due to their low density in healthy subjects.
Cell Isolation and Sorting
Fresh PBMC isolates were obtained from healthy volunteers’ using Histopaque density gradient centrifugation (Sigma-Aldrich, St. Louis, MO) as described previously 27. Magnetic CD14 Micro beads were used to positively select CD14+ monocytes according to the manufacturer’s instructions (Miltenyi Biotech, San Diego, CA). CD14+ cells were then flow-sorted into HLA-DRneg/low Mo-MDSC using a BD FACS Aria flow cytometer (BD, Franklin Lakes, NJ).
Microarray analysis
HLA-DRneg/low Mo-MDSC and CD14+ HLA-DRhigh cells were isolated as described above. Approximately 10×106 flow-sorted control Mo-MDSC or CD14+ HLADRhigh were used for RNA isolation using a Qiagen RNA extraction kit (Qiagen, Germany). Gene expression analysis was performed using the Human gene 1.0 ST microarray (Affymetrix, Santa Clara, CA). RNA amplification and Microarray analysis were performed by the Case Western Reserve University Genomics Core. A cut-off of 1.5 fold changes were used for identifying overexpression for genes in Mo-MDSC compared to CD14+ HLA-DRhigh was applied. Microarray data were deposited in the GEO database and the accession number is TBD by journal. Remaining Mo-MDSC not used for the microarray were checked for immunosuppressive activity to confirm their ability to functionally suppress T cell activation (data not shown).
qPCR and primers
Total RNA was extracted from sorted CD14+ HLA-DRneg/low or CD14+ HLA-DRhigh monocytes using Trizol (Invitrogen)-chloroform method using standard protocols. RNA was reverse transcribed using the iScript cDNA synthesis kit (Bio-Rad) according to the manufacturer’s instructions. cDNA was amplified in the presence of specific primers (Life Technologies) with SYBR green supermix in a microtiter plate format on a BioRad CFX connect (BioRad). PCR experiments were performed in triplicate, with the following conditions: 2 min at 50 °C; 10 min at 95 °C; 40 cycles of 15 s at 95 °C; 1 min at 60 °C. Relative fold change was determined using the ΔΔCT method with beta actin as the endogenous control 28.
Flow cytometric analysis
Mo-MDSCs were purified from PBMCs using multiparameter FACS sorting. Antibodies used were: anti-human-CD14-APC (TuK4 clone) (Invitrogen, Carlsbad CA), anti-human-HLA-DR-FITC (clone G46–6) (BD Biosciences, San Jose, CA) and anti-human-HLA-DR-APC (L203 clone) (R&D Systems, Minneapolis, MN). Cells were stained for 30 min at 4°C. In addition to CD14 and HLA-DR, PE-conjugated mouse anti-human antibodies were employed to analyze: VNN2 (clone 3H9) (MBL, Woburn, MA), CD33 (clone 6C5/2) and CD11b (clone238446) (R&D Diagnostics) and CD15 (BD Biosciences). CD3 (clone UCHT1) and CD19 (clone HIB19) were FITC conjugated (BD Biosciences, San Jose, CA) and CD56-Alexa Fluor® 488 (clone B159) (BD Biosciences) was also used. Analysis of VNN2 expression on CD14+ magnetic bead isolated cells was performed using a 1:1000 dilution in 1×10⁵ cells of the VNN2-PE antibody and 2μl of a HLA-DR-FITC specific antibody (clone G46–6) (BD Biosciences, San Jose, CA). Flow cytometry was quantified with Winlist software V7.0 (Verity, Topsham, ME). Controls included isotype-matched and labelled anti-human antibodies.
Mo-MDSC expansion/activation
Flow-sorted Mo-MDSC (CD14+ HLA-DR(low/neg) or CD14+ HLA-DR+ cells were exposed to 100ng LPS/10ng INFγ or 10ng LPS/10ng INFγ overnight and the next day cells were stained with diluted (1:1000) amounts of VNN2 antibody as described previously. Cells were incubated 30’ and surface expression of VNN2 was analyzed using a C6 flow cytometer (BD Biosciences).
Suppression assay
Flow sorted and purified Mo-MDSC cells obtained as described above were used in the following assay. CD8 T cells isolated from PBMCs using magnetic anti-CD8 micro beads were used as the autologous target cells (Miltenyi Biotech). Either CD14+ VNN2+ monocytes or Mo-MDSCs were used as suppressor cells seeded at a 2:1 ratio in a 96-well round-bottom plate with e670 labeled CD8 cells (5μM, eBiosciences, San Diego, CA). Proliferation of CD8 T cells was initiated by bead stimulation (anti-CD2/CD3/CD28) at a 1:16 ratio (Miltenyi Biotech). Suppressive ability of Mo-MDSCs was quantified by flow cytometric analysis (BD C6 cytometer) following co-culture for six days at 37°C in 5% CO2. CD8 T cells alone plus stimulation beads were included as positive controls. CD8 T cells with medium only (data not shown) was included as well as labeled but un-stimulated CD8 cells as negative controls (data not shown).
Statistical analysis
Statistical significance was assessed by Student’s t test or non-parametric Mann-Whitney test when samples were not distributed normally. In these studies, where the volume of blood is limited, we are making the assumptions the samples in each group are independent and the 2 groups are normally distributed and have equal variances otherwise we analyzed utilizing non-parametric tests, such as chi-squared tests. In the case of the Figure 7, where there is low sample size, normality could not be determined however, the homogeneity of variance assumption is true due to the random sampling of data. Data were expressed as the mean ± SEM for normally distributed data and as median values for non-parametric tests when noted. Probability values of p≤0.05 were considered significant.
Figure 7. VNN2+ expression on CD14+ GBM monocytes is decreased compared to controls and VNN2 expression inversely correlates with glioma grade.
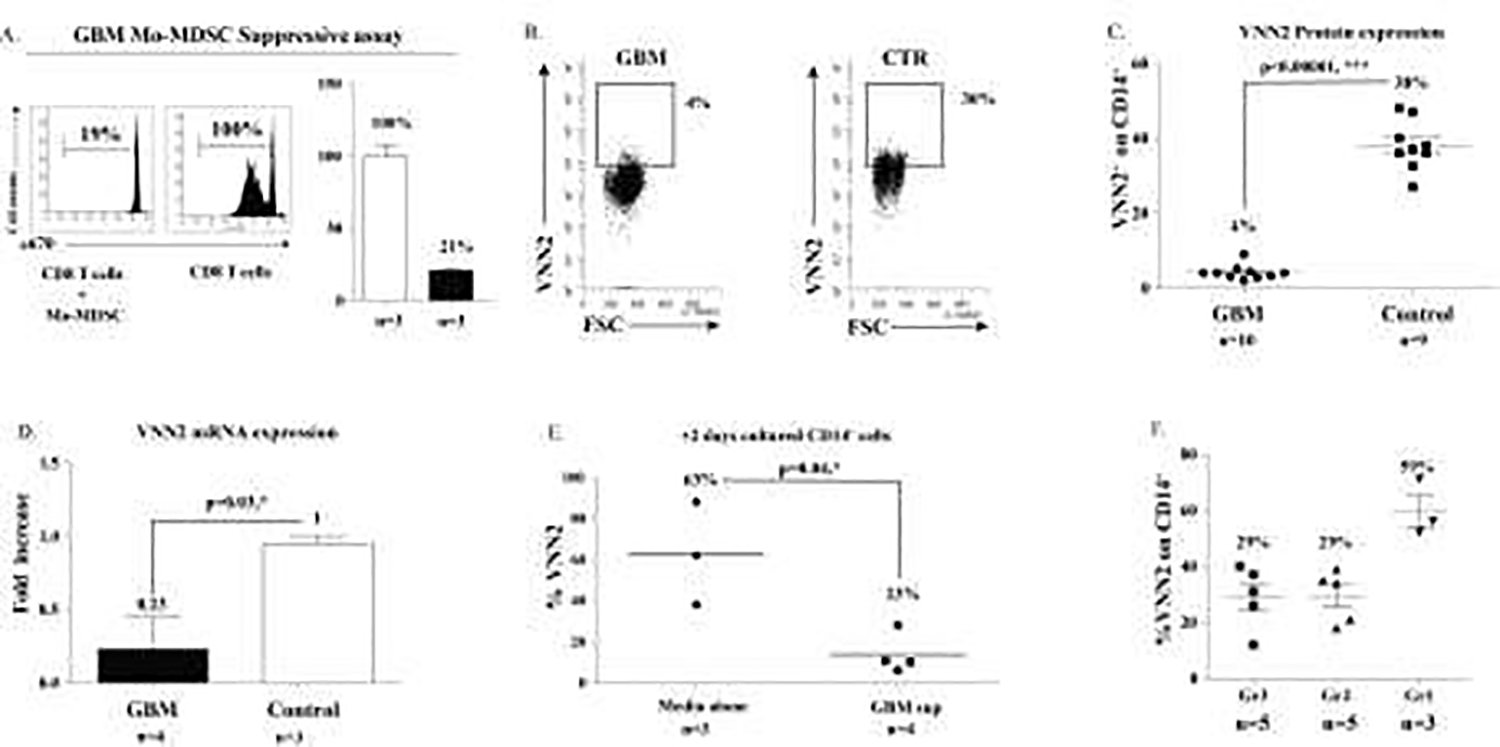
A. An in vitro assay shows GBM Mo-MDSC suppress division of human CD8 T cells. B & C) Expression of VNN2 on high-grade glioma CD14+ GBM monocytes is significantly reduced compared to healthy controls (4% vs 38%, p<0.00001; n=10 and n=9 respectively). D) Compared to healthy control Mo-MDSCs, mRNA expression of VNN2 from GBM patients is reduced (0.23 vs 1, p-<0.04; n=4 and n=3 respectively). E) VNN2 expression on CD14+ cells decreases as glioma grade increases. F) Exposure of healthy CD14+ VNN2+ cells to GBM supernatants decreases expression of VNN2 compared to untreated CD14+ VNN2+ cells (63% vs 23%, p<0.04; n=3 and n=4 respectively).
Results
Microarray analysis of healthy Mo-MDSC vs CD14+ HLA-DRhigh monocytes
CD14+ monocytes positively selected by magnetic bead separation from peripheral PBMCs were assessed by staining for CD14 versus isotype control and HLA-DR expression was determined using an anti-HLA-DR specific antibody (Figure 1A). CD14+ HLA-DRhigh and CD14+ HLA-DRneg/low (Mo-MDSC) cells were then selected using the top and bottom 10% of HLA-DR expression among CD14+ cells as the discriminator. These two populations were then sorted by flow cytometry and mRNA was extracted using a Qiagen RNA extraction kit. Microarray analysis was done using the Human gene 1.0 ST microarray (Affymetrix, Santa Clara, CA) and selected targets were confirmed by qPCR (Figure 1B).
Figure 1: mRNA Microarray analysis of Mo-MDSC.
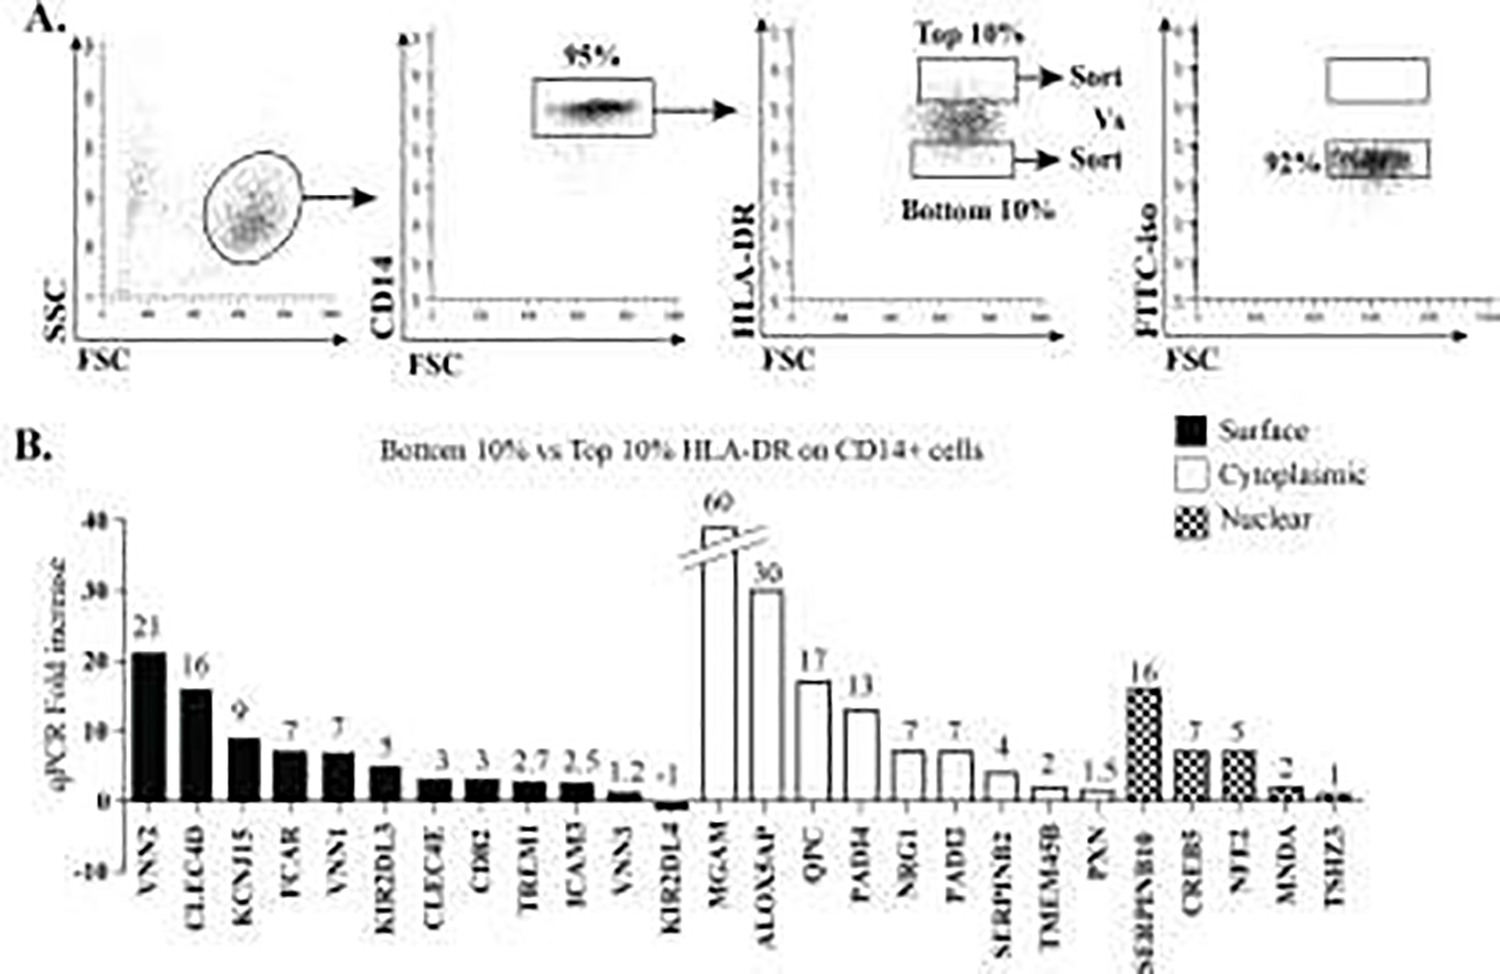
A) Flow cytometry shows the gating strategy for sorting cell populations that were isolated and used for mRNA generation and subsequent microarray analysis. B) qPCR for selected targets identified in microarray analysis (based upon likelihood of surface, intracellular and nuclear expression, as well as availability of antibodies) was performed to validate mRNA enrichment in Mo-MDSC versus CD14+ HLA-DR+.
Titration of VNN2 protein
After identifying vascular non-inflammatory molecule 2 (Vanin-2/VNN2/GPI-80) as a promising candidate that was increased in healthy Mo-MDSC versus CD14 HLA-DR+ cells, we performed serial dilutions compared to isotype controls (Figure 2A) in order to properly quantify VNN2 protein in CD14+ cells. As showing in Figure 2B, undiluted amounts of VNN2-PE antibody (either using 2uL or 1uL at 1mg/ml) stains healthy CD14+ 100%, and such amounts are not discriminatory between healthy subjects CD14+ or CD14+ from tumor patients (data not shown). However a 1:1000 dilution of VNN2 antibody in a staining volume of 200uL partially stains healthy subjects CD14+ cells and thus can be used as a discriminatory marker between healthy and tumor patients CD14+ VNN2+ cells29.
Figure 2. Titration of VNN2 antibody.
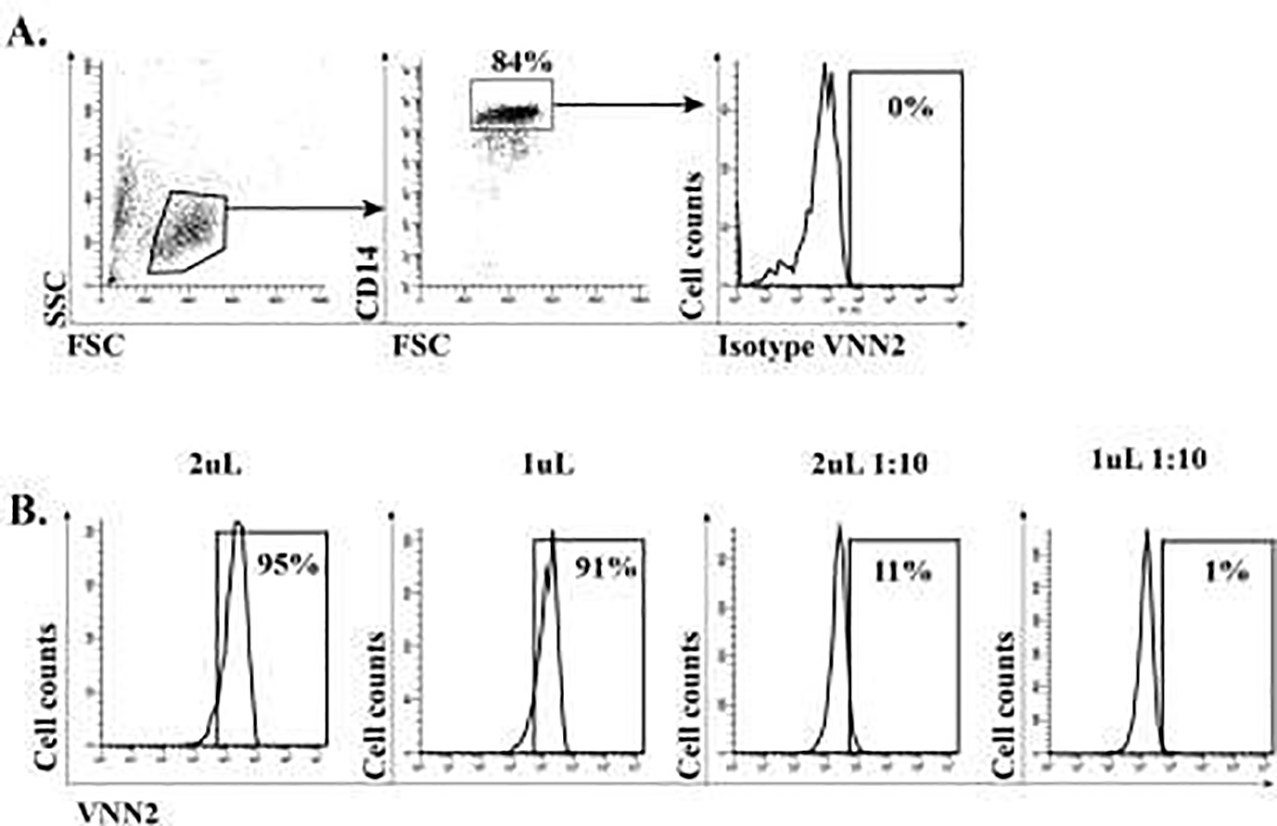
A) Titration of VNN2 protein using an isotype control antibody. B) Various dilutions were perform in order to identify the optimal sub-saturating amount of VNN2-PE antibody, since undiluted VNN2 stains CD14 cells virtually 100%. A 1:10 dilution (third panel from the left) produced the desired staining.
VNN2 expression is enhanced on monocytic MDSC compared to CD14+ HLA-DRhigh monocytes
The level of surface VNN2 on Mo-MDSC compared to CD14+ HLA-DRhigh monocytes was determined by flow cytometry. Titrated VNN2-PE antibody was used with 1 × 10⁵ bead-selected CD14+ monocytes. Surface expression of VNN2 was enriched on Mo-derived MDSC compared to CD14+ HLA-DRhigh cells based on isotype control (Figure 3A-representative data). Biological replicates (cumulative data) demonstrate a significant increase in VNN2 surface expression comparing Mo-MDSC to non-MDSC-CD14+HLA-DRhigh monocytes (Figure 3B, p<0.0004, n=4). HLA-DR expression among the top 10% of VNN2-expressing CD14+ cells (CD14+ VNN2high) versus the bottom 10% of VNN2-expressing (CD14+ VNN2low) cells was then analyzed. Figure 3C demonstrates, compared to isotype controls, among CD14+ VNN2high cells, only 13% expressed HLA-DR above isotype, whereas CD14+ VNN2low cells expressed HLA-DR staining at 79% above isotype levels. Among CD14+ cells (cumulative data), HLA-DR expression shows that the top 10% of cells expressing VNN2 had lower levels of HLA-DR expression (34 ± 6.8%) than the bottom 10% of VNN2-expressing cells which contained the majority of HLA-DR expressing cells (70 ± 1.5%) (Figure 3D, n=4). Although a distinct population of VNN2+ HLA-DRneg/low cells is not present (Figure 3E); cells with relative decreased expression of VVN2 appear to express increased levels of HLA-DR.
Figure 3. Monocytic-MDSCs expressing CD14+ HLA-DRneg/low also express high levels of surface VNN2.
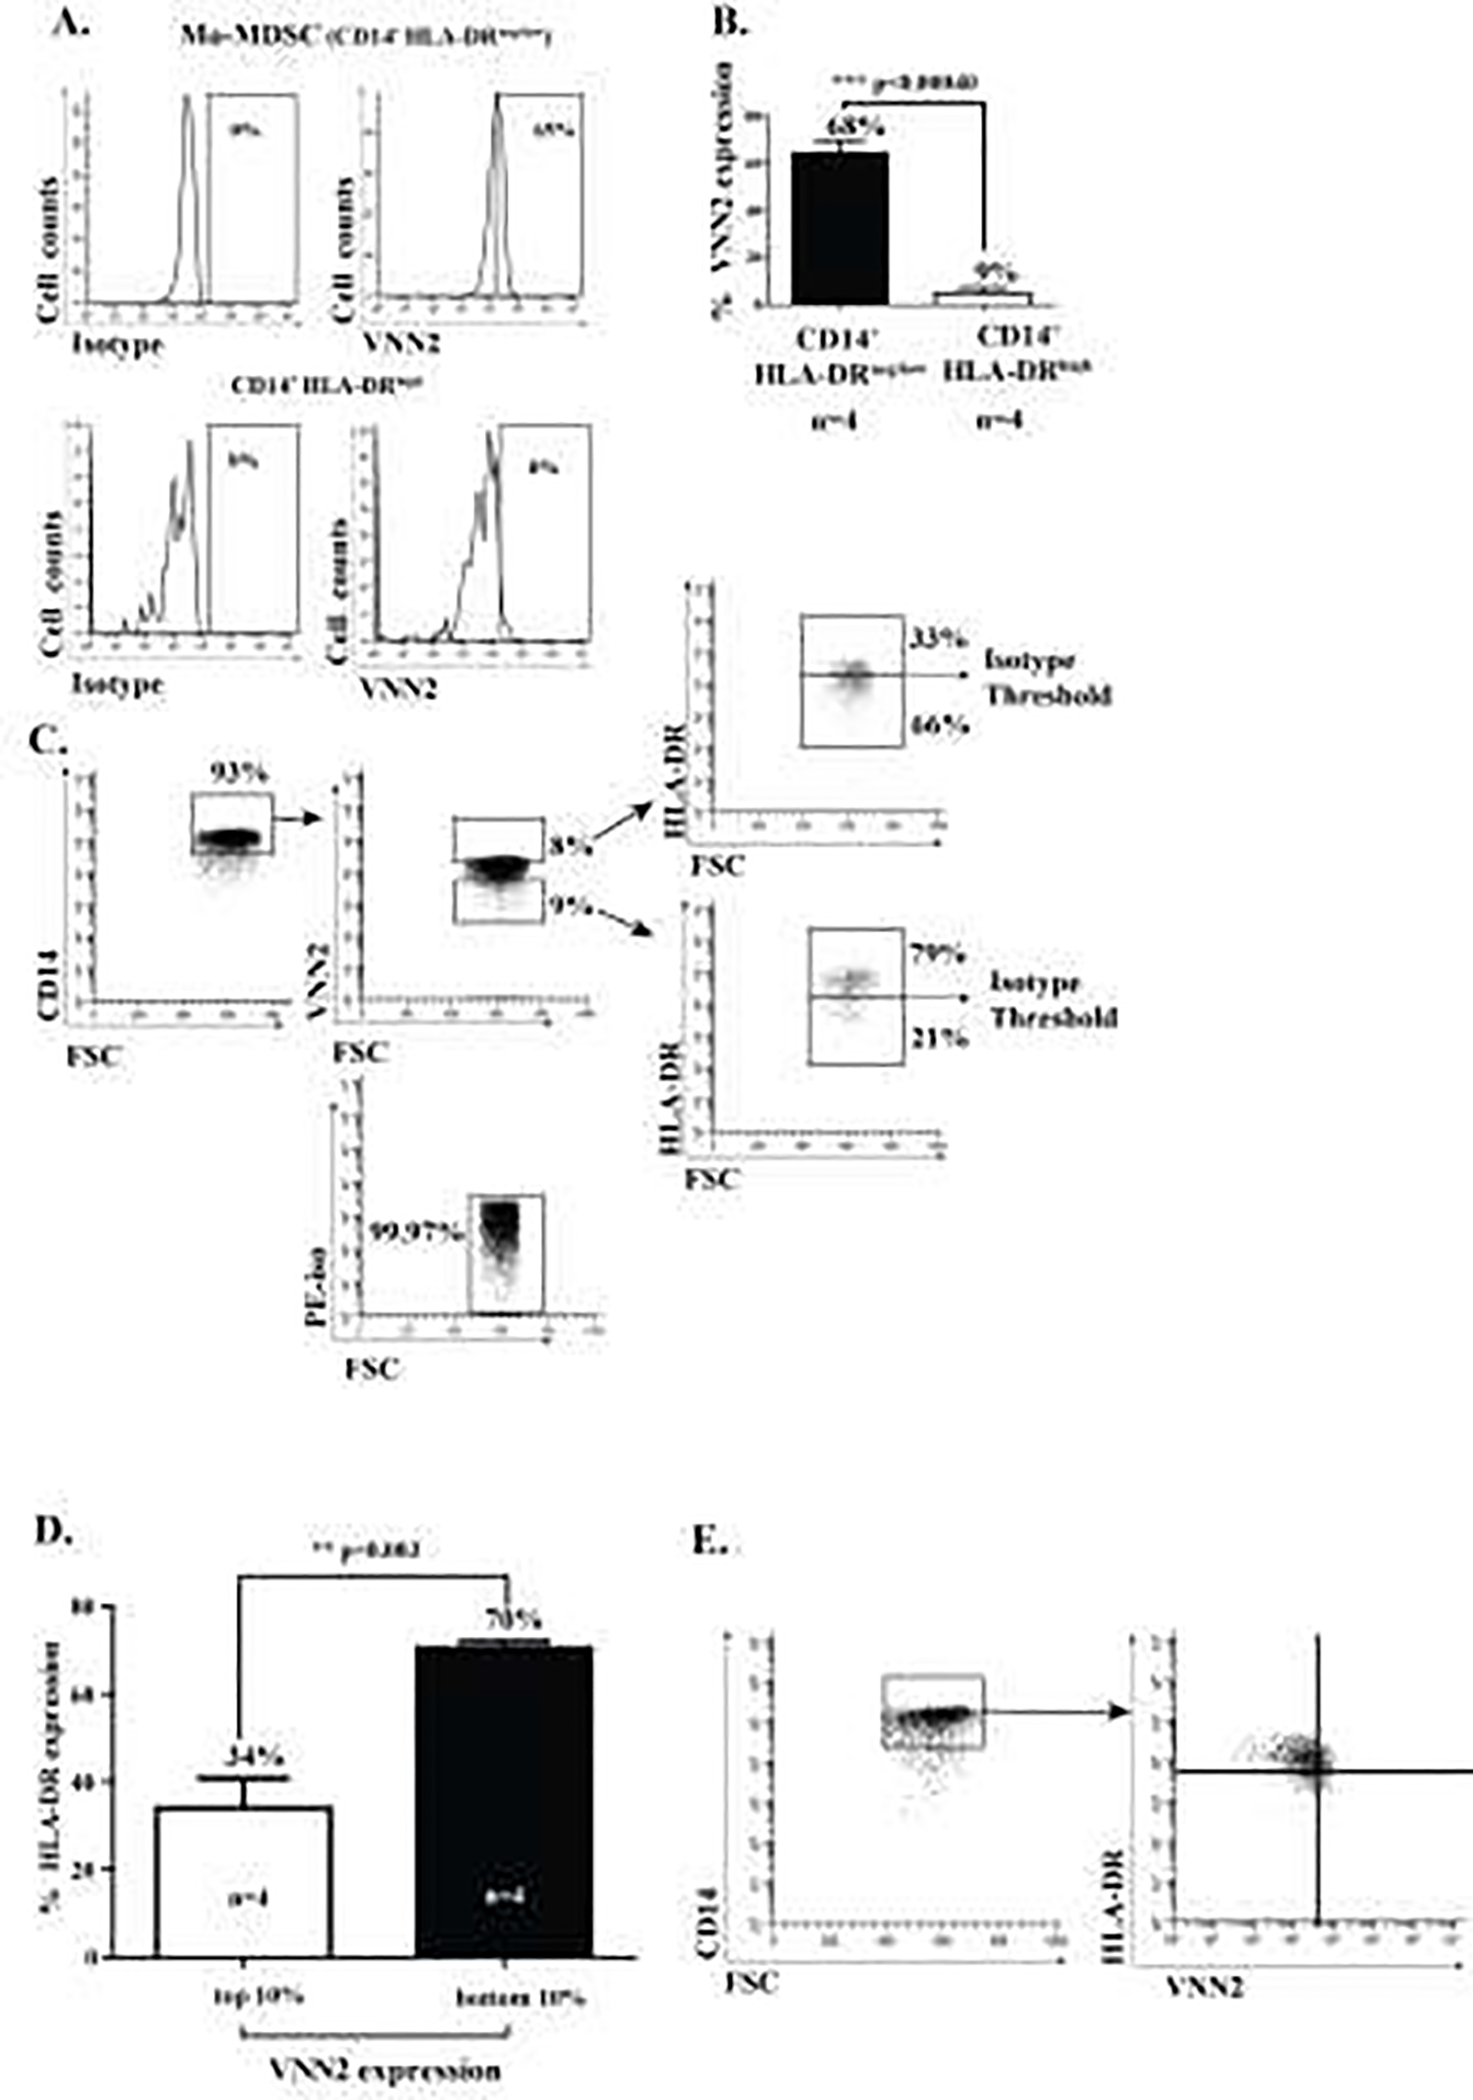
A) A representative flow cytometry diagram demonstrating 65% VNN2 expression on Mo-MDSCs compared to 8% expression on CD14+ HLA-DRhigh cells (top 10%), relative to their respective isotype controls. B) VNN2 protein expression on Mo-MDSC compared to CD14+ HLA-DRhigh cells (68% vs. 9%, n=4 each, p<0.0004). C) Characteristic cytometry plot demonstrating (CD14+)VNN2high cells express relatively little HLA-DR compared to HLA-DR expression among (CD14+) VNN2low cells. D) Mean HLA-DR expression among the top (10%)-expressing VNN2 cells versus the bottom (10%) of VNN2-expressing cells. E) Representative individual scatter grams of VNN2 and HLA-DR on CD14+ monocytes.
CD14+ VNN2high express CD11b+ CD33+ and are negative for CD3neg CD15neg CD19neg and CD56neg
All positively selected CD14+ cells expressed CD33 and CD11b, but not CD15 (Figure 4A). CD14+ VNN2high cells were negative for both CD19 and CD3, and expressed very low levels of CD56 (13%) (Figure 4B), consistent with what has been previously reported regarding human Mo-MDSC markers15. CD14+ HLA-DRneg/low Mo-MDSC lack expression of CD19, CD56 and CD3 (Figure 4C, representative data shown).
Figure 4: CD14+ VNN2high cells do not express markers for T cells, NK-cells and B-cells.
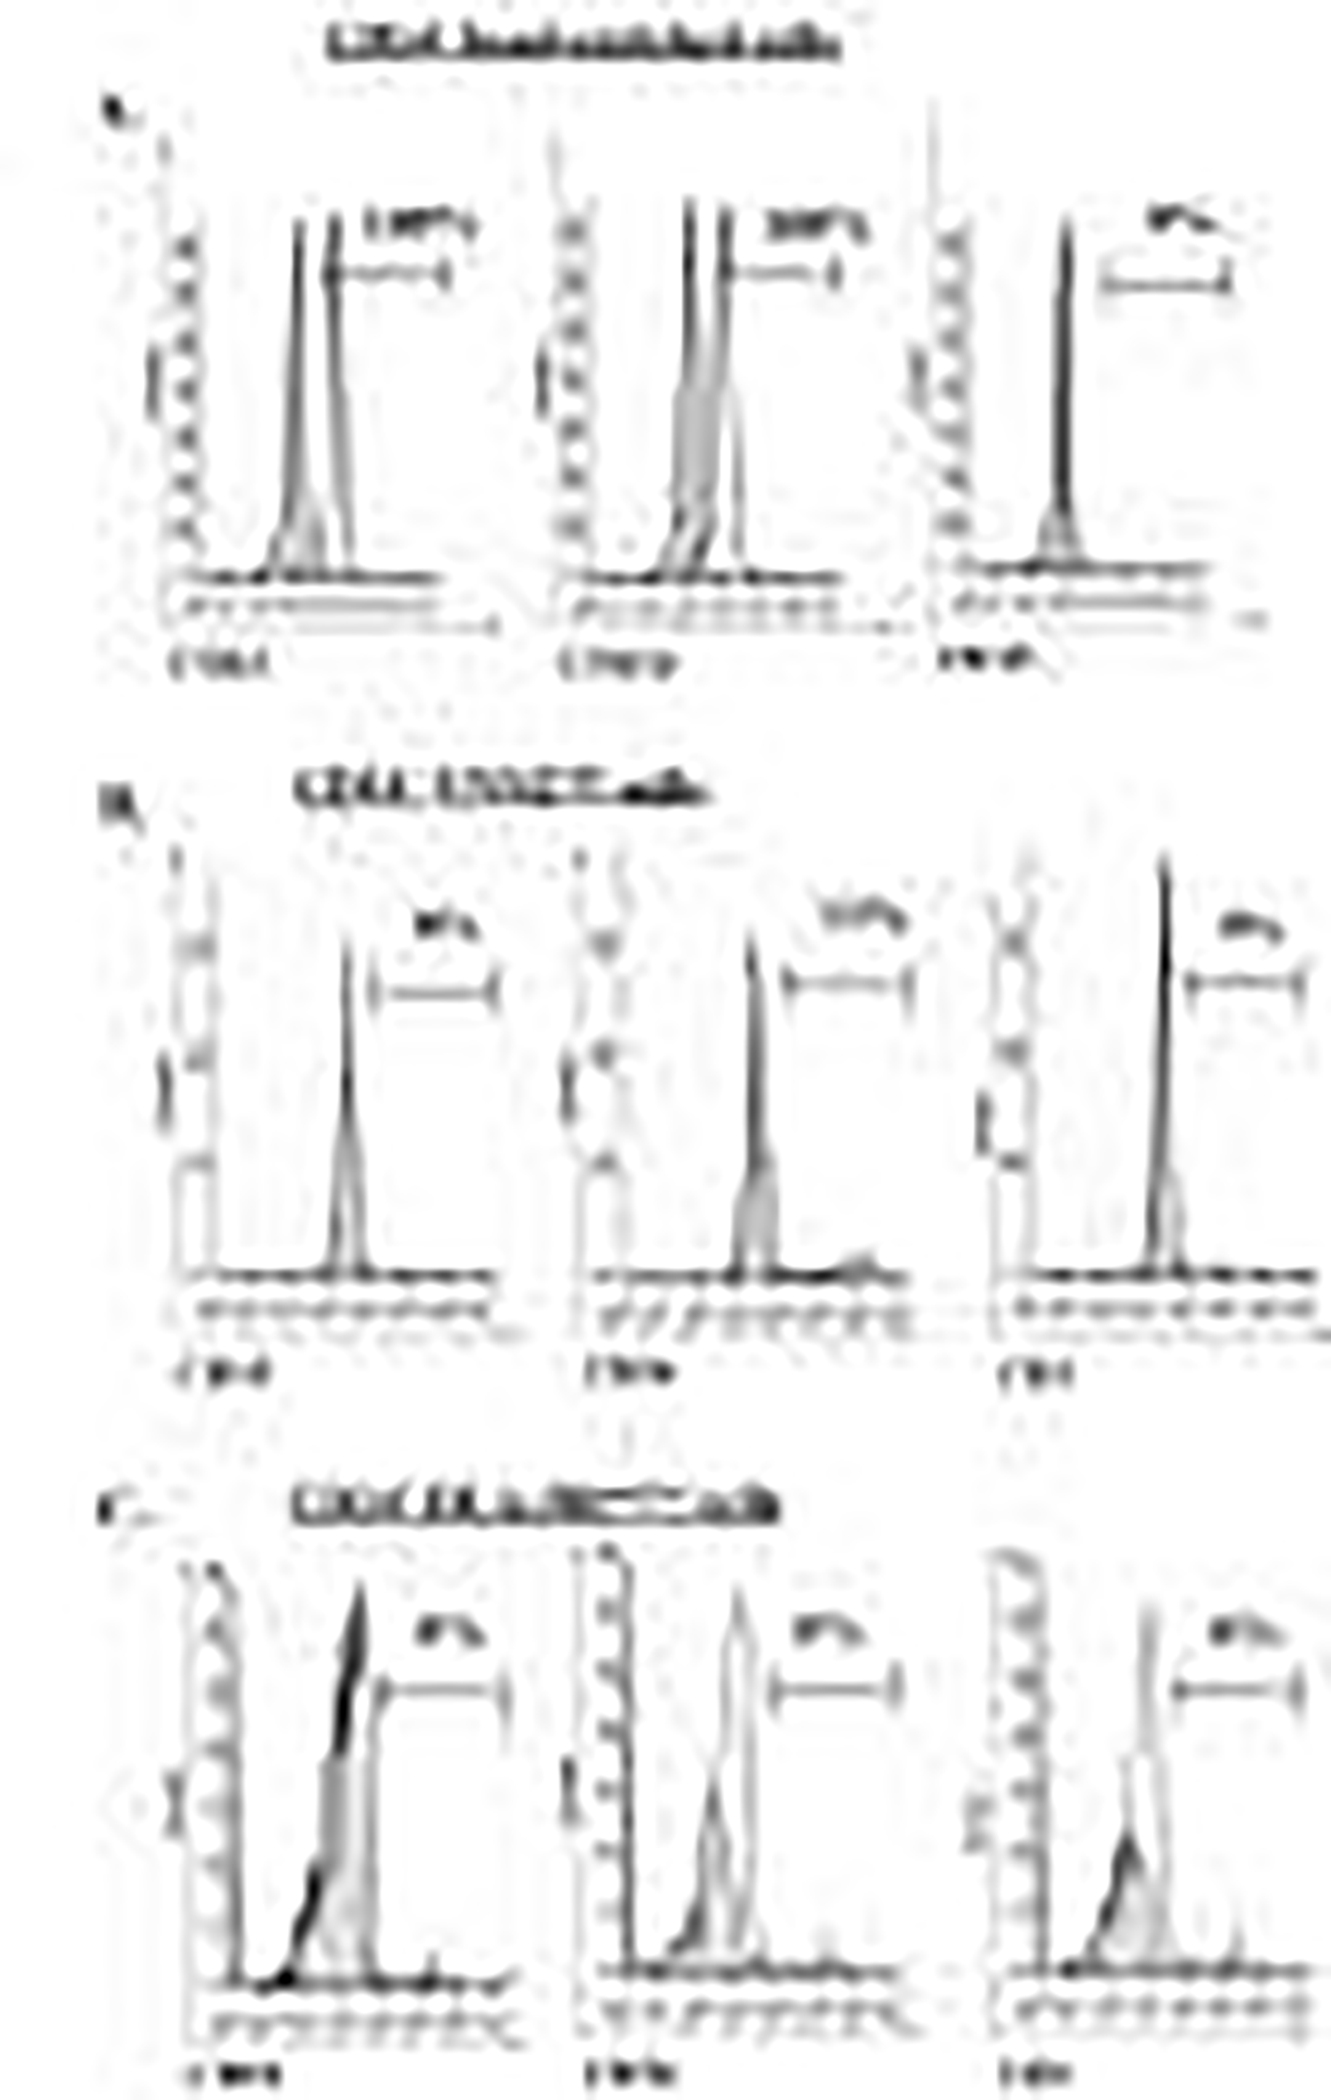
A) One hundred percent of magnetically bead-enriched CD14+ cells expressed CD33 and CD11b, although they were negative for CD15. B) The subset of CD14+ VNN2high cells did not express any CD19 or CD3, but did express very low levels of CD56 (13%). C) Expression of CD19, CD56 and CD3 on CD14+ HLA-DRneg/low Mo-MDSC was negative for all markers examined. Open peaks represents positive staining, grey filled-in peaks shows represent isotype controls. In some figures both peaks are almost superimposed due to nature of staining.
Mo-MDSC exposed to INF-α and LPS Lose expression of VNN2
We then exposed freshly flow-sorted Mo-MDSC from healthy subjects to a combination of INF-α and LPS in order to expand/activate as described in the literature30. We stained treated and untreated Mo-MDSC with VNN2-PE and found out that expanded/activated Mo-MDSC is accompanied by an INF-α and LPS-dose-dependent down-regulation of VNN2 expression (Figure 5A). Surface VNN2 in flow-sorted CD14+ HLA-DR+ cells were used as negative controls (Figure 5B).
Figure 5. Surface VNN2 expression decreases in expanded/activated Mo-MDSC.
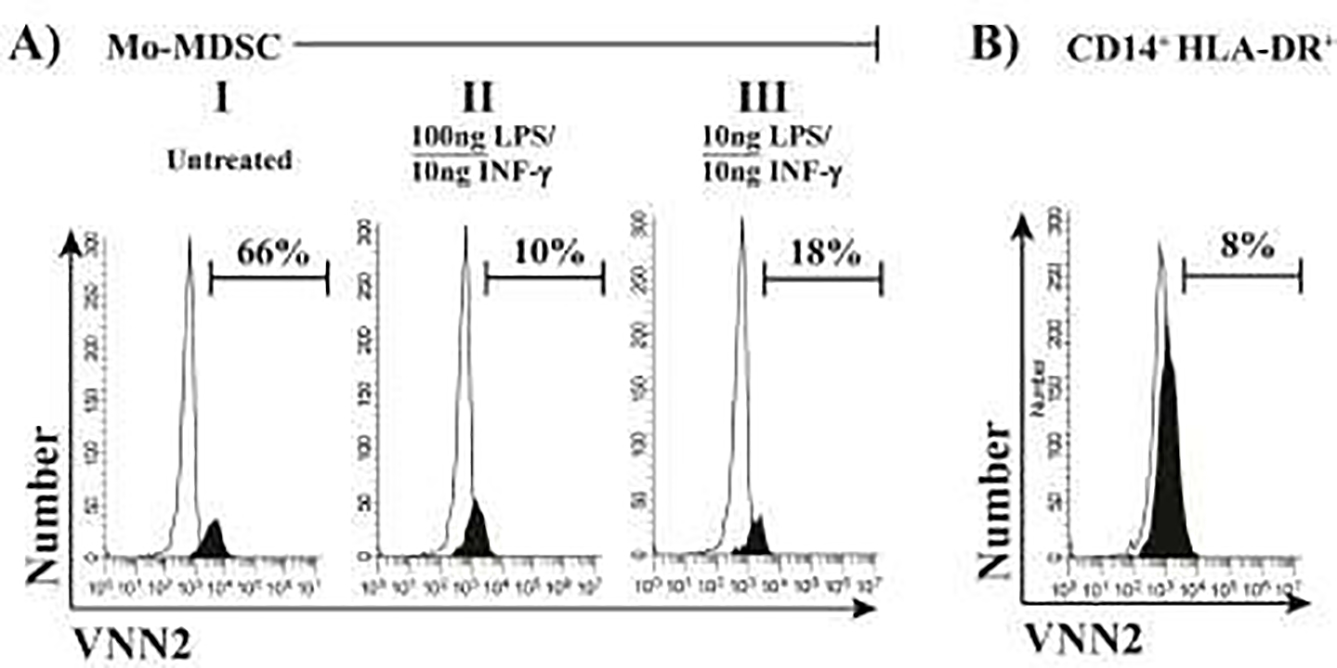
A) Different amounts of INF-γ/LPS were used to expand/activate flow-sorted healthy Mo-MDSC suppression within 24h. Concomitant staining by VNN2-PE showed a slight dose-dependent reduction of expression inversely proportional to INF-γ /LPS amounts. B) Paralleled flow-sorted healthy CD14+ HLA-DR+ cells showed consistent low expression of surface VNN2. Black peaks represents positive staining, white peaks shows isotype controls.
CD14+VNN2high monocytes are comparable to traditional CD14+ HLA-DRneg/low Mo-MDSC in from healthy subjects in CD8 T cell suppression assays
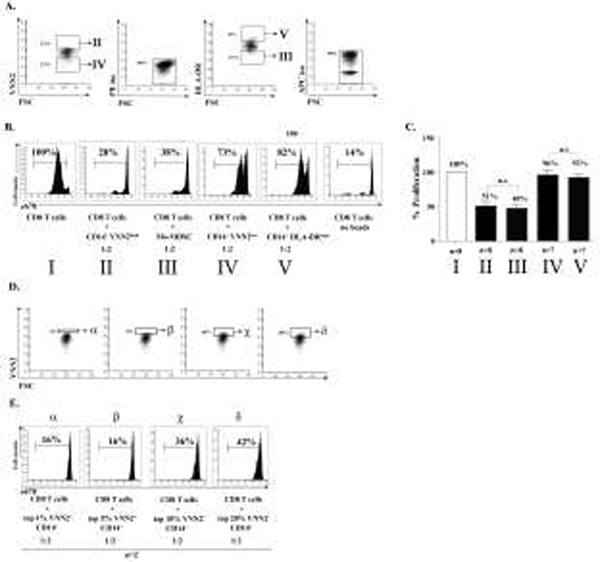
To demonstrate the identity and functional suppressive capacity of Mo-MDSC we performed an in vitro suppressive assay as the ultimate determinant in order to define these CD14+ HLA-DRneg/low cells as Mo-MDSC 1,3–5,7,16,31,32. CD14+VNN2high cells from healthy subjects were stained for VNN2 using 4μl of the undiluted stock VNN2-PE antibody (0.01μg/μl) per 5 × 10⁶ cells, then sorted and mixed with CD8 cells that had been previously labeled with e670 (eBiosciences, San Diego, CA) at a 2:1 ratio in a 96-well round-bottom plate. Cells were then stimulated using beads (anti-CD2/CD3/CD28) at a 1:16 ratio (Miltenyi Biotech). The suppressive capacity of VNN2high Mo-MDSC from healthy subjects was quantified by flow cytometry after six days of co-culture at 37°C in 5% CO2 at 37°C. CD14+VNN2high cells (Figure 6A, B, panel I) effectively suppressed proliferating CD8 T cells in a quantitative manner equal to traditional Mo-MDSC (CD14+ HLA-DRneg/low) (Figure 6A, B, panel II). However, CD14+VNN2low cells or CD14+ HLA-DRhigh monocytes were unable to suppress CD8 T cell proliferation effectively (Figure 6A, B, panels III and IV, respectively). The suppressive capacity of CD14+ VNN2high cells mirrored traditionally sorted Mo-MDSC as demonstrated by the cumulative data (Figure 6C, p>0.05, n=8, panels I and II vs. normalized CD8 proliferation). No significant difference in suppression was noted between CD14+ VNN2low cells and CD14+ HLA-DRhigh monocytes (Figure 6C, p>0.05, n=8, panels III and IV vs. normalized CD8 proliferation). Note however that the proliferation of stimulated e670 labeled CD8 was approximately 50% among T cells mixed with either CD14+VVN2high or Mo-MDSC, whereas the percent proliferation of stimulated CD8 cells mixed with either CD14+VNN2low or CD14+HLA-DRhigh was between 92 and 96% respectively, demonstrating the lack of suppression among CD14+VNN2low or CD14+HLA-DRhigh cells. To more closely define the suppressive capacity of VNN2+ CD14+ cells, we sorted CD14+ monocytes stained for VNN2 into 4 groups, top 1%, top 5%, top 10% and top 20% of VNN2 expressing cells as shown in Figure 6D. These sorted monocytes were then used in a functional suppression assay as described above. To demonstrate the suppressive capacity associated with the expression of VNN-2, we performed experiments demonstrating that suppressive capacity was maximal when only the top 1–5% of CD14+ cells expressing VNN2 were included in the suppression assay (Figure 6D alpha, beta sections and E, alpha, beta pannels). Adding more cells with lower VNN2 expression decreased the suppressive capacity in the functional assay. (Figure 6E delta pannel, n=2).
Figure 6. The suppressive capacity of CD14+ VNN2high cells on activated CD8 T cells was comparable to traditional (CD14+ HLA-DRneg/low) MDSC.
A) Representative functional suppression assay showing selected cell populations from CD14+ magnetically selected PBMCs. B) Panel I) and II) show suppression of proliferating CD2/CD3/CD28-stimulated, e670 labeled CD8 T cells by CD14+ VNN2high cells (panel I) is nearly equivalent to Mo-MDSC (panel II). Panels III) and IV) show the suppressive capacity of either CD14+ VNN2low or CD14+ HLA-DRhigh in mixed culture with stimulated CD8 T cells, respectively. C) Cumulative data for suppression assays based upon normalization to maximally stimulated CD8 T cell proliferation (n=8). D) Representative histogram demonstrating the selection of VNN2-expressing CD14+ cells. E) Percent suppression of selected subsets of VNN2 expressing cells used in a functional suppression assay with anti-CD2/CD3/CD28 bead stimulation of CD8 T cells at a 1:2 ratio of VNN2+ cells to CD8 T cells (n=2 represent two independent experiments from different batches of cells).
VNN2 in CD14+ cells decreases in Glioblastoma patients compared to healthy controls and is inversely correlated with glioma grade.
Using flow cytometry, we analyzed the presence of VNN2 on CD14+ monocytes from Glioblastoma (GBM) patients. We performed a suppressive assay using Mo-MDSC isolated from GBM patients to confirm their suppressive potential (Figure 7A). Then we demonstrated CD14+ VNN2+ expression on monocytes comparing GBM and healthy control volunteers, based on isotype control (4% vs 30%), shown in Figure 7B. Further, we validate in Figure 7C that GBM patients have decreased VNN2 expression on CD14+ cells compared to controls (average of 4% vs 38%, p<0.00004). The confirmed expression of HLA-DR on these cells agreed with what was shown previously29. mRNA was extracted from flow-purified Mo-MDSC from GBM and healthy subjects. RT-PCR was performed and as shown in Figure 7D, VNN2 mRNA was found to be decreased in Mo-MDSC in GBM patients compared to those in healthy (control) subjects (0.23 vs 1, p<0.03). Interestingly, exposure of healthy control subject CD14+ VNN2+ cells to supernatants from GBM tumor cells for 48h lead to a significant decrease of VNN2 compared to media-alone exposed CD14+ VNN2+ cells (63% vs 23%, p=0.04), Figure 7E. The expression of VNN2+ on CD14+ monocytes decreased as the glioma grade increased from benign Gr1 astroyctomas to intermediate grades Gr 2–3, Figure 7F.
Discussion
A major hurdle in identification of myeloid-derived suppressor cells (MDSC) has been the lack of positive markers used to identify and isolate these cells. Indeed, the “gold standard” to determine if a cell should be classified as an MDSC is what they do not express. Thus, although MDSCs have been defined as cells expressing CD33 and CD11b, these markers are also present on other myeloid cells. However, expression of CD33 and CD11b, combined with a decreased (low) expression of HLA-DR is more likely considered an MDSC per se. However, even with these markers, MDSCs ultimately have been defined using in vitro suppression assays to demonstrate the functional suppression of these cells. Using these standards, several investigators have further described MDSC subsets (monocytic vs. granulocytic) as well as related classification markers including expression of (e.g., CD14, CD56, CD33, lin, CD15, CD11b, CD133, etc…) for review 3. Using microarray analysis, we identified the mRNA of surface protein VNN2 as being highly-enriched in healthy Mo-MDSC but not CD14+ HLA-DRhigh monocytes. Upon review of myeloid cell markers, we noted that previously a CD14+ monocyte subset that exhibited decreased antigen presenting capacity, increased phagocytosis and reactive oxygen species (ROS) production (ROS) as well as increased expression of CD11b, CD32 and CD64 had been previously described 23, although at the time of this publication, the classification of MDSC was not known. Thus, we sought to further determine whether or not VNN2 expression levels may mark the suppressive MDSC population and serve as a potential positive marker for MDSCs.
To address this question, we conducted a series of experiments to isolate and functionally test the suppressive capacity of CD15neg CD14+ VNN2-expressing (CD14+VNN2high) cells in healthy subjects. Indeed, we demonstrate here that CD14+ VNN2high cells phenocopy and function akin to CD14+ HLA-DRneg/low monocytic MDSC (Mo-MDSC) isolated from healthy subjects, including the ability to suppress CD8 T cell proliferation and typical Mo-MDSC surface marker expression. We further demonstrated that CD14+VNN2high cells could be positively selected by flow cytometry sorting and used in functional suppression assays. Expression of VNN2 on CD14+ cells showed that VNN2 expression was not an “all or none” expression pattern, but rather it was a gradient of expression. At this point we want to stress that titration of the VNN2 antibody is a critical step in order to replicate our observations. Undiluted amounts of VNN2 antibody stain ~95% CD14+ cells (Figure 2B) and thus preclude any insightful characterization of VNN2 expression within the CD14+ cell population. However, a careful titration of VNN2 reveals that in healthy subjects CD14+ HLA-DRneg/low cells display enriched levels of VNN2. This titration is also essential in order to quantify VNN2 expression in CD14+ cells of glioma patients (Figure 7B, C and E). We also decided to use percent expression instead of median fluorescent intensity (MFI) of VNN2+ CD14+ cells (data not shown) because MFI on different samples cannot be compared when using different flow sorters that use variable laser intensities. Instead, percentages can remain the same across different platforms allowing easy comparison.
To more closely define the functional suppressive capacity of the VNN2 expressing cells, we sorted the top 1, 5, 10 and 20% VNN2 expressing cells and the bottom 10 % of VNN2-expressing cells and compared these populations using functional assays. Suppressive capacity diminished when cells expressing less VNN2 were included in the suppressive assays compared to the top 1–5% of VNN2-expressing CD14+ monocytes. However, at this point, we want to stress that CD14+VNN2high cells are equivalent to Mo-MDSC only in healthy subjects, since VNN2 expression in monocytes is inversely correlated to tumor grade in brain malignancies and thus, in tumor patients CD14+ VNN2+ cells diminish (Fig 7A, B and D).
Mechanistic inhibition of VNN2 was not tested in the current experiments and therefore we cannot conclude that VNN2 expression is necessary for MDSC suppressive capacity. However, the ability to block VNN2 activity or removal of VNN2high cells may lead to new avenues of therapy for reversing MDSC function and restoring immune surveillance. Indeed, given the reported enzymatic function of VNN2 (ectoenzyme that specifically hydrolyzes the carboamide linkages in D-pantetheine, recycles pantothenic acid-vitamin B5- and releases cysteamine) to act as an amidohydrolase and the implicated function of Vanin family proteins to direct thymic homing of bone marrow cells33, it is possible that expression of VNN2 may retain the Mo-MDSC population in a non-differentiated form that more closely resembles a progenitor cell as VNN2 expression has recently been linked to the ability of hematopoietic stem cells to renew 26. Using surface VNN2 expression for selection and potential therapeutic opportunities may be enhanced due to the GPI anchor structure of the molecule, suggesting that targeting this molecule with antibody therapy is unlikely to induce conformational changes in protein expression since it is stabilized in the cell membrane 22.
Exposure of healthy Mo-MDSC to LPS/INFγ lead to a decrease in VNN2 expression (Figure 5A), suggesting activated/expanded Mo-MDSC lose VNN2 expression. We also found that VNN2 expression in CD14+ monocytes is significantly decreased in high-grade gliomas such as GBM, compared to healthy subjects (Figure 5A, B and C). This result was surprising to us, since it suggests high-grade gliomas such as GBM might modulate the expression of VNN2. Indeed as shown in Figure 7E, in vitro exposure of healthy CD14+ VNN2+ cells to GBM tumor cell supernatants induced a significant decrease of VNN2 expression compared to untreated healthy CD14+ VNN2+ cells after just two days of culture.
VNN2 expression on CD14+ cells appeared to be inversely correlated with glioma grades, with benign Gr1 gliomas containing the highest expression of VNN2 on CD14+ cells, and malignant gliomas including both intermediate Gr2–3 and high grade gliomas (GBMs, Grade IV gliomas) the lowest (Figure 7B and F). Given these results, at this point, we would like to speculate whether VNN2 expression on Mo-MDSC could act as a “molecular circuit breaker” for reining in Mo-MDSC’s immunosuppressive capabilities. Within this scenario, medium expression levels of VNN2 as seen on healthy Mo-MDSC keep their suppressive functions in check (Figure 7B, controls), while a gradual decrease of VNN2 progressively (Figure 7B GBM and 7E) may unleash the high immunosuppressive Mo-MDSC capabilities seen in malignant tumors. As an extension for this reasoning, in non-malignant chronic inflammatory conditions such as psoriasis10,13,34, very high levels of VNN2 might abolish Mo-MDSC suppressive functions. Interestingly, when cell supernatants from GBM tumors were added to CD14+ monocytes (Figure 7E), we observed that VNN2 expression was decreased compared to untreated control monocytes.
Identification of a potential surface marker specific for healthy Mo-MDSC in healthy subjects may be beneficial in several areas. First, the potential to positively select healthy Mo-MDSC may improve in situ identification of MDSC subpopulations. Second, diagnostic testing dependent on the relative amount of circulating MDSCs may be enhanced and streamlined using this marker rather than a negative selection approach. Third, adding VNN2 to the arsenal of MDSC markers may allow for more detailed separation of these populations and enhanced specificity between healthy and diseased patients, and the apparent differences in VNN2 expression levels between healthy controls and cancer patients may become a useful diagnostic marker29. However, follow-up studies designed to address the function of this enzyme may be difficult as no homologous VNN2 protein expression has been reported in mice (Dr. P. Naquet, personal communication). Finally, if VNN2 expression is necessary for reining in healthy Mo-MDSC function, the ability to interfere with this target may result in viable therapeutic opportunities for diseases where MDSC function is aberrant.
Highlights.
Several novel surface proteins were identified in monocytic MDSC from healthy patients
Monocytic MDSC present in healthy patients express high levels of the surface VNN2 ectoenzyme
VNN2 levels decrease in monocytic MDSC present in high-grade glioma patients
VNN2 might work as a circuit breaker to rein in monocytic MDSC immunosuppressive functions
Funding sources:
P50AR055508 (KDC)
R01AR051498 (KDC)
P30AR039750 (KDC)
AES was supported by the Peter D. Cristal Foundation and the UH Center of Excellence in Translational Neuro-Oncology (CETNO).
DCS and AES were supported in part by the Kimble Family Foundation, the Ferry Family Foundation
Footnotes
Publisher's Disclaimer: This is a PDF file of an unedited manuscript that has been accepted for publication. As a service to our customers we are providing this early version of the manuscript. The manuscript will undergo copyediting, typesetting, and review of the resulting proof before it is published in its final form. Please note that during the production process errors may be discovered which could affect the content, and all legal disclaimers that apply to the journal pertain.
References
- 1.Gabrilovich DI, Nagaraj S. Myeloid-derived suppressor cells as regulators of the immune system. Nat Rev Immunol. 2009;9(3):162–174. [DOI] [PMC free article] [PubMed] [Google Scholar]
- 2.Tacke RS, Lee HC, Goh C, et al. Myeloid suppressor cells induced by hepatitis C virus suppress T-cell responses through the production of reactive oxygen species. Hepatology. 2012;55(2):343–353. [DOI] [PMC free article] [PubMed] [Google Scholar]
- 3.Talmadge JE, Gabrilovich DI. History of myeloid-derived suppressor cells. Nat Rev Cancer. 2013;13(10):739–752. [DOI] [PMC free article] [PubMed] [Google Scholar]
- 4.Falck-Jones S, Vangeti S, Yu M, et al. Functional monocytic myeloid-derived suppressor cells increase in blood but not airways and predict COVID-19 severity. J.Clin.Invest. 2021;131(6). [DOI] [PMC free article] [PubMed] [Google Scholar]
- 5.Sacchi A, Grassi G, Bordoni V, et al. Early expansion of myeloid-derived suppressor cells inhibits SARS-CoV-2 specific T-cell response and may predict fatal COVID-19 outcome. Cell Death Dis. 2020;11(10):921. [DOI] [PMC free article] [PubMed] [Google Scholar]
- 6.Veglia F, Perego M, Gabrilovich D. Myeloid-derived suppressor cells coming of age. Nat Immunol. 2018;19(2):108–119. [DOI] [PMC free article] [PubMed] [Google Scholar]
- 7.Solito S, Falisi E, Diaz-Montero CM, et al. A human promyelocytic-like population is responsible for the immune suppression mediated by myeloid-derived suppressor cells. Blood. 2011;118(8):2254–2265. [DOI] [PMC free article] [PubMed] [Google Scholar]
- 8.Nagaraj S, Gabrilovich DI. Myeloid-derived suppressor cells in human cancer. Cancer journal. 2010;16(4):348–353. [DOI] [PubMed] [Google Scholar]
- 9.Cassetta L, Bruderek K, Skrzeczynska-Moncznik J, et al. Differential expansion of circulating human MDSC subsets in patients with cancer, infection and inflammation. J Immunother Cancer. 2020;8(2). [DOI] [PMC free article] [PubMed] [Google Scholar]
- 10.Ilkovitch D, Ferris LK. Myeloid-derived suppressor cells are elevated in patients with psoriasis and produce various molecules. Mol Med Rep. 2016;14(4):3935–3940. [DOI] [PMC free article] [PubMed] [Google Scholar]
- 11.Apodaca MC, Wright AE, Riggins AM, et al. Characterization of a whole blood assay for quantifying myeloid-derived suppressor cells. J Immunother Cancer. 2019;7(1):230. [DOI] [PMC free article] [PubMed] [Google Scholar]
- 12.Soler DC, Young AB, Fiessinger L, et al. Increased, but functionally impaired, CD14 HLA-DR Myeloid-Derived Suppressor Cells in psoriasis; a mechanism of dysregulated T cells. J Invest Dermatol. 2016. [DOI] [PubMed] [Google Scholar]
- 13.Cao LY, Chung JS, Teshima T, et al. Myeloid-Derived Suppressor Cells in Psoriasis Are an Expanded Population Exhibiting Diverse T-Cell-Suppressor Mechanisms. J Invest Dermatol. 2016;136(9):1801–1810. [DOI] [PMC free article] [PubMed] [Google Scholar]
- 14.Zhao F, Hoechst B, Duffy A, et al. S100A9 a new marker for monocytic human myeloid-derived suppressor cells. Immunology. 2012;136(2):176–183. [DOI] [PMC free article] [PubMed] [Google Scholar]
- 15.Gabrilovich DI, Bronte V, Chen SH, et al. The terminology issue for myeloid-derived suppressor cells. Cancer Res. 2007;67(1):425; author reply 426. [DOI] [PMC free article] [PubMed] [Google Scholar]
- 16.Nagaraj S, Gabrilovich DI. Regulation of suppressive function of myeloid-derived suppressor cells by CD4+ T cells. Seminars in cancer biology. 2012;22(4):282–288. [DOI] [PMC free article] [PubMed] [Google Scholar]
- 17.Nagaraj S, Youn JI, Gabrilovich DI. Reciprocal relationship between myeloid-derived suppressor cells and T cells. J Immunol. 2013;191(1):17–23. [DOI] [PMC free article] [PubMed] [Google Scholar]
- 18.Clements DR, Sterea AM, Kim Y, et al. Newly recruited CD11b+, GR-1+, Ly6C(high) myeloid cells augment tumor-associated immunosuppression immediately following the therapeutic administration of oncolytic reovirus. J Immunol. 2015;194(9):4397–4412. [DOI] [PubMed] [Google Scholar]
- 19.Hochst B, Mikulec J, Baccega T, et al. Differential induction of Ly6G and Ly6C positive myeloid derived suppressor cells in chronic kidney and liver inflammation and fibrosis. PLoS One. 2015;10(3):e0119662. [DOI] [PMC free article] [PubMed] [Google Scholar]
- 20.Kallberg E, Stenstrom M, Liberg D, Ivars F, Leanderson T. CD11b+Ly6C++Ly6G-cells show distinct function in mice with chronic inflammation or tumor burden. BMC immunology. 2012;13:69. [DOI] [PMC free article] [PubMed] [Google Scholar]
- 21.Youn JI, Nagaraj S, Collazo M, Gabrilovich DI. Subsets of myeloid-derived suppressor cells in tumor-bearing mice. J Immunol. 2008;181(8):5791–5802. [DOI] [PMC free article] [PubMed] [Google Scholar]
- 22.Suzuki K, Watanabe T, Sakurai S, et al. A novel glycosylphosphatidyl inositol-anchored protein on human leukocytes: a possible role for regulation of neutrophil adherence and migration. J Immunol. 1999;162(7):4277–4284. [PubMed] [Google Scholar]
- 23.Sendo D, Takeda Y, Ishikawa H, Sendo F, Araki Y. Localization of GPI-80, a beta2-integrin-associated glycosylphosphatidyl-inositol anchored protein, on strongly CD14-positive human monocytes. Immunobiol. 2003;207(3):217–221. [DOI] [PubMed] [Google Scholar]
- 24.Nitto T, Inoue T, Node K. Alternative spliced variants in the pantetheinase family of genes expressed in human neutrophils. Gene. 2008;426(1–2):57–64. [DOI] [PubMed] [Google Scholar]
- 25.Nitto T, Onodera K. Linkage between coenzyme a metabolism and inflammation: roles of pantetheinase. Journal of pharmacological sciences. 2013;123(1):1–8. [DOI] [PubMed] [Google Scholar]
- 26.Prashad SL, Calvanese V, Yao CY, et al. GPI-80 defines self-renewal ability in hematopoietic stem cells during human development. Cell stem cell. 2015;16(1):80–87. [DOI] [PMC free article] [PubMed] [Google Scholar]
- 27.Soler DC, Sugiyama H, Young AB, Massari JV, McCormick TS, Cooper KD. Psoriasis patients exhibit impairment of the high potency CCR5(+) T regulatory cell subset. Clin Immunol. 2013;149(1):111–118. [DOI] [PMC free article] [PubMed] [Google Scholar]
- 28.Livak KJ, Schmittgen TD. Analysis of relative gene expression data using real-time quantitative PCR and the 2(-Delta Delta C(T)) Method. Methods. 2001;25(4):402–408. [DOI] [PubMed] [Google Scholar]
- 29.Soler DC, Young AB, Cooper KD, et al. The ratio of HLA-DR and VNN2(+) expression on CD14(+) myeloid derived suppressor cells can distinguish glioblastoma from radiation necrosis patients. J Neurooncol. 2017;134(1):189–196. [DOI] [PubMed] [Google Scholar]
- 30.Greifenberg V, Ribechini E, Rossner S, Lutz MB. Myeloid-derived suppressor cell activation by combined LPS and IFN-gamma treatment impairs DC development. Eur J Immunol. 2009;39(10):2865–2876. [DOI] [PubMed] [Google Scholar]
- 31.Rodriguez PC, Hernandez CP, Quiceno D, et al. Arginase I in myeloid suppressor cells is induced by COX-2 in lung carcinoma. J.Exp.Med. 2005;202(7):931–939. [DOI] [PMC free article] [PubMed] [Google Scholar]
- 32.Li H, Han Y, Guo Q, Zhang M, Cao X. Cancer-expanded myeloid-derived suppressor cells induce anergy of NK cells through membrane-bound TGF-beta 1. J Immunol. 2009;182(1):240–249. [DOI] [PubMed] [Google Scholar]
- 33.Aurrand-Lions M, Galland F, Bazin H, Zakharyev VM, Imhof BA, Naquet P. Vanin-1, a novel GPI-linked perivascular molecule involved in thymus homing. Immunity. 1996;5(5):391–405. [DOI] [PubMed] [Google Scholar]
- 34.Soler DC, Young AB, Fiessinger L, et al. Increased, but Functionally Impaired, CD14(+) HLA-DR(−/low) Myeloid-Derived Suppressor Cells in Psoriasis: A Mechanism of Dysregulated T Cells. J Invest Dermatol. 2016;136(4):798–808. [DOI] [PubMed] [Google Scholar]


