Abstract
The COVID-19 outbreak emerged in Wuhan, China, and was declared a global pandemic in March 2020. This study aimed to explore the association of daily mean temperature with the daily counts of COVID-19 cases in Beijing, Shanghai, Guangzhou, and Shenzhen, China. Data on daily confirmed cases of COVID-19 and daily mean temperatures were retrieved from the 4 first-tier cities in China. Distributed lag nonlinear models (DLNMs) were used to assess the association between daily mean temperature and the daily cases of COVID-19 during the study period. After controlling for the imported risk index and long-term trends, the distributed lag nonlinear model showed that there were nonlinear and lag relationships. The daily cumulative relative risk decreased for every 1.0 °C change in temperature in Shanghai, Guangzhou, and Shenzhen. However, the cumulative relative risk increased with a daily mean temperature below − 3 °C in Beijing and then decreased. Moreover, the delayed effects of lower temperatures mostly occurred within 6–7 days of exposure. There was a negative correlation between the cumulative relative risk of COVID-19 incidence and temperature, especially when the temperature was higher than − 3 °C. The conclusions from this paper will help government and health regulators in these cities take prevention and protection measures to address the COVID-19 crisis and the possible collapse of the health system in the future.
Keywords: Novel coronavirus disease, Temperature, Distributed lag nonlinear models, Imported risk
Introduction
Since late December 2019, SARS-CoV-2 has caused an outbreak of a novel coronavirus disease (COVID-19) in Wuhan, Hubei Province, China (Wang et al. 2020b). COVID-19 first gained public attention after a series of patients with pneumonia of unknown etiology were reported in Wuhan and then the infection spread to other parts of the world (Huang et al. 2020). COVID-19 was officially declared a pandemic by the World Health Organization (WHO) on March 11, 2020, due to its widespread and high infectivity. Additionally, it caused over 3.5 million infections and 0.24 million deaths worldwide by May 4, 2020 (Li et al. 2020).
A COVID-19 infection can cause a series of severe respiratory illnesses, similar to other coronaviruses, such as SARS-CoV and MERS-CoV (Xu et al. 2020). SARS-CoV (2002) occurred in 37 countries, causing over 8000 infections and 800 deaths, and MERS-CoV (2012), occurred in 27 countries, infecting nearly 2500 individuals and caused 858 death worldwide (Wu et al. 2020a). The transmission of coronaviruses can be affected by several factors, including population mobility (Chen et al. 2021; Jin et al. 2021; Zeng et al. 2021) and temperature. It has been suggested that SARS-CoV, MERS-CoV, and other coronaviruses, such as influenza, have significant relationships with temperature (Bi et al. 2007; Chan et al. 2011; Gardner et al. 2019; Hemmes et al. 1962; Ianevski et al. 2019; Jaakkola et al. 2014; Lowen et al. 2007; van Doremalen et al. 2013; Zhou and Jiang 2004).
It has been documented that temperature might have affected the COVID-19 outbreak. Recent studies found that temperature contributed to the spread of COVID-19 in Jakarta, Indonesia, and Istanbul, Turkey (Shahzad et al. n.d; Tosepu et al. 2020). A study in Turkey claimed that a higher temperature can help eliminate SARS-CoV-2 viability. Evidence from studies concerning 30 different provinces in China and New Jersey in the USA has shown negative associations of temperature with COVID-19 cases (Dogan et al. 2020; Qi et al. 2020). Other global studies have also found that mean temperature was negatively correlated with COVID-19 cases (Wu et al. 2020b; Yuan et al. 2021). Some scientists also researched temperature and stated no associations with COVID-19 (Juni et al. 2020; Yao et al. 2020). The effect of temperature on the transmission and survival of SARS-CoV-2 has been investigated to help predict prospects in the future. However, few of these studies focused on differences in population mobility across different regions.
In mainland China, COVID-19 led to 78,064 infected individuals and 2715 deaths as of February 25, 2020. The most affected cities outside Wuhan and Hubei were ranked as Chongqing, Wenzhou, Shenzhen, Beijing, Guangzhou, Shanghai, and so on. The first-tier cities (Beijing, Shanghai, Guangzhou, and Shenzhen) enjoy high levels of economic development and trade, so they have relatively larger migration populations than other cities. Notably, these 4 cities have apparently different climatic conditions, which provides informative results of the effect of temperature. After COVID-19 was first discovered in Wuhan, these first-tier cities’ population flows become an important influencer that caused the spread of COVID-19. In our study period, the population movement made these 4 first-tier cities more susceptible to COVID-19 and resulted in more confirmed cases. Baidu migration data around the study period reflect the scale and direction of interprefecture population movement. Therefore, we further took the influence of the migrating population into account to determine the association between temperature and the incidence of COVID-19. To provide useful implications for the government and the public, our study aimed to report new findings concerning the incidence of COVID-19 and temperature within 4 first-tier cities of China.
Materials and methods
Study areas
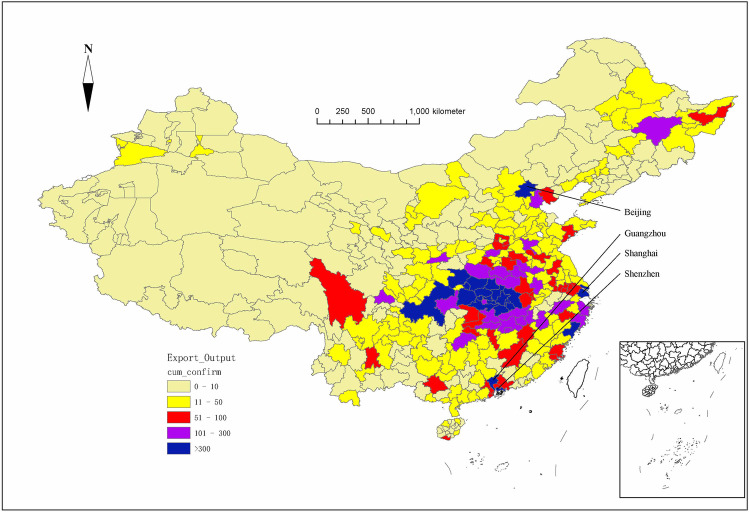
In our study, we choose 4 first-tier cities (Beijing, Shanghai, Guangzhou, and Shenzhen) as our study areas. Beijing, Shanghai, Guangzhou, and Shenzhen are located in northern, central, and southern of China (Fig. 1). Therefore, the 4 first-tier cities had significantly different temperature patterns, which helps to explain the relationship between temperature and the transmission of COVID-19. As the hub of China’s trade, these first-tier cities not only have geopolitical advantages but also have developed economies and more convenient transportation, so population mobility is higher. During our study period, Shenzhen, Beijing, Guangzhou, and Shanghai had the third to sixth largest numbers of cumulative confirmed cases outside of Wuhan and Hubei.
Fig. 1.
Cumulative case distributions and locations of the four first-tier cities (Beijing, Shanghai, Guangzhou, Shenzhen) in mainland China
Data collection
Data for daily confirmed COVID-19 cases and cumulative confirmed cases for the period from January 15 to February 25, 2020, were collected from the China National Health Commission (CNHC, http://www.nhc.gov.cn/) and websites of the provincial health commission. Daily meteorological data on mean temperature during the same study period were obtained from the China Meteorological Data Sharing Service System (http://cdc.cma.gov.cn). Population migration indices for other regions in mainland China of people moving to Beijing, Shanghai, Guangzhou, and Shenzhen came from Baidu Migration (http://qianxi.baidu.com). Population data were retrieved from the China Statistical Yearbook. The above study period was chosen (from January 15 to February 25, 2020) because overseas cases were imported into China after February 25.
The calculation of the COVID-19 imported risk index assumes that the population moving in the study city is in accordance with the population distribution of their origin areas, and the incidence of the immigration population is consistent with their origin areas. The imported risk index was estimated as follows:
where is the imported risk index of day ; is the daily count of COVID-19 cases at day in city ; denotes the population of city ; and is the population migration index of city .
Statistical analysis
Due to the existence of a lag effect, exposure to a specific temperature affects a person’s health for a period lasting some days after its occurrence (Gasparrini 2011) and as the incubation period of COVID-19 is estimated to range from 1 to 14 days, with a mean of 7 days, a quasi-Poisson regression model combined with a 7-day DLNM was used to evaluate the impact of mean temperature on the incidence of COVID-19 at different lag days. The case number of COVID-19 on the day was substituted by a 5-day moving average of daily confirmed case numbers, thus controlling the effect of artificial distortion (Shi et al. 2020). The core model is shown below:
where denotes the day of the observation; is the observed daily confirmed cases of COVID-19 on day ; α is the intercept; represents the cross-basis matrix used to depict the nonlinear correlation between temperature, the incidence of COVID-19, and the lag effect of temperature; β denotes the vector of coefficients for and is the number of lag days; df is the degree of freedom; and ns() denotes the natural cubic spline used to control the effect of the long-term trends of time. The Akaike information criterion (AIC) was used to select the for each variable. The statistical modeling and analyses were completed in R version 3.6.3 using the DLNM package by Gasparrini and Armstrong (2012).
Results
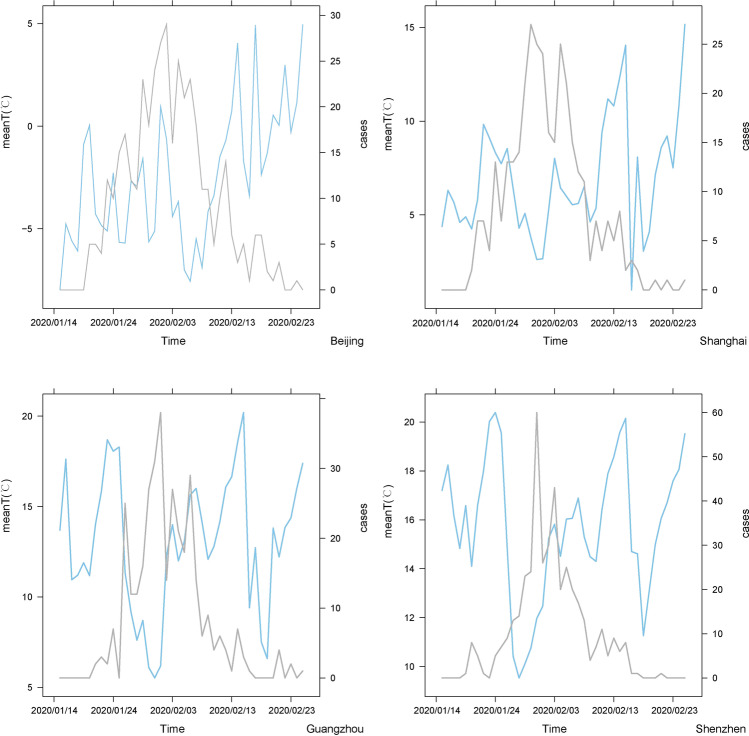
The measures of the total number, mean, SD, median, minimum, maximum and quartiles of daily confirmed cases of COVID-19, imported risk index, and mean temperature in the four first-tier cities were calculated (Table 1). Figure 2 shows the temporal patterns of daily cases of COVID-19 and mean temperatures in Beijing, Shanghai, Guangzhou, and Shenzhen. By February 25, 2020, a total of 400, 336, 346, and 417 cases were reported in Beijing, Shanghai, Guangzhou, and Shenzhen, respectively.
Table 1.
Summary statistics of the daily confirmed cases, imported risk indices, and mean temperatures in four first-tier cities, China
| Variables | Total | Mean | SD | Percentile | ||||
|---|---|---|---|---|---|---|---|---|
| Minimum | 25th | 50th | 75th | Maximum | ||||
| Beijing | ||||||||
| Cases | 400 | 9.52 | 8.80 | 0.00 | 1.25 | 6.00 | 15.75 | 29.00 |
| Imported risk index | 29.84 | 0.71 | 0.65 | 0.00 | 0.09 | 0.53 | 1.18 | 2.04 |
| Mean temperature | − 2.51 | 3.32 | − 7.98 | − 5.11 | − 2.82 | − 0.39 | 4.96 | |
| Shanghai | ||||||||
| Cases | 336 | 8.00 | 8.30 | 0.00 | 1.00 | 6.00 | 13.00 | 27.00 |
| Imported risk index | 47.36 | 1.13 | 1.16 | 0.00 | 0.11 | 0.54 | 2.01 | 3.45 |
| Mean temperature | 6.91 | 3.08 | 1.00 | 4.70 | 6.37 | 8.58 | 15.16 | |
| Guangzhou | ||||||||
| Cases | 346 | 8.24 | 10.49 | 0.00 | 0.00 | 3.50 | 13.50 | 38.00 |
| Imported risk index | 38.15 | 0.91 | 0.80 | 0.00 | 0.12 | 0.98 | 1.35 | 2.51 |
| Mean temperature | 13.04 | 3.79 | 5.52 | 11.19 | 13.38 | 15.96 | 20.20 | |
| Shenzhen | ||||||||
| Cases | 417 | 9.93 | 12.95 | 0.00 | 0.00 | 5.50 | 13.75 | 60.00 |
| Imported risk index | 46.13 | 1.10 | 1.10 | 0.00 | 0.18 | 0.64 | 1.69 | 4.32 |
| Mean temperature | 15.71 | 2.84 | 9.53 | 14.49 | 16.05 | 17.82 | 20.39 | |
SD, standard deviation
Fig. 2.
Temporal patterns of daily cases of COVID-19 and mean temperatures in Beijing, Shanghai, Guangzhou, and Shenzhen (period: January 15 to February 25, 2020); blue line: mean temperature; gray line: daily cases of COVID-19
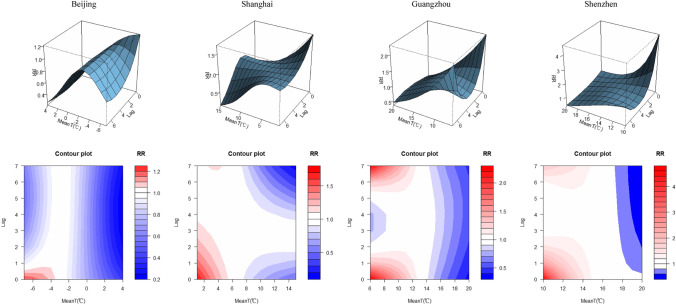
Figure 3 shows the overall exposure-lag-response relationships of the four first-tier cities between the mean temperature and daily confirmed cases during the lag range (0 to 7 days). The relative risk was calculated with the median daily mean temperature as the reference. The estimated effects of temperature were nonlinear for all studied cities. We found that the curves for Shanghai and Shenzhen were basically similar but different from those for Beijing and Guangzhou. Shanghai and Shenzhen each had a peak RR at minimum temperature for lag 0, and the temperature was negatively associated with the relative risk on the lag days. For Beijing, there were high relative risks at the daily mean temperature of approximately − 3 °C, suggesting an inverse relationship of relative risk with temperature. For Guangzhou, there were relatively low relative risks at 3 lag days.
Fig. 3.
Relative risks of daily confirmed cases of COVID-19 by daily mean temperatures during a lag range of 7 days
The overall cumulative summary did not show the lag space but considered the overall effect of daily mean temperature over the whole lag of 7 days (Fig. 4). Figure 4 depicts the cumulative relative risks at different temperature levels in Beijing, Shanghai, Guangzhou, and Shenzhen. The results indicated that the mean temperature notably affected the incidence of COVID-19. We found that for Shanghai, Guangzhou, and Shenzhen, the curves had highly similar trends. The curves suggested that the cumulative relative risk gradually decreased with increasing temperature. For Shanghai, the cumulative relative risk of COVID-19 incidence had a high value at the daily mean temperature of 2 °C (3.50, 95% CI: 1.10–11.19) and a low value at 14 °C (0.017, 95% CI: 0.0018–0.16). For Guangzhou, the cumulative relative risk of COVID-19 incidence had a high value at the daily mean temperature of 6 °C (4.70, 95% CI: 1.92–11.53) and a low value at 19 °C (0.0081, 95% CI: 0.0015–0.042). For Shenzhen, the cumulative relative risk of COVID-19 incidence had a high value at the daily mean temperature of 12 °C (15.04, 95% CI: 6.64–34.09) and a low value at 20 °C (0.0067, 95% CI: 0.0019–0.024). However, for Beijing, the curve was totally different from the others. The cumulative relative risk of COVID-19 peaked at the daily mean temperature of approximately − 3 °C (1.03, 95% CI: 1.01–1.06). When the mean temperature was below − 3 °C, the cumulative relative risk increased with the daily mean temperature and then decreased.
Fig. 4.
Daily confirmed cases of COVID-19 cumulative relative risk for daily mean temperatures at lags from 0 to 15 days in Beijing, Shanghai, Guangzhou, and Shenzhen
Figures 5, 6, 7, and 8 show the relative risk for COVID-19 incidence by daily mean temperatures at specific lags (0, 7 days) and by lag days at specific temperatures. Figure 5 shows that at a mean temperature of − 7 °C, the relative risks were greater than 1 on the current day, decreased for 4 days, and then slightly increased until the seventh lag day; high temperatures (4 °C) had all relative risks under 1. At a lag of 0 days, the relative risks were larger than 1 when the mean temperature was below − 3 °C and lower than 1 after it exceeded − 3 °C. At a lag of 7 days, all relative risks were less than 1, but they increased with mean temperatures below − 3 °C and decreased thereafter.
Fig. 5.
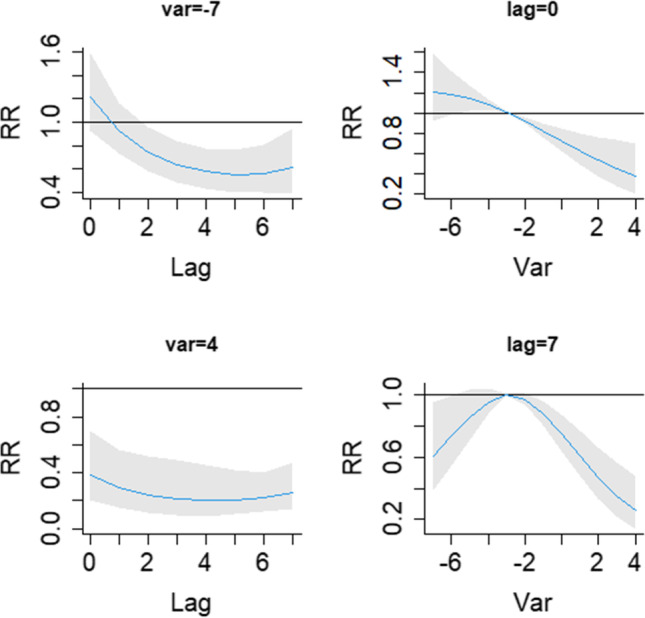
The relative risk of daily confirmed cases by daily mean temperatures for lag day (0, 7 days) and temperature (− 7, 4 °C)
Fig. 6.
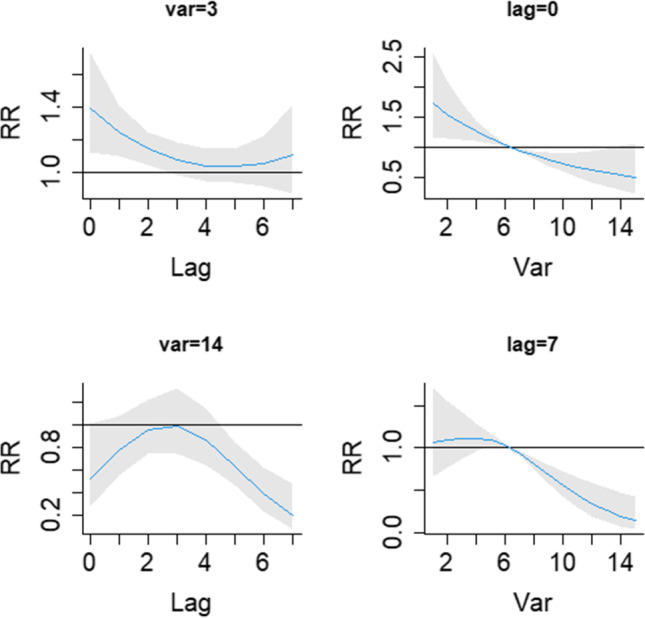
The relative risk of daily confirmed cases by daily mean temperature for lag day (0, 7 days) and temperature (3, 14 °C)
Fig. 7.
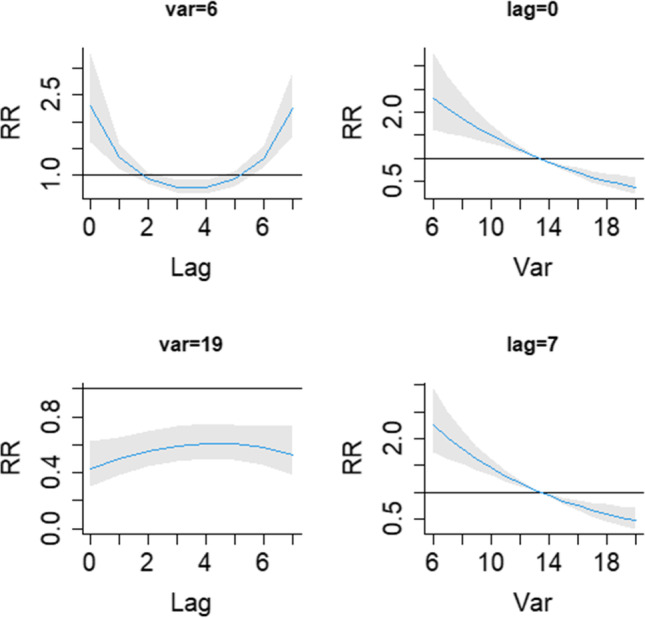
The relative risk of daily confirmed cases by daily mean temperature for lag day (0, 7 days) and temperature (6, 19 °C)
Fig. 8.
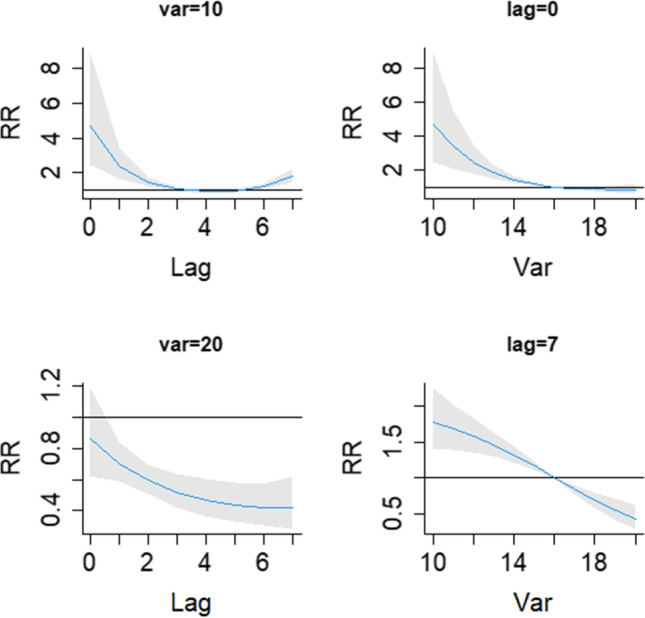
The relative risk of daily confirmed cases by daily mean temperature for lag day (0, 7 days) and temperature (10, 20 °C)
Figure 6 shows that at a mean temperature of 3 °C, the relative risks were greater than 1 at a lag of 0–2 days and then were not significantly different from 1. At a mean temperature of 14 °C, the relative risks were statistically less than 1 at a lag of 5–7 days. At a lag of 0 days, the relative risk decreased with the lag day and did not significantly differ from 1 at the end of the lag range. At a lag of 7 days, the relative risk decreased with mean temperature after it surpassed 6 °C.
Figure 7 shows that at the temperature of 6 °C, the relative risks were greater than 1 at lags of 0–1 days and 6–7 days and less than 1 at a lag of 3–4 days. At a mean temperature of 19 °C, all relative risks were statistically below 0.8. At lags of 0 and 7 days, the relative risk decreased with mean temperature.
Figure 8 shows that at mean temperature of 10 °C, the relative risks were greater than 1 at a lag of 0–2 days and a lag of 6–7 days. At a mean temperature of 20 °C, in addition to the current day, all relative risks were less than 1. On the current day, the relative risk was greater than 1 at a mean temperature of below 15 °C. Afterward, the relative risk decreased with the temperature, but they were not statistically significant. At a lag of 7 days, the relative risk decreased with the temperature for the whole lag range.
Discussion
In our study, based on data from China’s 4 first-tier cities, the nonlinear and lag relationships between temperature and the incidence of COVID-19 after controlling for the imported risk index, long-term trend, and other potential confounders. We included the variable daily mean temperature in the DLNMs with a maximum lag of 7 days for the 4 first-tier cities in China.
Our results showed that increased temperature was statistically related to decreased COVID-19 incidence, and the lower temperature effect was also delayed by 6–7 days. This correlation is consistent with previous studies that showed the correlation between temperature and COVID-19 transmission. A retrospective cohort study posited that the mean temperature had an inverse relationship with the incidence of COVID-19 in China (Ying et al. 2020), which was also consistent with a dynamic transmission model study (Shi et al. 2020). This finding is in line with a study based on 4 statistical methods in NJ, USA (Dogan et al. 2020). Simultaneously, in Brazil, a study found that an increased temperature (ranging from 16.8 to 27.4 °C) notably correlated with a decreased incidence of COVID-19 (Prata et al. 2020).
Many studies have found that temperature plays a vital role in the transmission and survival of other coronaviruses. A study of SARS in Hong Kong indicated that temperature was a decisive factor in the transmission of SARS-CoV, and the risk of daily incidence of SARS in days with a lower temperature was larger than that in days with a higher temperature (Lin et al. 2006). Similarly, another study claimed that SARS-CoV persisted for longer and was less easily inactivated at 4 °C than at 20 °C (Casanova et al. 2010). The studies of Gardner et al. (2019) and van Doremalen et al. (2013) demonstrated that colder, drier conditions lead to an increase in the risk of zoonotic transmission of MERS from dromedaries to humans (Gardner et al. 2019; van Doremalen et al. 2013). All the findings cited directly or indirectly support the link between COVID-19 transmission and temperature, and these above results support with our findings. Although some researches have discussed the link of COVID-19 and temperature, they may have ignored the contribution of population mobility to the transmission of COVID-19. Therefore, they cannot have an in-depth understanding of the correlation between temperature and COVID-19 without considering population mobility. Previous studies have showed that population mobility may be related to transmission of COVID-19 (Z.-L. Chen et al. 2020; Chinazzi et al. 2020; Fan et al. 2020; C. Lin et al. 2020; Liu et al. 2020; Tian et al. 2020; Wang et al. 2020a). In our study, we considered the effect of population mobility in our model and elaborated on the correlation between temperature and COVID-19.
The cumulative RR results showed that for Shanghai, Guangdong, and Shenzhen, increased temperature was associated with a decreased incidence of COVID-19. However, the results for Beijing were not completely consistent with these results. We found that Beijing had a different temperature pattern, consisting of mean temperatures between − 7 and 4 °C. When the mean temperature was below − 3 °C, the mean temperature showed a positive association, and after that, it showed a negative association with the incidence of COVID-19. Sajadi et al. (2020) noted that there were relatively few cases of COVID-19 in colder regions in northern latitudes (Sajadi et al. 2020). Another study by Auler et al. (2020) found that a higher mean temperature favored the transmission of COVID-19 in tropical regions (Auler et al. 2020). The same relationship has also been observed previously in studies about other coronaviruses. Tan et al. (2005) found a positive correlation between SARS cases and temperature in Beijing (Tan et al. 2005). It is worth to mentioning that a study in 14 Algerian cities concluded that temperature did not influence the COVID-19 pandemic and that the effect of temperature was weak. However, at the current day, low temperature increased the relative risk of COVID-19 in our study. That is, there might be an optimal temperature range that facilitates the COVID-19 outbreak, which may partly explain why COVID-19 first broke out in Wuhan, China. Overall, the samples that were analyzed have strong operational preparedness capacities, providing evidence that an effective response to potential health emergencies, including COVID-19, is possible. Capacity building and cooperation between cities are needed to strengthen preparedness for epidemic control.
There are still some limitations in our current study. First, our study period was much shorter than most epidemiological studies, mainly overlapping the winter months, which limited the temperature to a narrow range. Second, we could not obtain temperature data at the individual level. It is therefore difficult to determine the exact temperature at which the patients were infected. Third, sex and age factors were not considered in our study because there was a lack of clinical information. Fourth, we only studied the effect of temperature, but other meteorological factors could possibly have effects on the transmission of COVID-19. Fifth, our study merely focused on 4 first-tier cities in China. Further studies need to be conducted to explore the effects of temperature and other meteorological factors on the transmission of COVID-19 in other cities and countries.
Conclusion
COVID-19 is a widespread infectious disease that has affected millions of people worldwide. The COVID-19 pandemic originated in Wuhan city in China. Beijing, Shanghai, Guangzhou, and Shenzhen are 4 main first-tier cities with different types of temperature patterns, which also have higher population flow rates than other cities in China. Under the conditions of no imported cases from abroad, the temperature parameter on the transmission of COVID-19 was investigated in the 4 first-tier cities. First, we found that temperature was a vital factor affecting the spread of COVID-19 in Beijing, Shanghai, Guangzhou, and Shenzhen after controlling the influence of population mobility. We find positive correlations for Shanghai, Guangzhou, and Shenzhen between temperatures and the number of confirmed COVID-19 cases; meanwhile, we find positive correlation for Beijing when temperature was lower than − 3 °C, but otherwise negative. Second, our study found that the lower temperature effect was delayed by 6–7 days. Moreover, the significance of temperature implies that the COVID-19 pandemic might gradually ease as the temperature rises in the next few months. In conclusion, the study provides important information on the effect of temperature on the COVID-19 pandemic. This work also has implications for the governance of public health policies by the government under changing temperature circumstances in cities with high population mobility.
Author contribution
ZF designed and drafted the manuscript. SY, CL, and PG participated in the data collection. ZF, DH, and WW participated in the data analysis. SA, BZ, and WW critically revised the manuscript. The final manuscript has been read and approved by all the authors.
Funding
This study was supported by the National Natural Science Foundation of China (Grant No. 81202254 and 71974199) and the Science Foundation of Liaoning Provincial Department of Education (LJKQZ2021027).
Data availability
The data were obtained from the China National Health Commission (CNHC, http://www.nhc.gov.cn/) and websites of the provincial health commission, China Meteorological Data Sharing Service System (http://cdc.cma.gov.cn) and Baidu Migration (http://qianxi.baidu.com).
Declarations
Ethics approval and consent to participate
Not applicable.
Consent for publication
Not applicable.
Competing interests
The authors declare no competing interests.
Footnotes
Publisher's Note
Springer Nature remains neutral with regard to jurisdictional claims in published maps and institutional affiliations.
Contributor Information
Zheng-gang Fang, Email: 1256451284@qq.com.
Shu-qin Yang, Email: 1161255664@qq.com.
Cai-xia Lv, Email: 1719592383@qq.com.
Shu-yi An, Email: shuyian_cdc@163.com.
Peng Guan, Email: pguan@cmu.edu.cn.
De-sheng Huang, Email: dshuang@cmu.edu.cn.
Bao-sen Zhou, Email: bszhou@cmu.edu.cn.
Wei Wu, Email: wuwei@cmu.edu.cn.
References
- Auler AC, Cassaro FAM, da Silva VO, Pires LF. Evidence that high temperatures and intermediate relative humidity might favor the spread of COVID-19 in tropical climate: a case study for the most affected Brazilian cities. Sci Total Environ. 2020;729:139090. doi: 10.1016/j.scitotenv.2020.139090. [DOI] [PMC free article] [PubMed] [Google Scholar]
- Bi P, Wang J, Hiller JE. Weather: driving force behind the transmission of severe acute respiratory syndrome in China? Intern Med J. 2007;37(8):550–554. doi: 10.1111/j.1445-5994.2007.01358.x. [DOI] [PMC free article] [PubMed] [Google Scholar]
- Casanova LM, Jeon S, Rutala WA, Weber DJ, Sobsey MD. Effects of air temperature and relative humidity on coronavirus survival on surfaces. Appl Environ Microbiol. 2010;76(9):2712–2717. doi: 10.1128/aem.02291-09. [DOI] [PMC free article] [PubMed] [Google Scholar]
- Chan KH, Peiris JSM, Lam SY, Poon LLM, Yuen KY, Seto WH. The effects of temperature and relative humidity on the viability of the SARS coronavirus. Advances in Virology. 2011;2011:734690. doi: 10.1155/2011/734690. [DOI] [PMC free article] [PubMed] [Google Scholar]
- Chen Z.-L, Zhang Q, Lu Y, Guo Z.-M, Zhang X, Zhang W.-J., . . . Lu J.-H (2020) Distribution of the COVID-19 epidemic and correlation with population emigration from Wuhan, China. Medical Journal 133(9):1044 105010.1097/cm9.0000000000000782 [DOI] [PMC free article] [PubMed]
- Chen Y, Chen M, Huang B, Wu C, & Shi W (2021) Modeling the spatiotemporal association between COVID-19 transmission and population mobility using geographically and temporally weighted regression. Geohealth 5(5). 10.1029/2021gh000402 [DOI] [PMC free article] [PubMed]
- Chinazzi, M., Davis, J. T., Ajelli, M., Gioannini, C., Litvinova, M., Merler, S., . . . Vespignani, A. (2020). The effect of travel restrictions on the spread of the 2019 novel coronavirus (COVID-19) outbreak. Science, 368(6489), 395-+. doi:10.1126/science.aba9757 [DOI] [PMC free article] [PubMed]
- Dogan B, Ben Jebli M, Shahzad K, Farooq TH, & Shahzad U. (2020)Investigating the effects of meteorological parameters on COVID-19: case study of New Jersey United States. Environ Res 19110.1016/j.envres.2020.110148 [DOI] [PMC free article] [PubMed]
- Fan, C., Liu, L., Guo, W., Yang, A., Ye, C., Jilili, M., . . . Wang, Y. (2020). Prediction of epidemic spread of the 2019 novel coronavirus driven by spring festival transportation in China: a population-based study. International Journal of Environmental Research and Public Health, 17(5). doi:10.3390/ijerph17051679 [DOI] [PMC free article] [PubMed]
- Gardner EG, Kelton D, Poljak Z, Van Kerkhove M, von Dobschuetz S, Greer AL. A case-crossover analysis of the impact of weather on primary cases of Middle East respiratory syndrome. BMC Infect Dis. 2019;19:10. doi: 10.1186/s12879-019-3729-5. [DOI] [PMC free article] [PubMed] [Google Scholar]
- Gasparrini A. Distributed lag linear and non-linear models in R: the package dlnm. J Stat Softw. 2011;43(8):1–20. doi: 10.18637/jss.v043.i08. [DOI] [PMC free article] [PubMed] [Google Scholar]
- Hemmes JH, Winkler KC, Kool SM. Virus survival as a seasonal factor in influenza and poliomylitis. Antonie Van Leeuwenhoek. 1962;28:221–233. doi: 10.1007/bf02538737. [DOI] [PubMed] [Google Scholar]
- Huang CL, Wang YM, Li XW, Ren LL, Zhao JP, Hu Y, . . . Cao B (2020) Clinical features of patients infected with 2019 novel coronavirus in Wuhan China. Lancet 395(10223)497-50610.1016/s0140-6736(20)30183-5 [DOI] [PMC free article] [PubMed]
- Ianevski A, Zusinaite E, Shtaida N, Kallio-Kokko H, Valkonen M, Kantele A, . . . Kainov DE (2019) Low temperature and low UV indexes correlated with peaks of influenza virus activity in Northern Europe during 2010-2018. Viruses-Basel 11(3)1010.3390/v11030207 [DOI] [PMC free article] [PubMed]
- Jaakkola K, Saukkoriipi A, Jokelainen J, Juvonen R, Kauppila J, Vainio O, . . . Grp KI.-S. (2014) Decline in temperature and humidity increases the occurrence of influenza in cold climate. Environ Health 1310.1186/1476-069x-13-22 [DOI] [PMC free article] [PubMed]
- Jin NM, cho HMM, Kim YS, & Rahman T (2021) The effect of the community mobility on the COVID-19 pandemic. Logos Management Review 19(3):41-54
- Juni P, Rothenbuhler M, Bobos P, Thorpe KE, da Costa BR, Fisman DN, . . . Gesink D (2020) Impact of climate and public health interventions on the COVID-19 pandemic: a prospective cohort study CMAJ 192(21)E566-E57310.1503/cmaj.200920 [DOI] [PMC free article] [PubMed]
- Li, H., Xu, X.-L., Dai, D.-W., Huang, Z.-Y., Ma, Z., & Guan, Y.-J. (2020). Air pollution and temperature are associated with increased COVID-19 incidence: a time series study International Journal of Infectious Diseases, 97. [DOI] [PMC free article] [PubMed]
- Lin K, Fong DYK, Zhu BL, Karlberg J. Environmental factors on the SARS epidemic: air temperature, passage of time and multiplicative effect of hospital infection. Epidemiol Infect. 2006;134(2):223–230. doi: 10.1017/s0950268805005054. [DOI] [PMC free article] [PubMed] [Google Scholar]
- Lin C, Lau AKH, Fung JCH, Guo C, Chan JWM, Yeung DW, . . . Lao XQ (2020)A mechanism-based parameterisation scheme to investigate the association between transmission rate of COVID-19 and meteorological factors on plains in China. Sci Total Environ 73710.1016/j.scitotenv.2020.140348 [DOI] [PMC free article] [PubMed]
- Liu J, Zhou J, Yao J, Zhang X, Li L, Xu X., . . . Zhang K (2020) Impact of meteorological factors on the COVID-19 transmission: a multi-city study in China. Sci Total Environ 72610.1016/j.scitotenv.2020.138513 [DOI] [PMC free article] [PubMed]
- Lowen AC, Mubareka S, Steel J, Palese P. Influenza virus transmission is dependent on relative humidity and temperature. PLoS Pathog. 2007;3(10):1470–1476. doi: 10.1371/journal.ppat.0030151. [DOI] [PMC free article] [PubMed] [Google Scholar]
- Prata DN, Rodrigues W, Bermejo PH. Temperature significantly changes COVID-19 transmission in (sub)tropical cities of Brazil. Sci Total Environ. 2020;729:138862. doi: 10.1016/j.scitotenv.2020.138862. [DOI] [PMC free article] [PubMed] [Google Scholar]
- Qi H, Xiao S, Shi R, Ward MP, Chen Y, Tu W, . . . Zhang Z (2020) COVID-19 transmission in Mainland China is associated with temperature and humidity: a time-series analysis. Sci Total Environ 728:13877810.1016/j.scitotenv.2020.138778 [DOI] [PMC free article] [PubMed]
- Sajadi, M. M., Habibzadeh, P., Vintzileos, A., Shokouhi, S., Miralles-Wilhelm, F., & Amoroso, A. (2020). Temperature, humidity, and latitude analysis to estimate potential spread and seasonality of coronavirus disease 2019 (COVID-19). JAMA Network Open, 3(6). doi:10.1001/jamanetworkopen.2020.11834 [DOI] [PMC free article] [PubMed]
- Shahzad K, Farooq TH, Dogan B, Hu LZ, & Shahzad U (n.d.) Does environmental quality and weather induce COVID-19: case study of Istanbul, Turkey. Environ Forensics. 10.1080/15275922.2021.1940380
- Shi P, Dong Y, Yan H, Zhao C, Li X, Liu W, . . . Xi S (2020) Impact of temperature on the dynamics of the COVID-19 outbreak in China. Sci Total Environ 728:13889010.1016/j.scitotenv.2020.138890 [DOI] [PMC free article] [PubMed]
- Tan JG, Mu LN, Huang JX, Yu SZ, Chen BH, Yin J. An initial investigation of the association between the SARS outbreak and weather: with the view of the environmental temperature and its variation. J Epidemiol Community Health. 2005;59(3):186–192. doi: 10.1136/jech.2004.020180. [DOI] [PMC free article] [PubMed] [Google Scholar]
- Tian, H., Liu, Y., Li, Y., Wu, C.-H., Chen, B., Kraemer, M. U. G., . . . Dye, C. (2020). An investigation of transmission control measures during the first 50 days of the COVID-19 epidemic in China. Science, 368(6491), 638-+. doi:10.1126/science.abb6105 [DOI] [PMC free article] [PubMed]
- Tosepu R, Gunawan J, Effendy DS, Ahmad OAI, Lestari H, Bahar H, Asfian P. Correlation between weather and Covid-19 pandemic in Jakarta Indonesia. Sci Total Environ. 2020;725:138436. doi: 10.1016/j.scitotenv.2020.138436. [DOI] [PMC free article] [PubMed] [Google Scholar]
- van Doremalen, N., Bushmaker, T., & Munster, V. J. (2013). Stability of Middle East respiratory syndrome coronavirus (MERS-CoV) under different environmental conditions. Euro surveillance : bulletin Europeen sur les maladies transmissibles = European communicable disease bulletin, 18(38). [DOI] [PubMed]
- Wang C, Horby PW, Hayden FG, Gao GF. A novel coronavirus outbreak of global health concern. Lancet. 2020;395(10223):470–473. doi: 10.1016/s0140-6736(20)30185-9. [DOI] [PMC free article] [PubMed] [Google Scholar]
- Wang, B., Liu, J., Li, Y., Fu, S., Xu, X., Li, L., . . . Zhang, K. (2020). Airborne particulate matter, population mobility and COVID-19: a multi-city study in China. Bmc Public Health, 20(1). doi:10.1186/s12889-020-09669-3 [DOI] [PMC free article] [PubMed]
- Wu JT, Leung K, Leung GM. Nowcasting and forecasting the potential domestic and international spread of the 2019-nCoV outbreak originating in Wuhan, China: a modelling study. Lancet. 2020;395(10225):689–697. doi: 10.1016/s0140-6736(20)30260-9. [DOI] [PMC free article] [PubMed] [Google Scholar]
- Wu Y, Jing W, Liu J, Ma Q, Yuan J, Wang Y, . . . Liu M (2020b)Effects of temperature and humidity on the daily new cases and new deaths of COVID-19 in 166 countries.Sci Total Environ 729 13905110.1016/j.scitotenv.2020.139051 [DOI] [PMC free article] [PubMed]
- Xu Z, Shi L, Wang YJ, Zhang JY, Huang L, Zhang C, . . . Wang FS (2020) Pathological findings of COVID-19 associated with acute respiratory distress syndrome. Lancet Respiratory Medicine 8(4)420-42210.1016/s2213-2600(20)30076-x [DOI] [PMC free article] [PubMed]
- Yao, Y., Pan, J., Liu, Z., Meng, X., Wang, W., Kan, H., & Wang, W. (2020). No association of COVID-19 transmission with temperature or UV radiation in Chinese cities. Eur Respir J, 55(5). doi:10.1183/13993003.00517-2020 [DOI] [PMC free article] [PubMed]
- Ying, J., Xiao-Jun, W., & Yan-Jun, G. (2020). Effect of ambient air pollutants and meteorological variables on COVID-19 incidence. Infection control and hospital epidemiology. [DOI] [PMC free article] [PubMed]
- Yuan J, Wu Y, Jing W, Liu J, Du M, Wang Y, & Liu M (2021)Association between meteorological factors and daily new cases of COVID-19 in 188 countries: a time series analysis.Sci Total Environ 78010.1016/j.scitotenv.2021.146538 [DOI] [PMC free article] [PubMed]
- Zeng C, Zhang J, Li Z, Sun X, Olatosi B, Weissman S, & Li X (2021) Spatial-temporal relationship between population mobility and COVID-19 outbreaks in South Carolina: time series forecasting analysis. Journal of Medical Internet Research, 23(4). doi:10.2196/27045 [DOI] [PMC free article] [PubMed]
- Zhou Z.-X, & Jiang C.-Q (2004) Effect of environment and occupational hygiene factors of hospital infection on SARS outbreak. Zhonghua lao dong wei sheng zhi ye bing za zhi = Zhonghua laodong weisheng zhiyebing zazhi = Chinese journal of industrial hygiene and occupational diseases, 22(4), 261–263. [PubMed]
Associated Data
This section collects any data citations, data availability statements, or supplementary materials included in this article.
Data Availability Statement
The data were obtained from the China National Health Commission (CNHC, http://www.nhc.gov.cn/) and websites of the provincial health commission, China Meteorological Data Sharing Service System (http://cdc.cma.gov.cn) and Baidu Migration (http://qianxi.baidu.com).


