Abstract
Objective:
In the LVAD domain, the receiver operating characteristic (ROC) is a commonly applied metric of performance of classifiers. However, ROC can provide a distorted view of classifiers ability to predict short-term mortality due to the overwhelmingly greater proportion of patients who survive, i.e. imbalanced data. This study illustrates the ambiguity of ROC in evaluating two classifiers of 90-day LVAD mortality and introduces the precision recall curve (PRC) as a supplemental metric that is more representative of LVAD classifiers in predicting the minority class.
Methods:
This study compared the ROC and PRC for two classifiers for 90-day LVAD mortality, HeartMate Risk Score (HMRS) and a Random Forest (RF), for 800 patients (test group) recorded in INTERMACS who received a continuous-flow LVAD between 2006 and 2016 (mean age of 59 years; 146 females vs. 654 males) in which 90-day mortality rate is only 8%.
Results:
The ROC indicates similar performance of RF and HMRS classifiers with respect to Area Under the Curve (AUC) of 0.77 vs. 0.63, respectively. This is in contrast with their PRC with AUC of 0.43 vs. 0.16 for RF and HMRS, respectively. The PRC for HMRS showed the precision rapidly dropped to only 10% with slightly increasing sensitivity.
Conclusion:
The ROC can portray an overly-optimistic performance of a classifier or risk score when applied to imbalanced data. The PRC provides better insight about the performance of a classifier by focusing on the minority class.
Keywords: LVAD, imbalanced data, ROC, PRC
I. INTRODUCTION
No clinical classifier or risk score is ever perfect; therefore, it is essential to consider their limitations and predictive accuracy when used clinically. A common metric of performance is the receiver-operator characteristic, ROC [1]–[3]. However, in the context of Mechanical Circulatory Support (MCS) such as LVAD therapy, there is an important consideration that is often, if not always overlooked: namely the imbalanced distribution of outcomes. Due to the increasing success of LVAD therapy, 90-day survival exceeds 90% [4]. Thus, when developing a classifier for mortality, there will be a relative paucity of training data for the minority class. Therefore, additional scrutiny on the performance with the minority class in needed. Consequently, ROC which gives same weight to both majority and minority classes can portray an overly-optimistic performance of the model [5]–[8]. Such imbalanced data is common in real-world domains such as fraud detection [9] and diagnosis of rare diseases [10]–[13]. However, as recently reported by Ishwaran et al. [14]–[16], the issue has been relatively overlooked in the field of cardiothoracic surgery. This paper provides an elucidating explanation of the imbalance issue in the context of the MCS field, particularly classifiers for LVAD mortality. This paper also presents an alternative metric that is sensitive to the imbalance in the data and can better assess the model’s performance in predicting the minority class.
II. METHODS AND BACKGROUND
A. Comparison of Two Classifiers for 90-day Mortality
This study compares the performance of two classifiers for predicting 90-day mortality after LVAD implantation; the well-known HeartMate Risk Score (HMRS) and a Random Forest (RF) that was derived de novo from a large multi-center registry data. The HMRS, a logistic regression-based score, was derived from and validated within 1,122 patients with 13% 90-day mortality who received a HeartMate II as a bridge to transplant or destination therapy and computes the 90-day risk scores for mortality based on five variables [1]. The RF is a popular ensemble algorithm constructed by combining multiple decision trees based on “bootstrap” samples from data with random feature selection [17]. Each tree in RF has a “vote” for the outcome, and the overall classifier is determined by majority of votes of the trees. For this study, RF was derived based on 235 pre-LVAD clinical variables, such as lab values, demographic information, clinical history, etc., from 11,967 patients with advanced heart failure who received a continuous-flow LVAD recorded in the Interagency Registry for Mechanically Assisted Circulatory Support (INTERMACS). This study was waived from Informed Written Consent. The data were randomly divided into a training (70%) and a test (30%) set. The HMRS score was computed for a subset of the test data set, censoring patients who received a heart transplant or had total recovery before 90 days, and for whom the data records did not contain all five variables required to compute HMRS. The resulting data set for computing HMRS included 800 patients (mean age of 59 years; 146 females vs. 654 males). A majority of these 800 survived to 90 days (SURV class = 92%) and only 8% of patients were dead at 90 days (DEAD class). Thus, there is a high imbalance between the SURV class (majority class) and DEAD class (minority class) in these data.
B. The Problem of Imbalance (and Overlap)
Without loss of generality, a classifier is a means of assigning the predicted probability of an outcome to a specific class, also known as a label. For example, if the predicted probability of a hypothetical patient being dead (PPD) is 70%, then this patient can be assigned the label “DEAD” by prescribing a cutoff value of, say 50%. By the same token, if PPD is below the cutoff, say 30%, then the patient would be assigned to the survival class “SURV.” (See Figure 1A.) Then, to evaluate the performance of the classifier, the predicted label is compared to the actual outcome and summarized in the form of a confusion matrix, as shown in Figure 1A (inset) containing four elements: True DEAD, False DEAD, True SURV, False SURV. From these four elements, several evaluation metrics can be computed, including sensitivity, precision, and specificity.
Figure 1A:
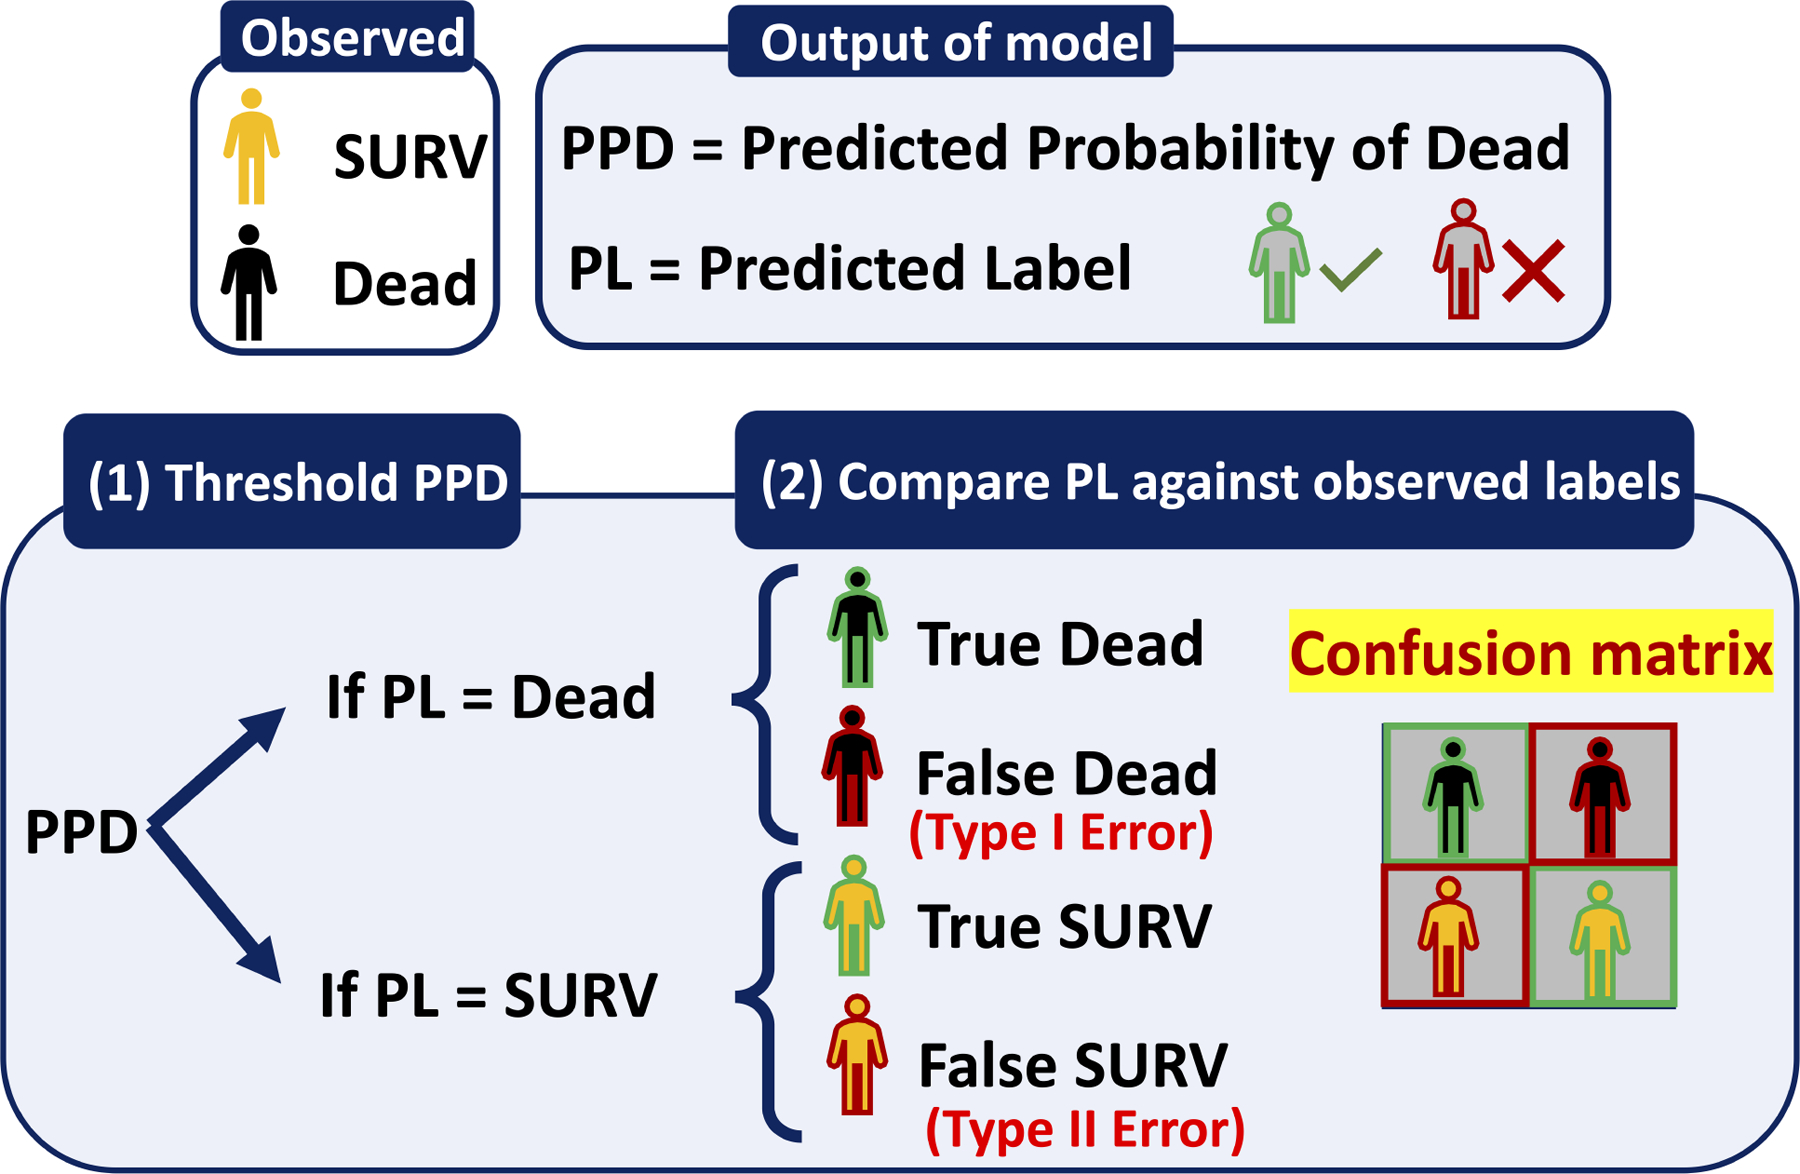
Transition of the outcome of a classifier from Predicted Probabilities of Dead (PPD) to Predicted Label (PL)- (1) Threshold the PPDs: If the PPD for a patient is greater than the threshold then the PL would be DEAD otherwise PL would be SURV. (2) Compare generated PL against the observed class/label and form the confusion matrix.
Choosing the best threshold is a challenging task that can highly affect the perception of model’s performance. For example, Figure 1B shows the predicted probabilities of being dead for three patients based on two potential thresholds of 50% and 51%. In this example the labels for the two extreme cases (PPD = 0% and 100%) are unambiguous. However, the patient in the middle with the 50% predicted probability of being dead (hence 50% chance of being alive) can be classified with either label SURV or DEAD by merely altering the threshold by one percentage point. In this example, the performance of this classifier is achieved by assigning a threshold of 51% leading to the correct classification of all three patients. However, optimizing the threshold in real life is not as straightforward as this example.
Figure 1B:
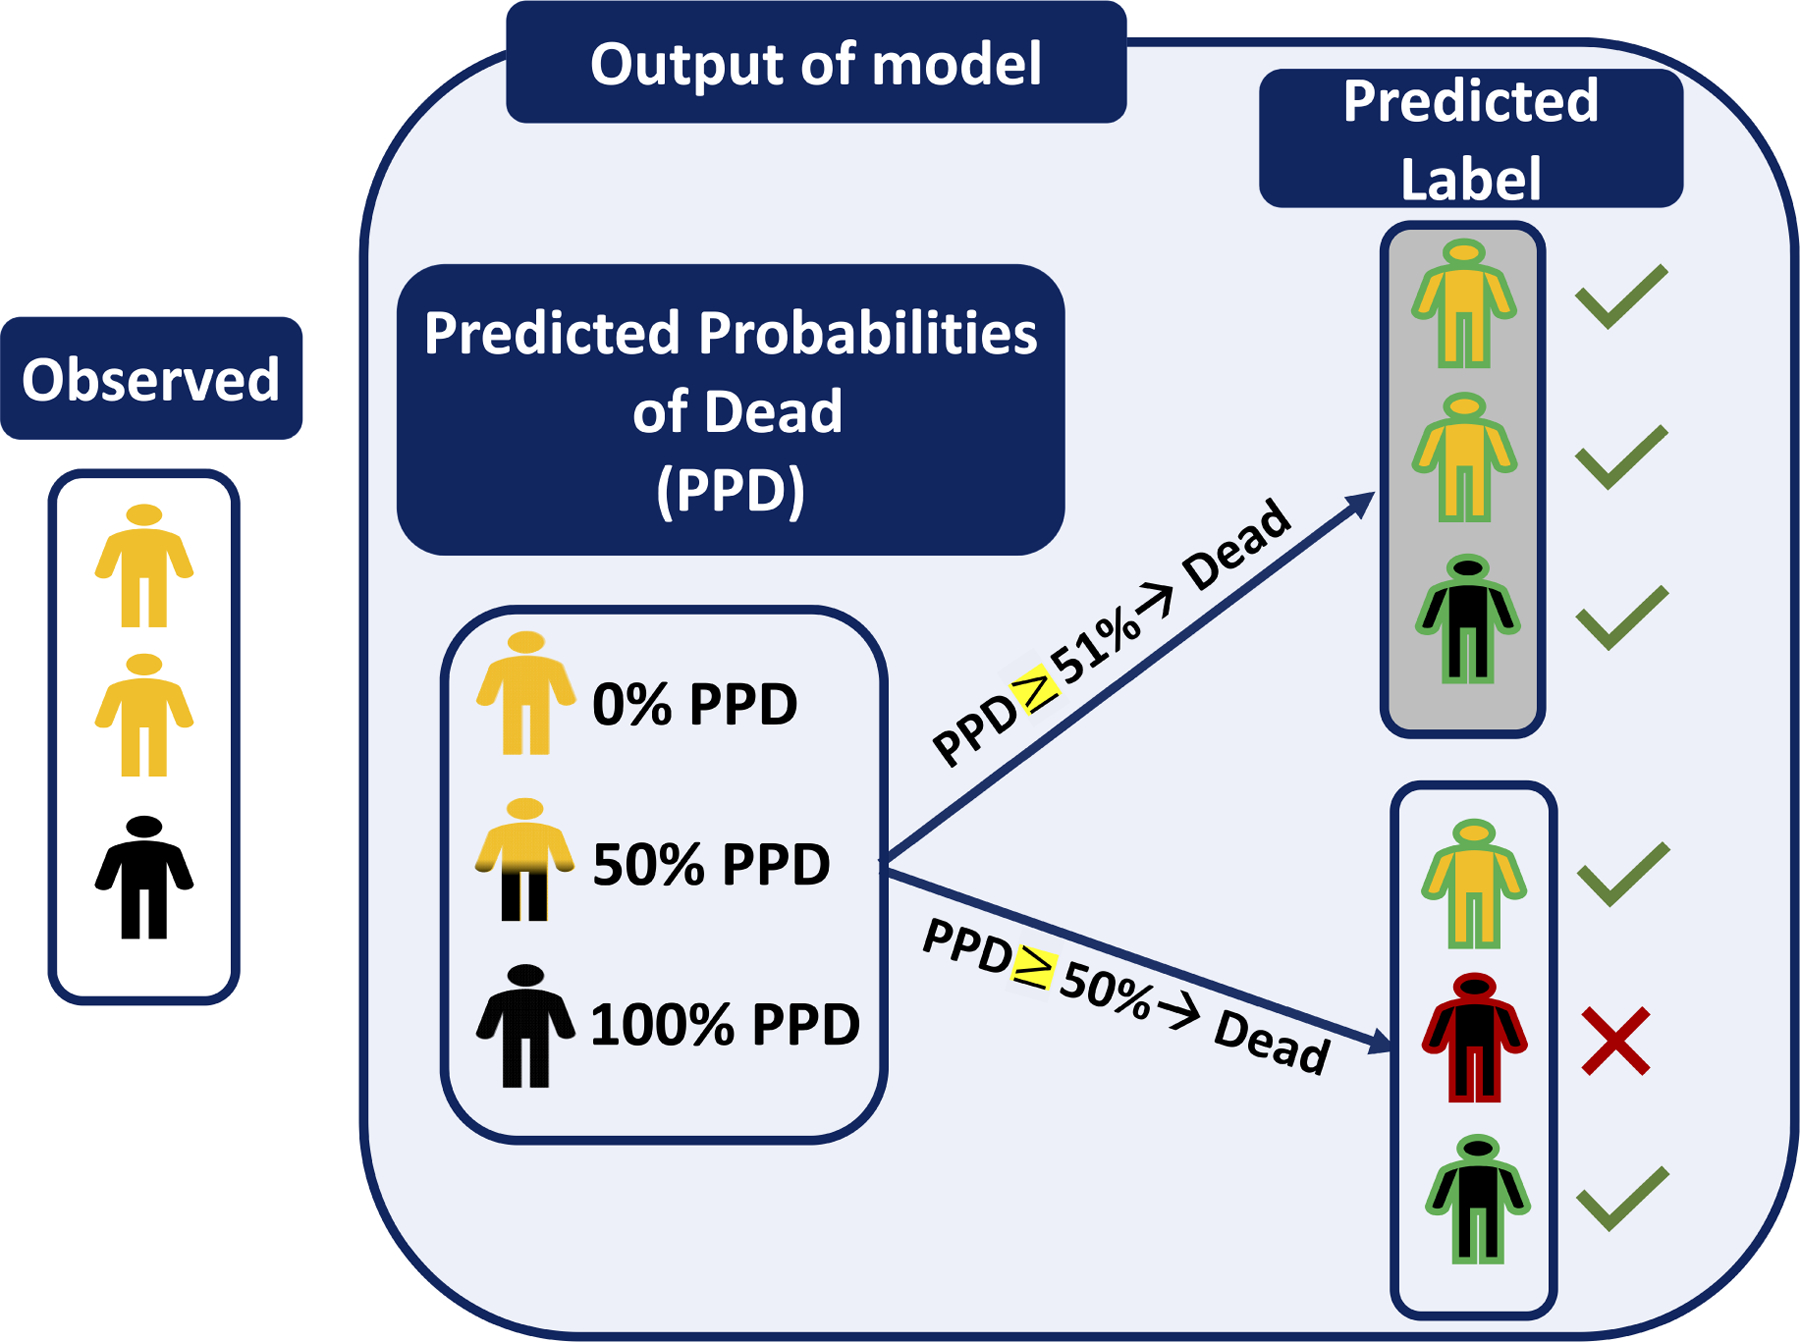
An example shows the transition of the outcome of a classifier for three patients from PPDs to PLs using two slightly different thresholds- The PLs generated using the threshold of 51% (with gray background) are all correctly classified vs the threshold of 50% caused one misclassified label.
When considering a larger population of patients, the distribution of PPD contains an ambiguous overlap in which an intermediate range of probabilities is associated with both classes. (See Figure 2A, plot B). This is in contradistinction to the “perfect” classifier that does not contain any such overlap. (See Figure 2A, plot A). Therefore, choosing the threshold involves a subjective trade off decision: Is incorrectly predicting a patient as being dead (False DEAD, type I error) worse, vs incorrectly predicting a patient as alive (False SURV, type II error)?
Figure 2A:
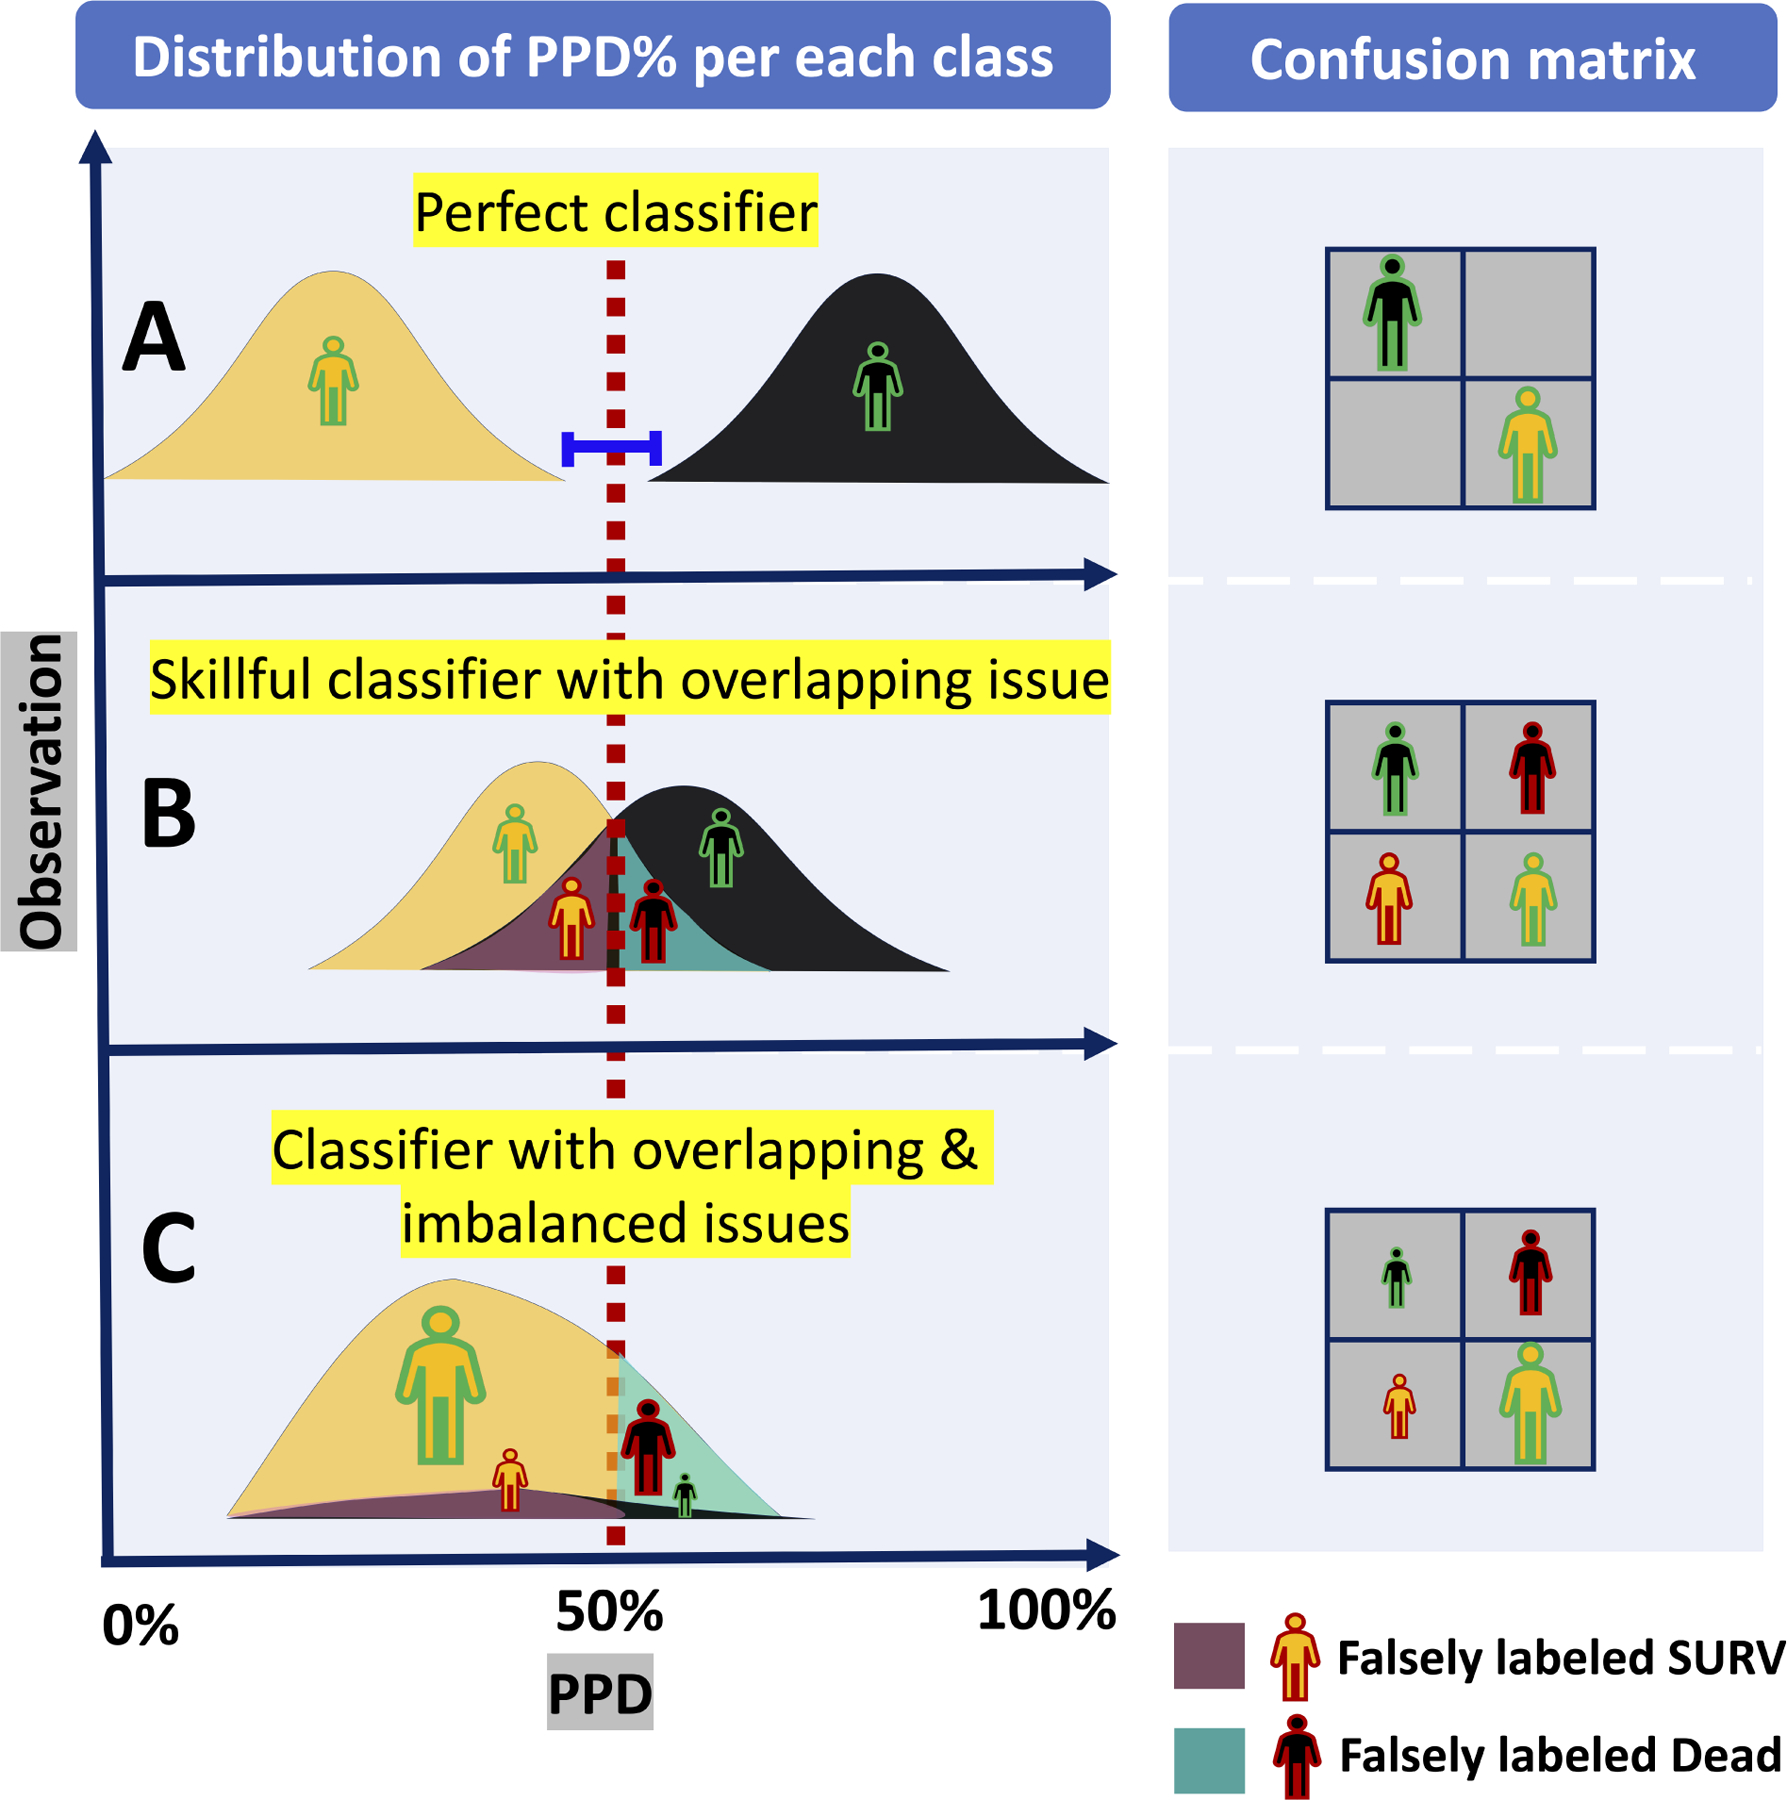
A theoretical example of classifiers’ outcomes with overlap and imbalance issues: (A) Top plot in the left figure shows the outcome of a perfect classifier with no overlap between the distributions of PPD of DEAD class (colored in black) and SURV class (colored in orange). These distributions can be perfectly separated by a threshold, and thus there is no False DEAD or False SURV in its confusion matrix (See top right). (B) Left middle plot shows an imperfect but skillful classifier that generates PPDs with ambiguous overlap in which an intermediate range of probabilities is associated with both (either) class causing some False DEAD and False SURV as it is shown in its corresponding confusion matrix (See right middle plot). (C) Bottom left plot shows a classifier with both overlap and imbalance issues. Comparing with middle plot, the False DEAD is much greater than True DEAD indicating low precision of dead predictions. In addition, the large number of True SURV.
When the data are highly imbalanced, the unequal distribution of classes will compound the problem of overlap and make classification even more challenging. (See Figure 2A, plot C). The LVAD 90-day mortality study introduced in the previous section is an example. Figure 2B shows the histograms of HMRS score (left plot) and RF predicted probability of death, PPD, (right plot) categorized by their actual mortality outcome (DEAD vs SURV). The imbalance issue is clearly visible in Fig 2B inasmuch as the black bars (DEAD class) are much lower than the orange bars (SURV class) in both plots. The PPD generated by RF for all 800 patients in this study (total of both DEAD and SURV) ranges from 0.01 to 0.52 with the mean of 0.15; while HMRS scores range between −1.80 to 6.50 with the mean of 1.71. The means of both distributions are closer to the lower part of their ranges because of the preponderance of SURV class (92%) in the test cohort. The RF was more successful in separating the classes for two reasons: first, the distribution of SURV class in RF is right-skewed and clustered within a narrow band (approximately 0.0 to 0.3; median of approximately 10%). This is contrasted with HMRS whose distributions for both classes are completely overlapping and bell-shaped around the means. Secondly, although the distribution of the DEAD class in RF is relatively flat with no identifiable maximum, the band above 35% is dominated by the DEAD class. Nevertheless, for both plots in Figure 2B, optimizing a cutoff threshold that efficiently separates both classes is not straightforward. By default, any cutoff threshold for both plots in Figure 2B will result in a much larger number of True SURV and False SURV compared to True DEAD and False DEAD. On account of this dilemma (imbalance plus overlap), caution is needed when applying metrics of performance to these classifiers - such as the common ROC.
Figure 2B:
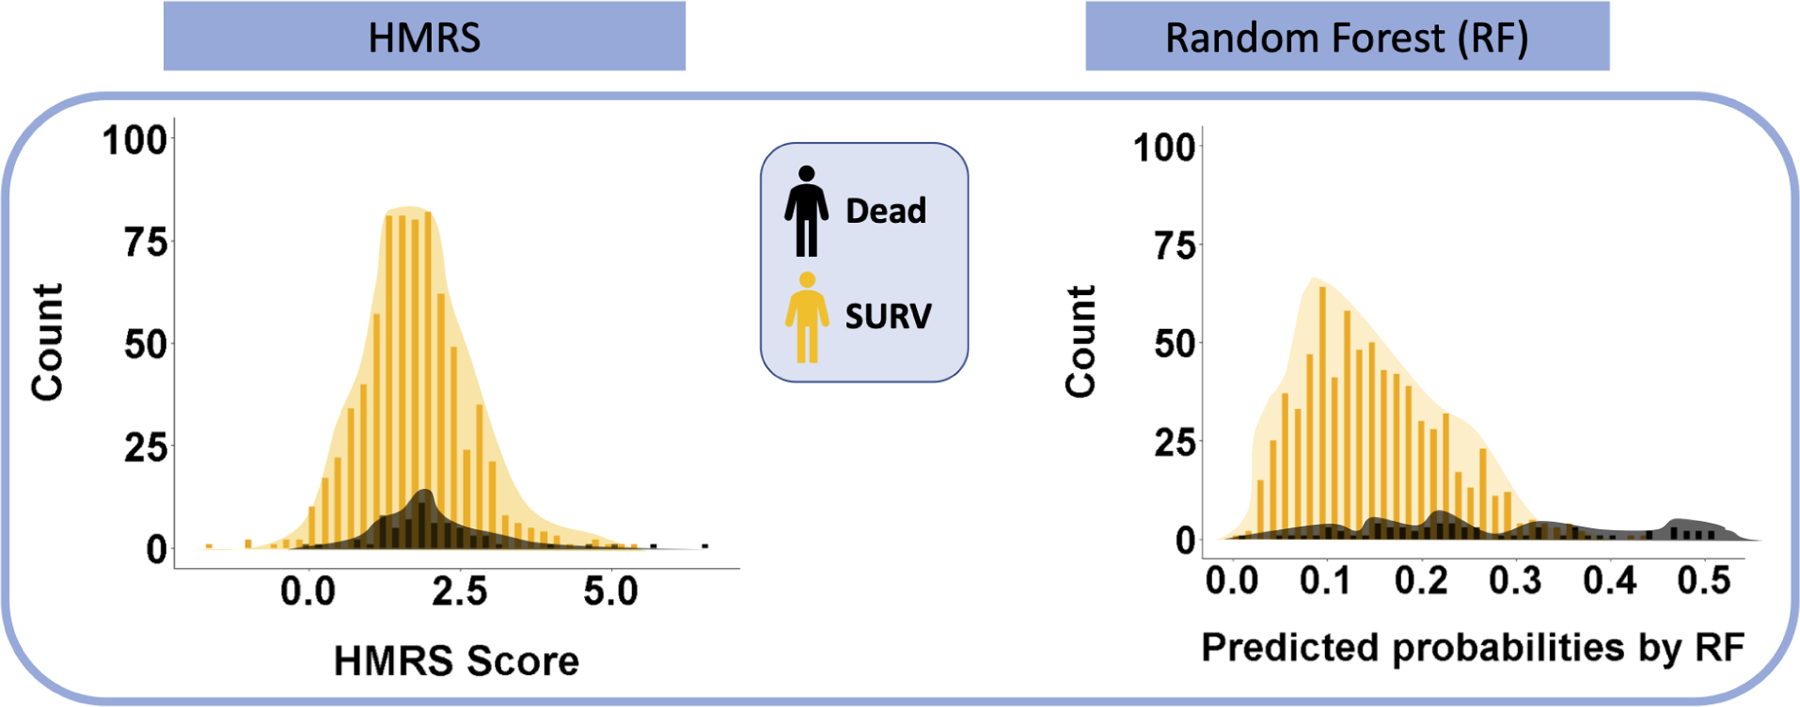
Overlap issue for the outcomes of 90-Day LVAD mortality classifiers- The underlying distributions of HMRS risk scores and RF predicted probabilities of DEAD for 800 patients in this study data are shown histogram plots. The histograms are categorized based on the observed labels for patients in this study.
C. Evaluation tools
Figures 3 and 4 demonstrate the evaluation tools Receiver Operating Characteristic (ROC) and Precision Recall Curve (PRC), respectively. See supplementary appendix A for comprehensive explanation of these tools.
Figure 3:
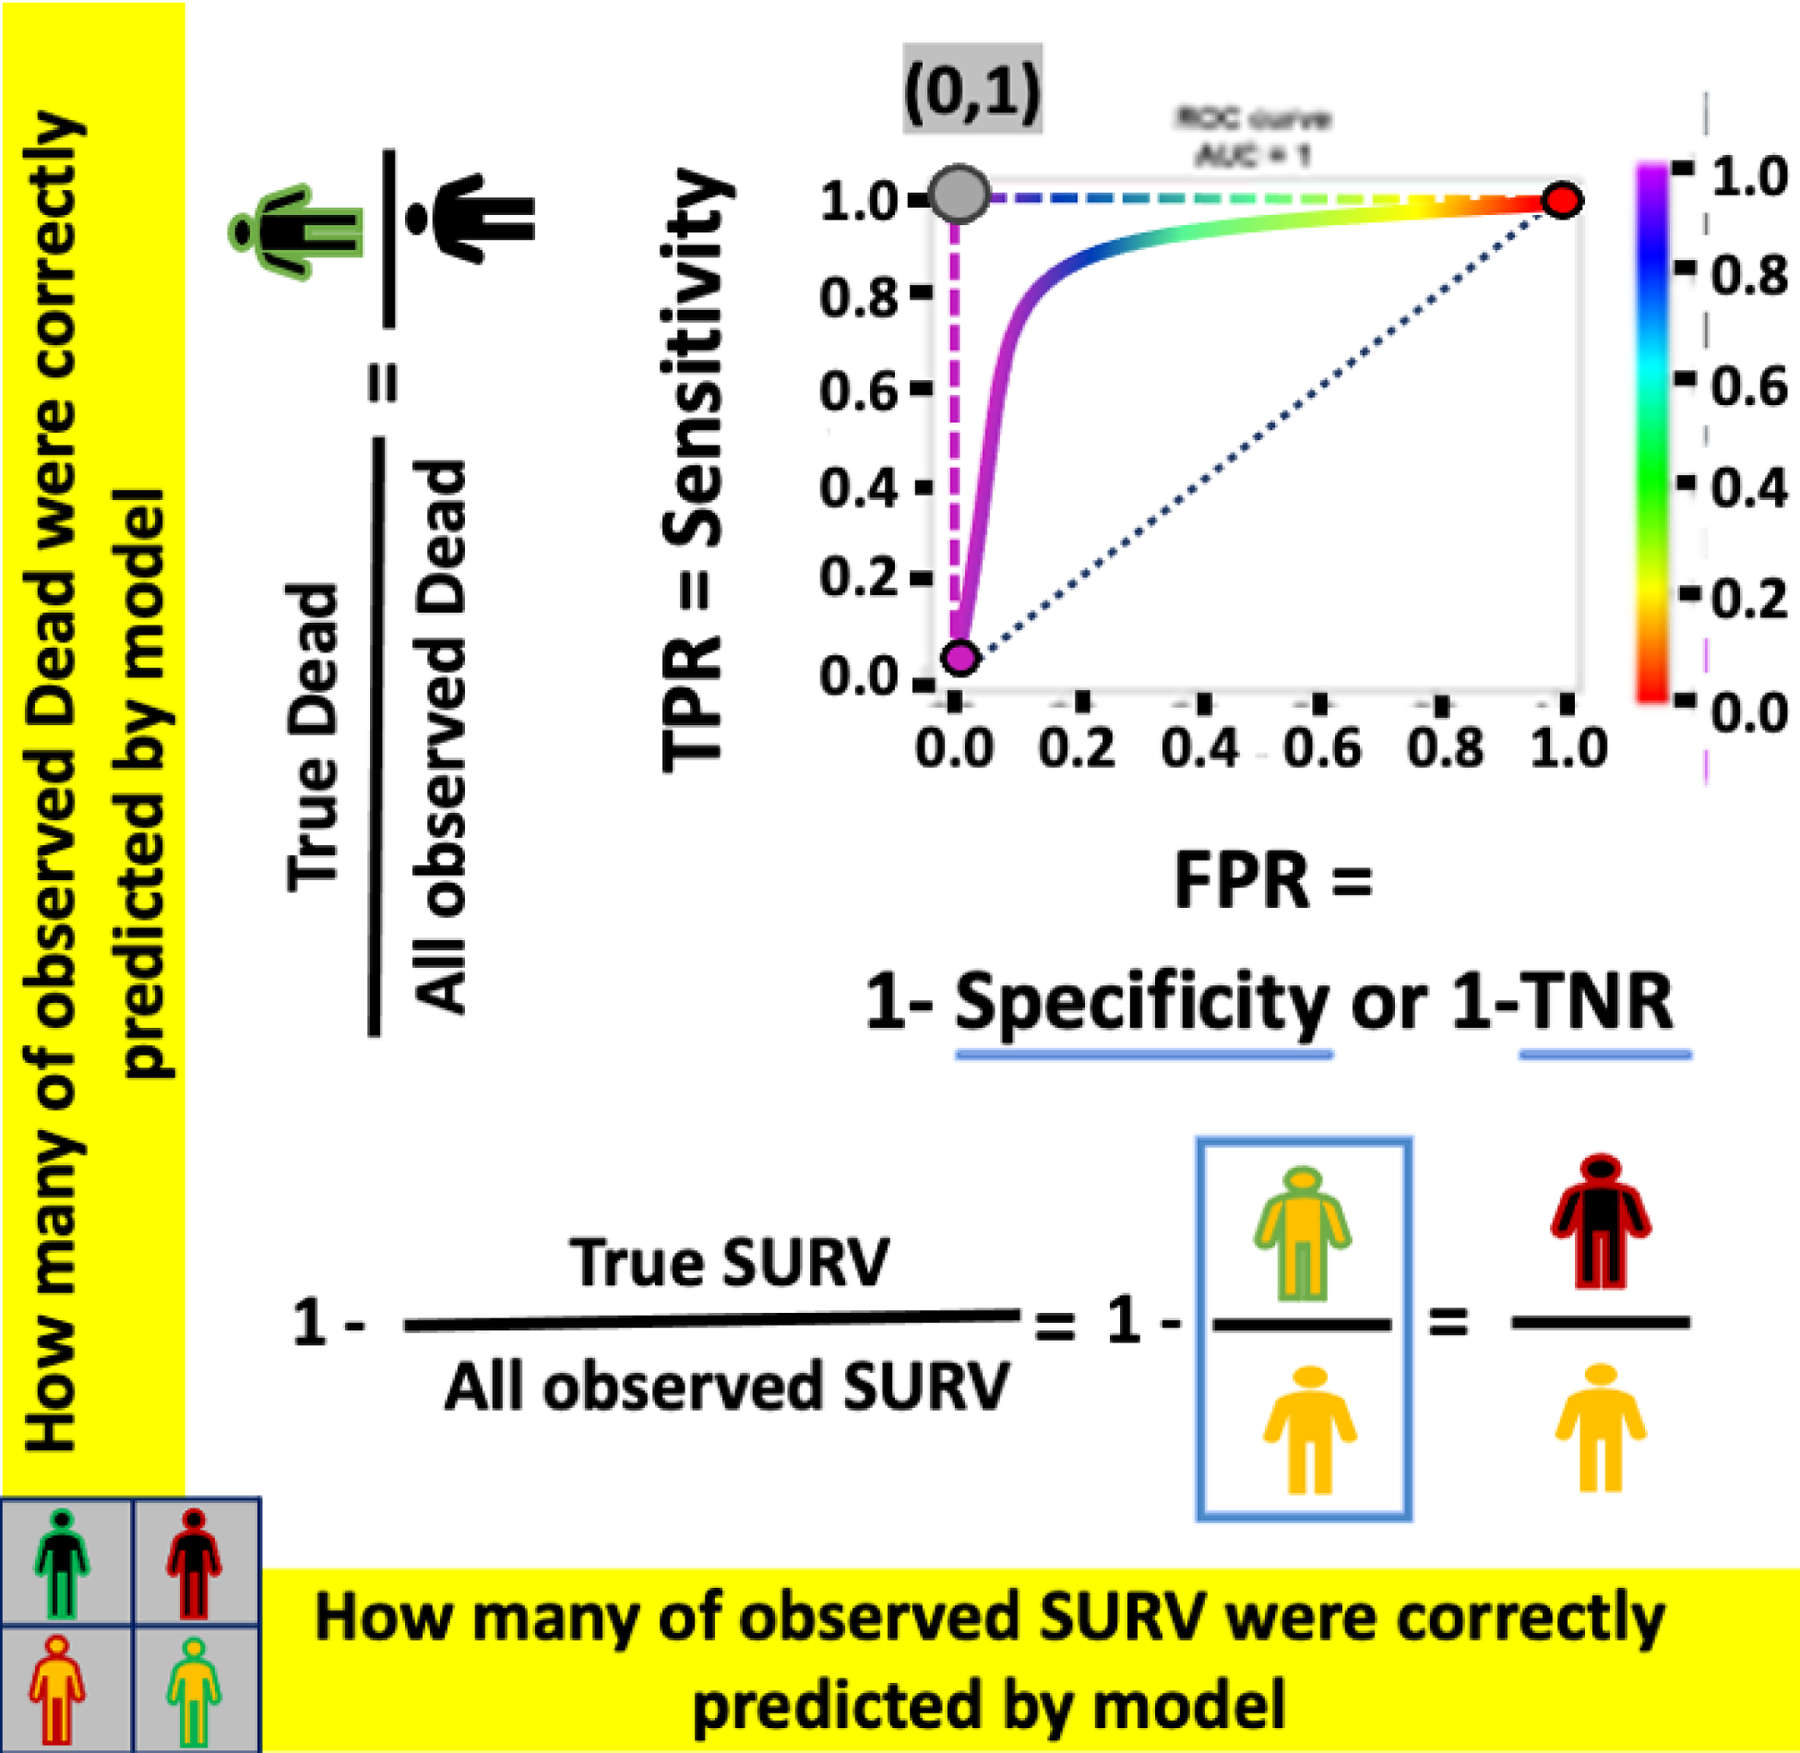
ROC- The example of ROC curves for a perfect classifier (L-shape dashed-curve), an imperfect classifier (solid curve), and a random classifier (diagonal dotted-line).
Figure 4:
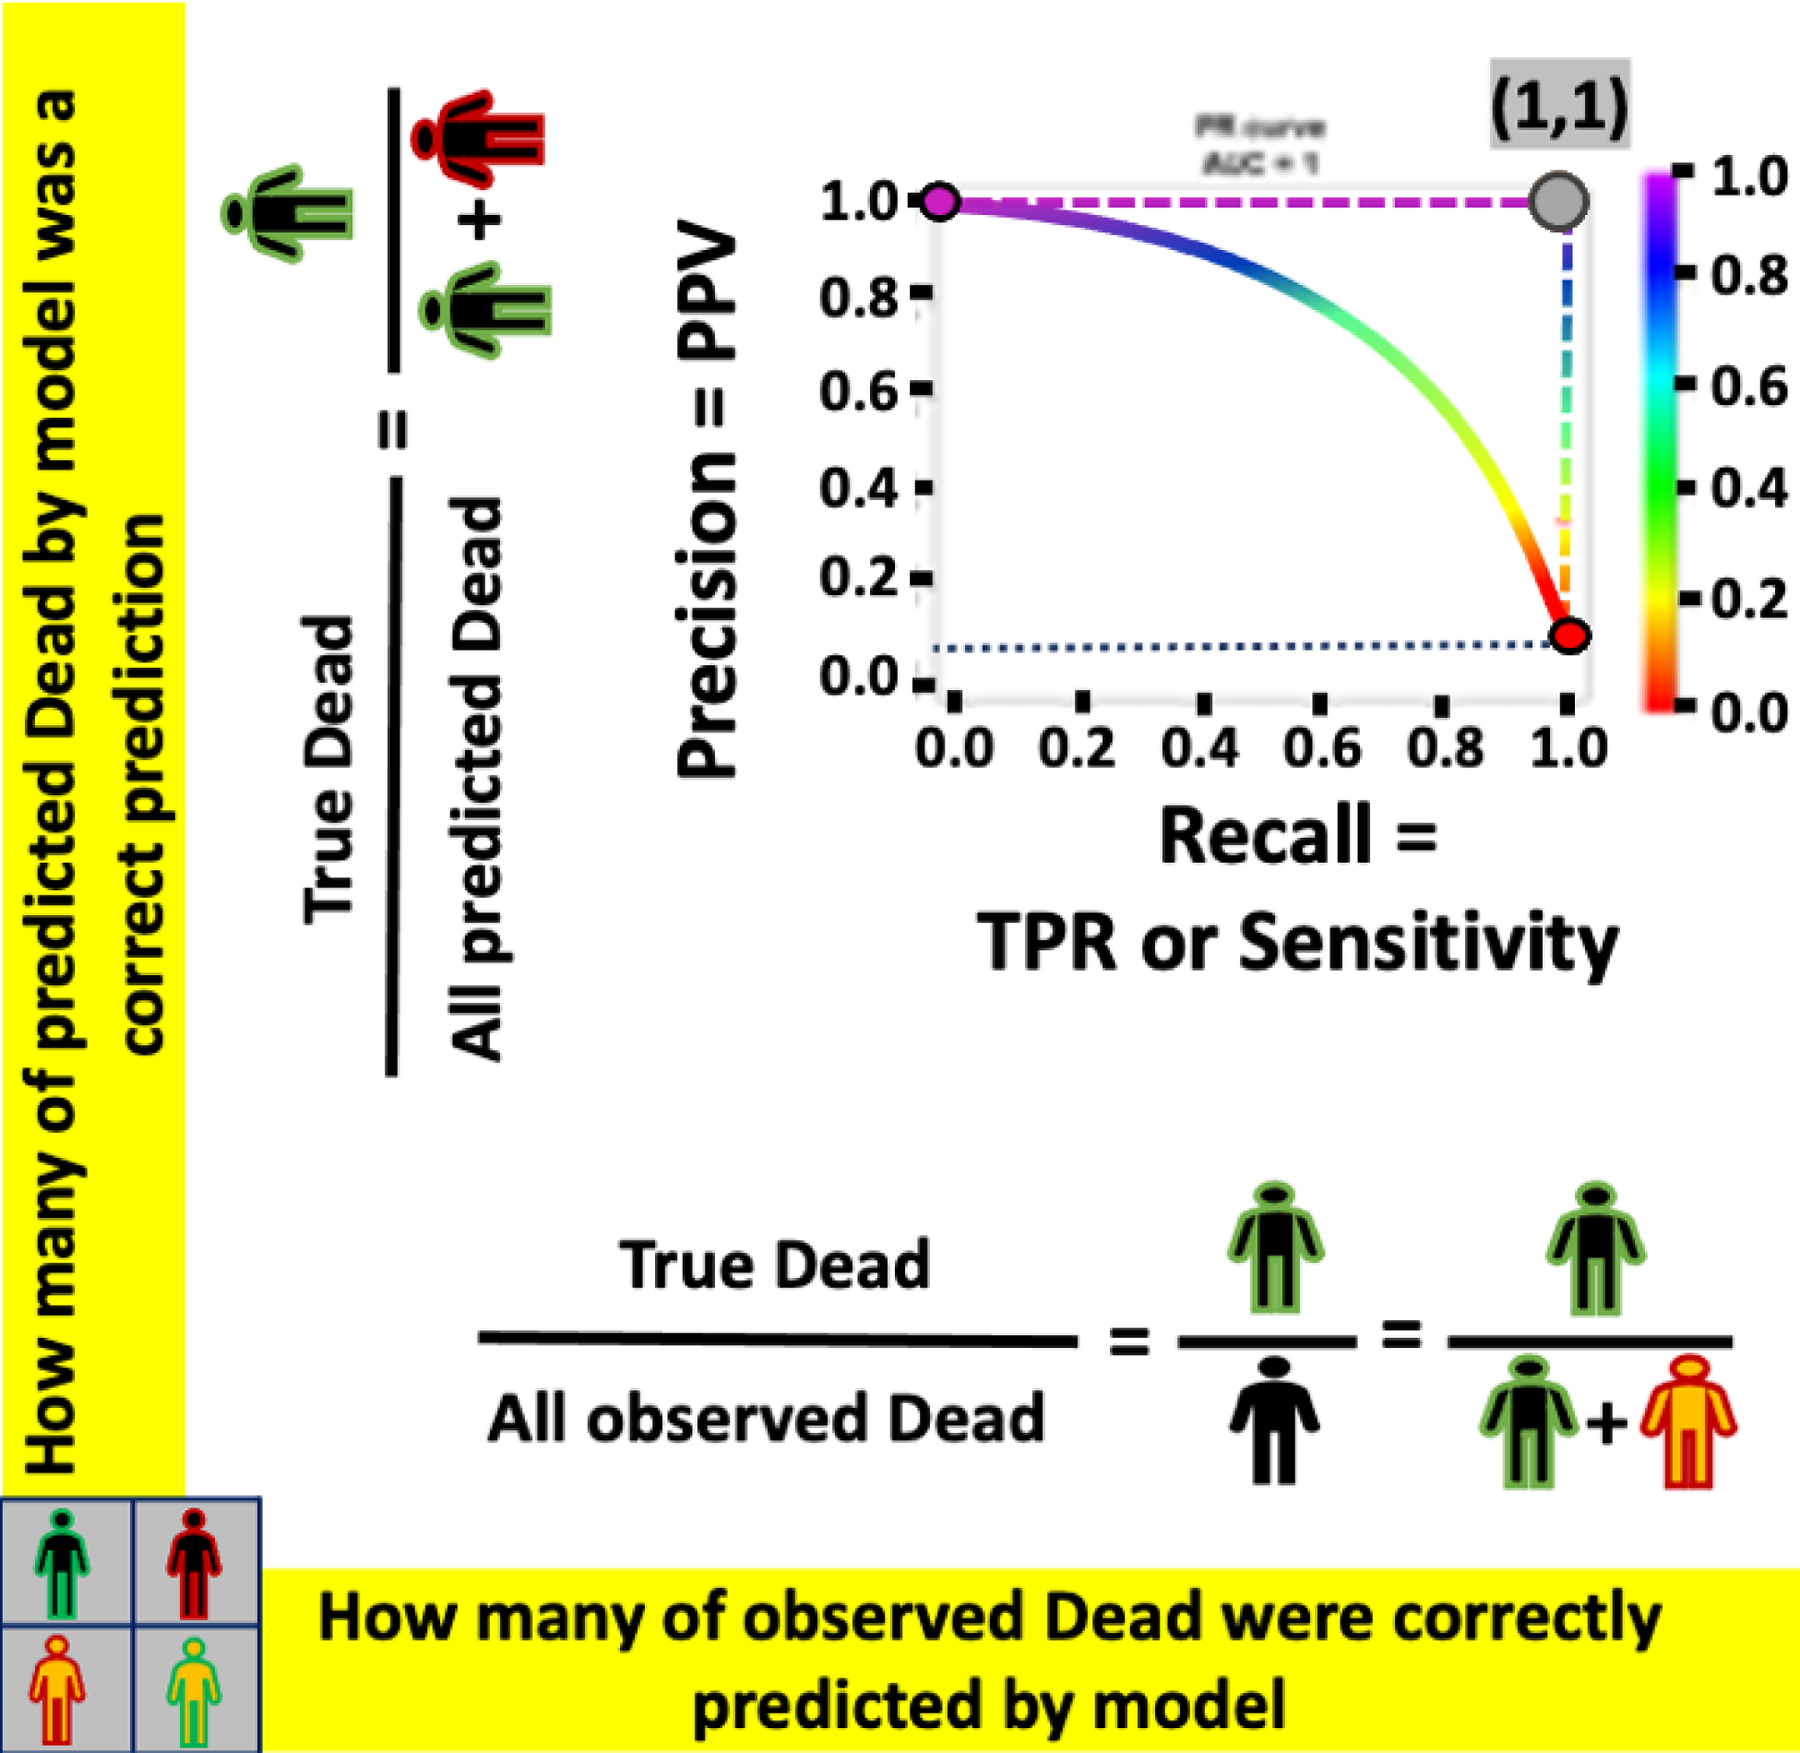
PRC-The example of PRC curves for a perfect classifier (L-shape dashed-curve), an imperfect classifier (solid curve), and a random classifier (horizontal dotted-line).
III. RESULT
A. Limitations of ROC due to imbalanced LVAD mortality rate
Figure 5A shows the ROC curves for the two classifiers, HMRS and RF, for prediction of 90-day mortality after LVAD implantation. The color of the curves corresponds to the values of cutoff thresholds for each classifier, shown in their corresponding legends (from 0.01 to 0.52 for RF vs −1.8 to 6.50 for HMRS). The dominant color in the ROC curve for HMRS is green corresponding to the compact (tall and narrow) distribution of scores around the mean of 1.71 as shown in Figure 2B. Therefore, a small change in cutoff threshold above or below the mean may dramatically change the classifier’s performance. On the other hand, the ROC curve for RF illustrates its performance over a more uniformly distributed range of thresholds, especially for the lower part of the range (less than 30%), corresponding to the right-skewed distribution of predicted probabilities shown in RF’s histogram for SURV class (orange bars) in Figure 2B. The area under the curve (AUC) for these two ROC curves are comparable, although RF is slightly greater (0.77) vs. 0.63 for HMRS, indicating better overall performance of RF in separating DEAD vs. SURV.
Figure 5A:
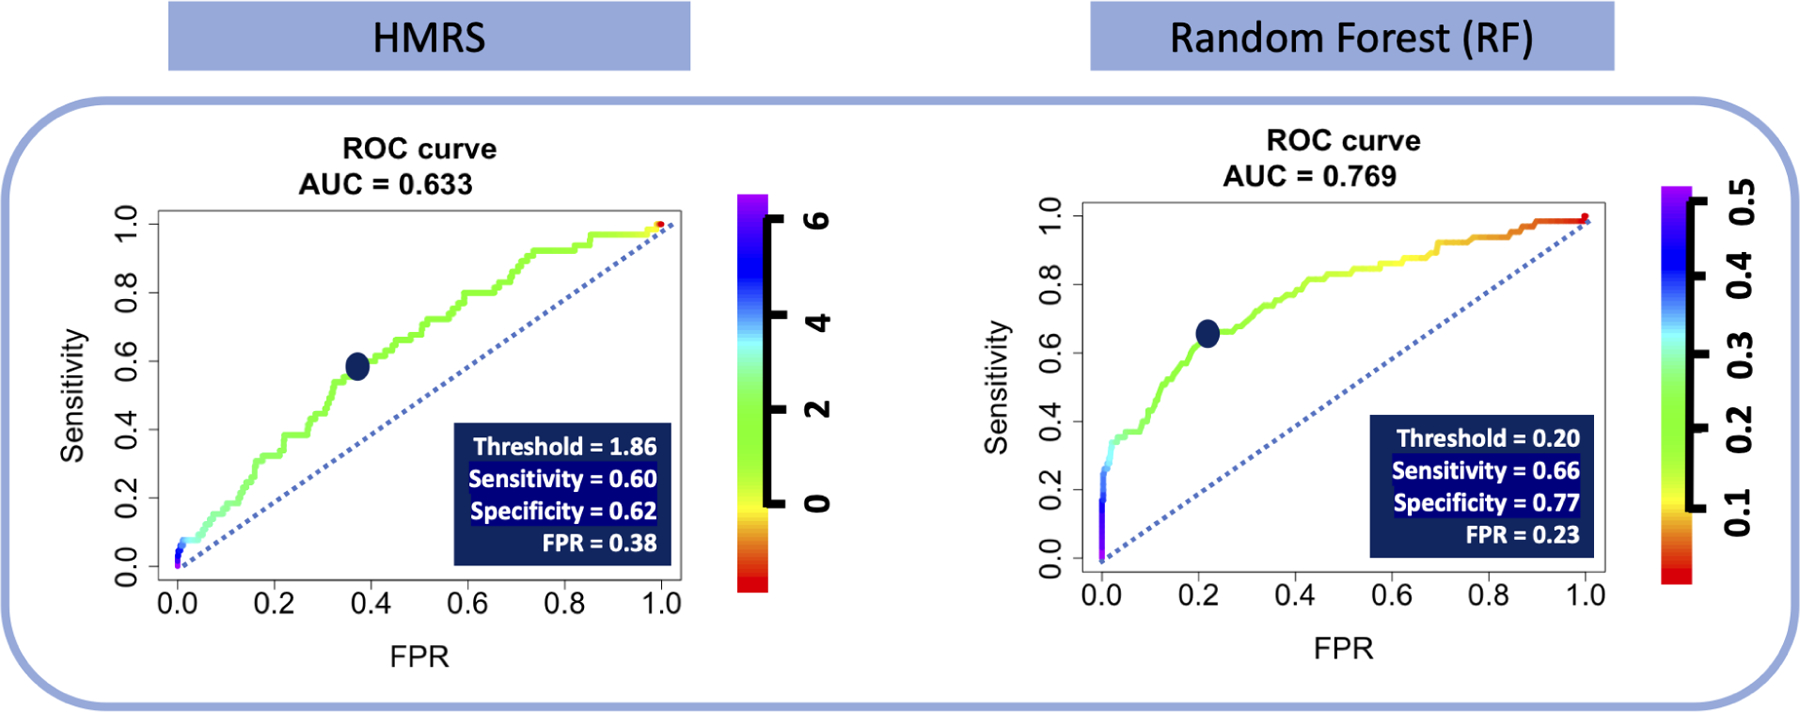
The ROC for HMRS and RF- The dark blue points indicate the optimal cutoff thresholds, detailed in the inset tables.
The two dark blue points on the curves indicates the optimized thresholds where the values of sensitivity and specificity are effectively equalized (1.86 and 0.21 for HMRS and RF, respectively). Although the values of sensitivity for HMRS and RF at the optimized threshold are similar, 0.60 and 0.66, respectively, the corresponding specificity of RF, 0.77, is notably greater than for HMRS, 0.62. Translating these optimized thresholds to histograms of Figure 2B illustrates the efficacy of each classifier in separating the two classes. (See Figure 5B.) Comparison of the two types of errors: False SURV (dead patients incorrectly classified as alive) and False DEAD (alive patients incorrectly classified as dead) reveals that the proportion of False DEAD is much greater than the proportion of False SURV for both classifiers. This is due to a combination of the imbalance of the data (about 92% alive patients) and relatively poor performance of the classifiers. However, the False DEAD is visibly larger for HMRS compared to RF due to the huge overlap between distributions of HMRS scores for DEAD and SURV classes.
Figure 5B:
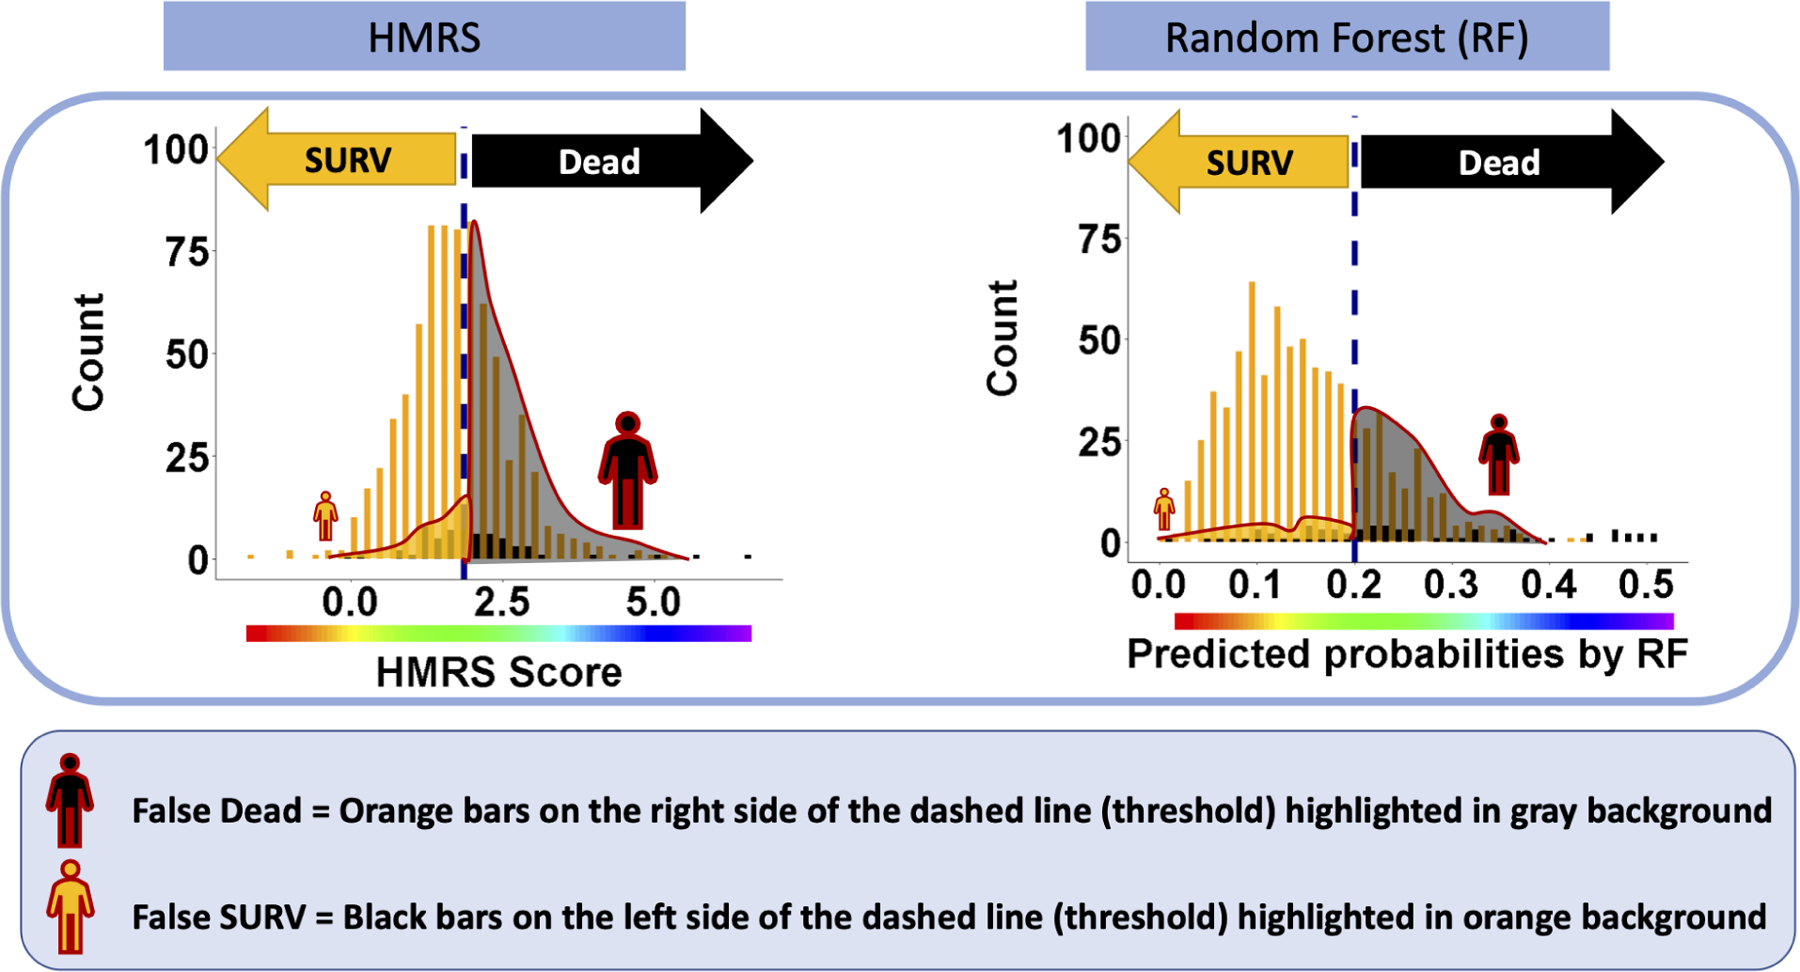
The distributions of false predictions for HMRS and RF classifiers- These histograms are the same histograms in Figure 2B. The dashed lines are corresponding to optimized cutoff thresholds chosen based on ROC curves in Figure 5A. The two types of errors, False DEAD and False SURV associated with this threshold are reflected in black and orange regions with red outline, respectively.
The stark differences revealed by the histograms in Figure 5B are not discernible from comparison of the corresponding ROC curves. For example, a small change in the threshold of the ROC curves in Figure 5A corresponds to a small change in both Sensitivity and FPR. However, Figure 5B reveals that shifting the cutoff from the optimal point (left or right) will result in a much greater change in False DEAD vs False SURV. This is because the denominator of FPR in the ROC curve plots the total number of SURV which is a huge number, thus attenuating the effect of changes in the numerator, False DEAD. In terms of the confusion matrix, this can be restated as the number of False DEAD is being overwhelmed by the much larger number of True SURV – considering that the total observed SURV is the sum of True SURV and False DEAD. (See Figure 2A plot C). Consequently, the ROC curves in Figure 5A do not reveal the dramatic difference in performance between RF and HMRS. Figure 5B clearly shows that RF suffers much less from error of False DEAD than HMRS. In addition, it can be seen that choosing the threshold only based on the ROC curve may cause unintentional effects in the perception of model performance with respect to the minority class. In conclusion, when the ROC is dominated by the majority class (the large proportion of patients that survive), it poorly reflects the performance of the model with respect to the minority class (dead patients), and thus may be a deceptively optimistic evaluation tool in the case of imbalanced data. Therefore, there is clearly a need for a supplemental evaluation tool that is sensitive to skewness in the data and emphasizes the classifier’s performance for the minority class. One such evaluation tool is the Precision-Recall Curve (PRC) [7,8,18].
B. Solution: PRC for imbalanced LVAD mortality rate
A perfect PRC curve is L-shaped indicating that the classifier maintains high precision (Y-axis = 1) as recall or sensitivity (X-axis) increases by change of thresholds. Figure 6shows the PRC curves for the two classifiers, HMRS and RF, for prediction of 90-day mortality after LVAD implant. The colored legends indicate the same threshold values as presented in the ROC curves above (Figure 5A). The PRC for HMRS reveals that the precision drops precipitously to approximately 10% (close to the random classifier: blue dotted line) as recall (sensitivity) increases from 0% to about 10%. This is the result of the severe overlap between the classes in the histogram of HMRS (Figure 2B). This is true even for the greatest scores, which leads to the huge proportion of False DEAD (alive patients incorrectly identified as DEAD). This is contrasted with the PRC of RF which decreases more gradually in precision with increasing recall. Also, it is noted that the PRC of RF remains at nearly 1.0 over a wider range of threshold, i.e. between 0.44 (44%) and 0.51 (51%) corresponding to a range of recall (sensitivity) from 0% to 17%. Therefore, from the perspective of precision-recall it is clearly evident that RF classifier outperforms HMRS with AUC-PRC of 0.43 vs. 0.16.
Figure 6:
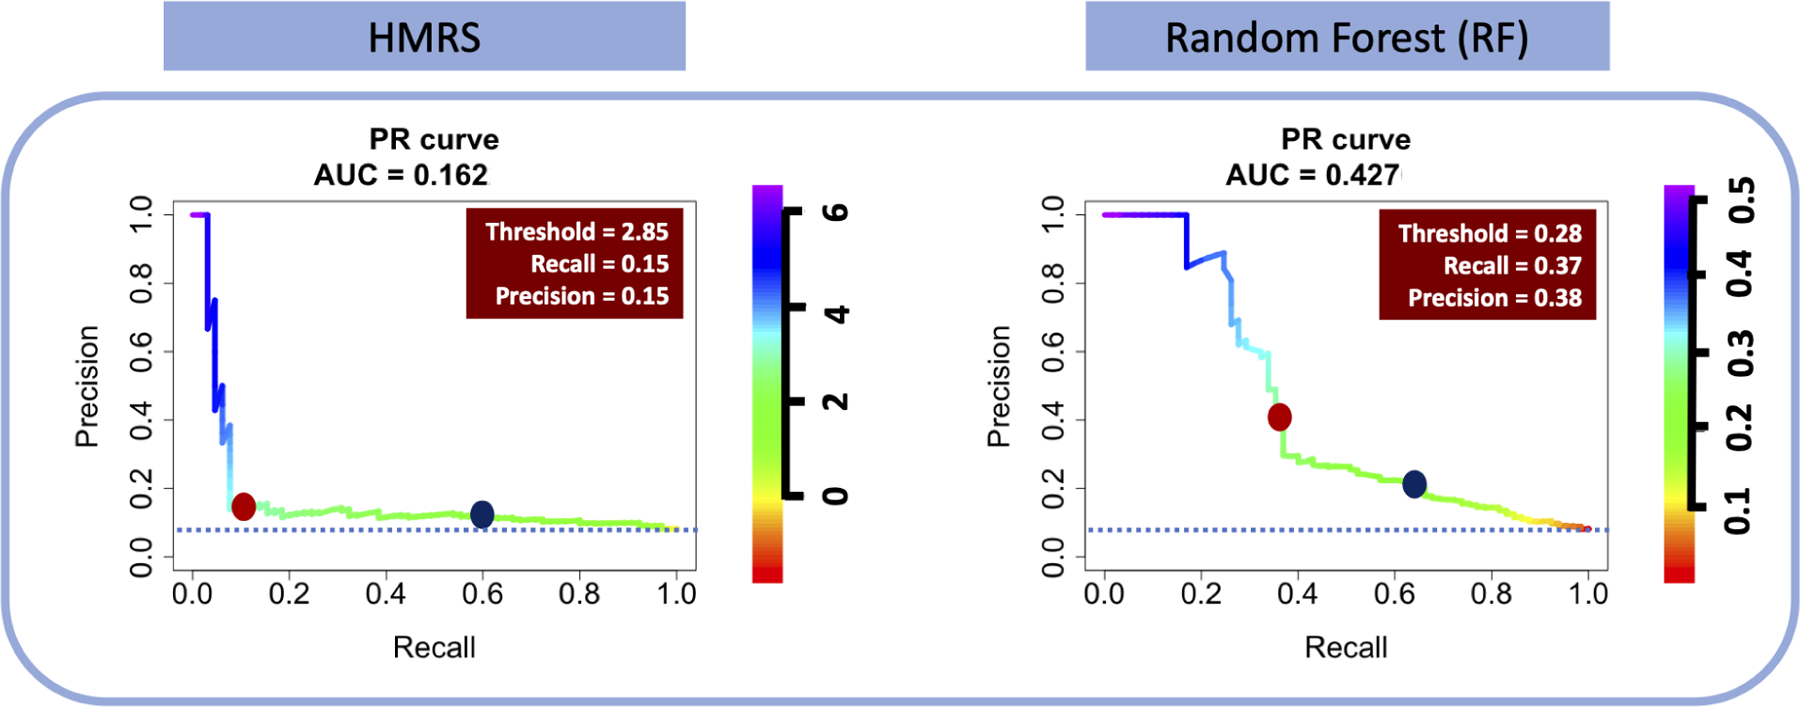
The PRC for HMRS and RF classifiers- The dark blue point on the PRC curves are corresponding to optimized thresholds chosen based on the ROC curves in Figure 5A. The red boxes are the corresponding specifications of red dot points on PRC curves presenting the optimized cutoff thresholds of PRC curves.
The dark blue dots in Figure 6 correspond to optimized thresholds chosen based on the ROC curves in Figure 5A. It is readily seen that the precision of both classifiers at these thresholds is very low, although RF has a better precision, 38%, for achieving the sensitivity of 66% than HMRS with precision less than 10% for sensitivity of 60%. Using these thresholds, the HMRS classifier will correctly identify only 38 out of 64 dead patients (60% sensitivity) in the 800-patient test data set, yet will incorrectly label 308 patients (90% of the 342 patients labeled as DEAD) who are actually alive!
On the other hand, if we assert that precision and recall are equally important, the corresponding optimal cutoff would be indicated by the red dots on PRC curves in Figure 6 for which both precision and recall of HMRS and RF is 15% and approximately 38%, respectively. At these optimized points, the harmonic mean of precision and recall (F1-Score) equals both precision and recall. These optimized points are not necessarily the best way of choosing the threshold since it results in very low levels of recall; however, it illustrates that the choice of threshold depends heavily on the comparative “importance” of sensitivity and precision; hence acceptance/consequence of errors (False DEAD vs False SURV).
IV. DISCUSSION
The clinical utility of a risk score or classifier for mortality following LVAD implantation depends greatly on the degree of separability between predicted probabilities of the two classes: DEAD vs SURV. (See Figure 2A). Overlap between the distributions of the two classes creates an intermediate range of probabilities that is associated with both classes. This results in two types of errors: False DEAD (alive patients who are incorrectly labeled as DEAD) and False SURV (dead patients who are incorrectly labeled as SURV). Therefore, the choice of a threshold is tantamount to choosing between these two types of error. This dilemma is accentuated when the data are highly imbalanced, as is the case of 90-day mortality post-LVAD. (See Figure 2B). The overwhelmingly large size of the majority class, SURV class, amplifies the False DEAD error much more than False SURV. (See Figure 5B). Thus, when choosing a threshold and evaluating the performance of these classifiers, it is very important to focus on the minority class (both True DEAD and False DEAD).
This study illustrated that the ROC, a well-known evaluation tool used for most LVAD risk scores, in the case of imbalanced data, leads to an overly-optimistic perception of the performance of the classifier. This is due to the intuitive but misleading interpretation of specificity: where the large number of False DEAD error is overwhelmed by the huge number of All observed SURV in its denominator. Neglecting the full magnitude of False DEAD generated by a classifier or risk model, i.e precision, could give the clinician false confidence in the prediction of DEAD by the classifier. Unfortunately, most of published pre-LVAD risk scores and classifiers have not reported their precision. Therefore, these scores should be used with extreme caution.
The Precision Recall Curve (PRC) was shown here to be a useful tool to reveal the performance of a classifier for minority class. The PRC plots the proportion of True DEAD to both errors: False DEAD and False SURV. This is in contradistinction with the ROC which has an equal emphasis on both minority and majority classes. PRC is not affected by the overwhelming number of True SURV (majority class), and thus it does not generate a misleadingly optimistic perception performance, as does the ROC. The utility of the PRC was illustrated with two classifiers for 90-day mortality following LVAD implantation that both suffer from imbalanced data: the well-known HMRS and a de-novo RF classifier derived from INTERMACS’ much larger data.
The preceding is not an indictment of ROC, but a revelation that ROC fails to paint a complete picture of a classifier’s performance. Therefore, ROC provides a view of classifiers’ performance with both minority and majority classes while PRC provides a view of classifiers’ performance on minority class which becomes more important and informative when dealing with imbalanced data.
It would be valuable to mention that though ROC and PRC together can comprehensively evaluate the prediction power of a model, neither of ROC nor PRC are affected by calibration as they are ranking-based measurements. However, if desirable to calibrate the model, other evaluation measures, such as Brier Score, could be used.
Clinical Perspectives
Using any classifier for mortality following LVAD implantation inevitably involves choosing a threshold. From a clinical perspective this translates to a conscious decision between risk of inserting an LVAD in a patient who will die due to misplaced faith in the classifier (False SURV); versus denying a patient from a potentially life-saving LVAD because of a false presumption of death (False DEAD) by the classifier. This is an ethical dilemma. If the clinician chooses a conservative threshold, so as to avoid False SURV, he/she will mitigate the risk of accelerating a patient’s death by inserting an LVAD, however he/she is at a loss for a classifier to evaluate the alternatives. This situation begs for a more holistic approach to stratification of patients with severe heart failure, to provide comparison, or ranking of alternatives, such as the use of a temporary support device as a bridge to VAD. Because VADs are one of the most expensive therapies in medicine, overly optimistic projections of survival could adversely affect cost (per quality adjusted life years, QALY), and potentially return to haunt the field in the future if costs are much higher than had been predicted.
Another consideration that highly affects the tradeoff between False SURV (False Negative) and False DEAD (False Positive) is the intended role of classifier in the clinical assessment of pre-LVAD patients. For example, the initial screening test for HIV has a high sensitivity because of the importance of avoiding False Negative. But among those with positive initial screening test, there exist patients who do not actually have HIV (False Positive). Thus, patients with positive initial tests are reassessed with a much more precise diagnostic test with lower False Positive rate to confirm the HIV diagnosis. Therefore, as a screening tool, sensitivity is most important (avoiding False Negative); but as a diagnostic tool, precision is more important, to avoid False Positives. By analogy to the pre-LVAD classifier, the choice of threshold might be situation-specific: more conservative as a screening tool, and less so as a definitive diagnostic tool. In conclusion, there is a need for future studies to comprehensively investigate the role of pre-LVAD risk assessment in clinical decisions by considering all-inclusive aspects of their clinical settings.
Limitations
The problem of classifier development with imbalanced data is well-known area of research in many disciplines, including medicine [10]–[13], and was most recently recognized by Ishwaran in the context of cardiovascular surgery [14]–[16]. Accordingly, there exists a variety of approaches to mitigate the effects of imbalance such as resampling methods, assigning weights to minority samples, one-class classifier, etc. [19]–[22]. In addition, there have been studies investigating optimization of threshold choice for imbalanced data such as the quantile-classifier proposed by Ishwaran et al. to optimize the G-mean [23]. This study did not attempt to employ any of these methods; however, it would be beneficial in future studies to explore various strategies to achieve the best performance of LVAD classifiers. We also acknowledge that there exist other evaluation metrics, such as G-mean, PRC, and relative PRC, recently recommended by Ishwaran [14] as well as cost curve [22] and concentrated ROC [24], which were not explored in this study, but worthy of future consideration.
V. CONCLUSION
ROC has become an entrenched evaluation tool for assessing the performance of classifiers and risk scores in the medical arena. However, when the data is highly imbalanced, ROC can provide a misleading optimistic view of the performance of the classifiers. In such circumstances, it is imperative to employ PRC to precisely evaluate the prediction of the minority class. Figure 7 depicts a summary of the study showing the effect of imbalanced data on the outcome of RF classifier.
Figure 7:
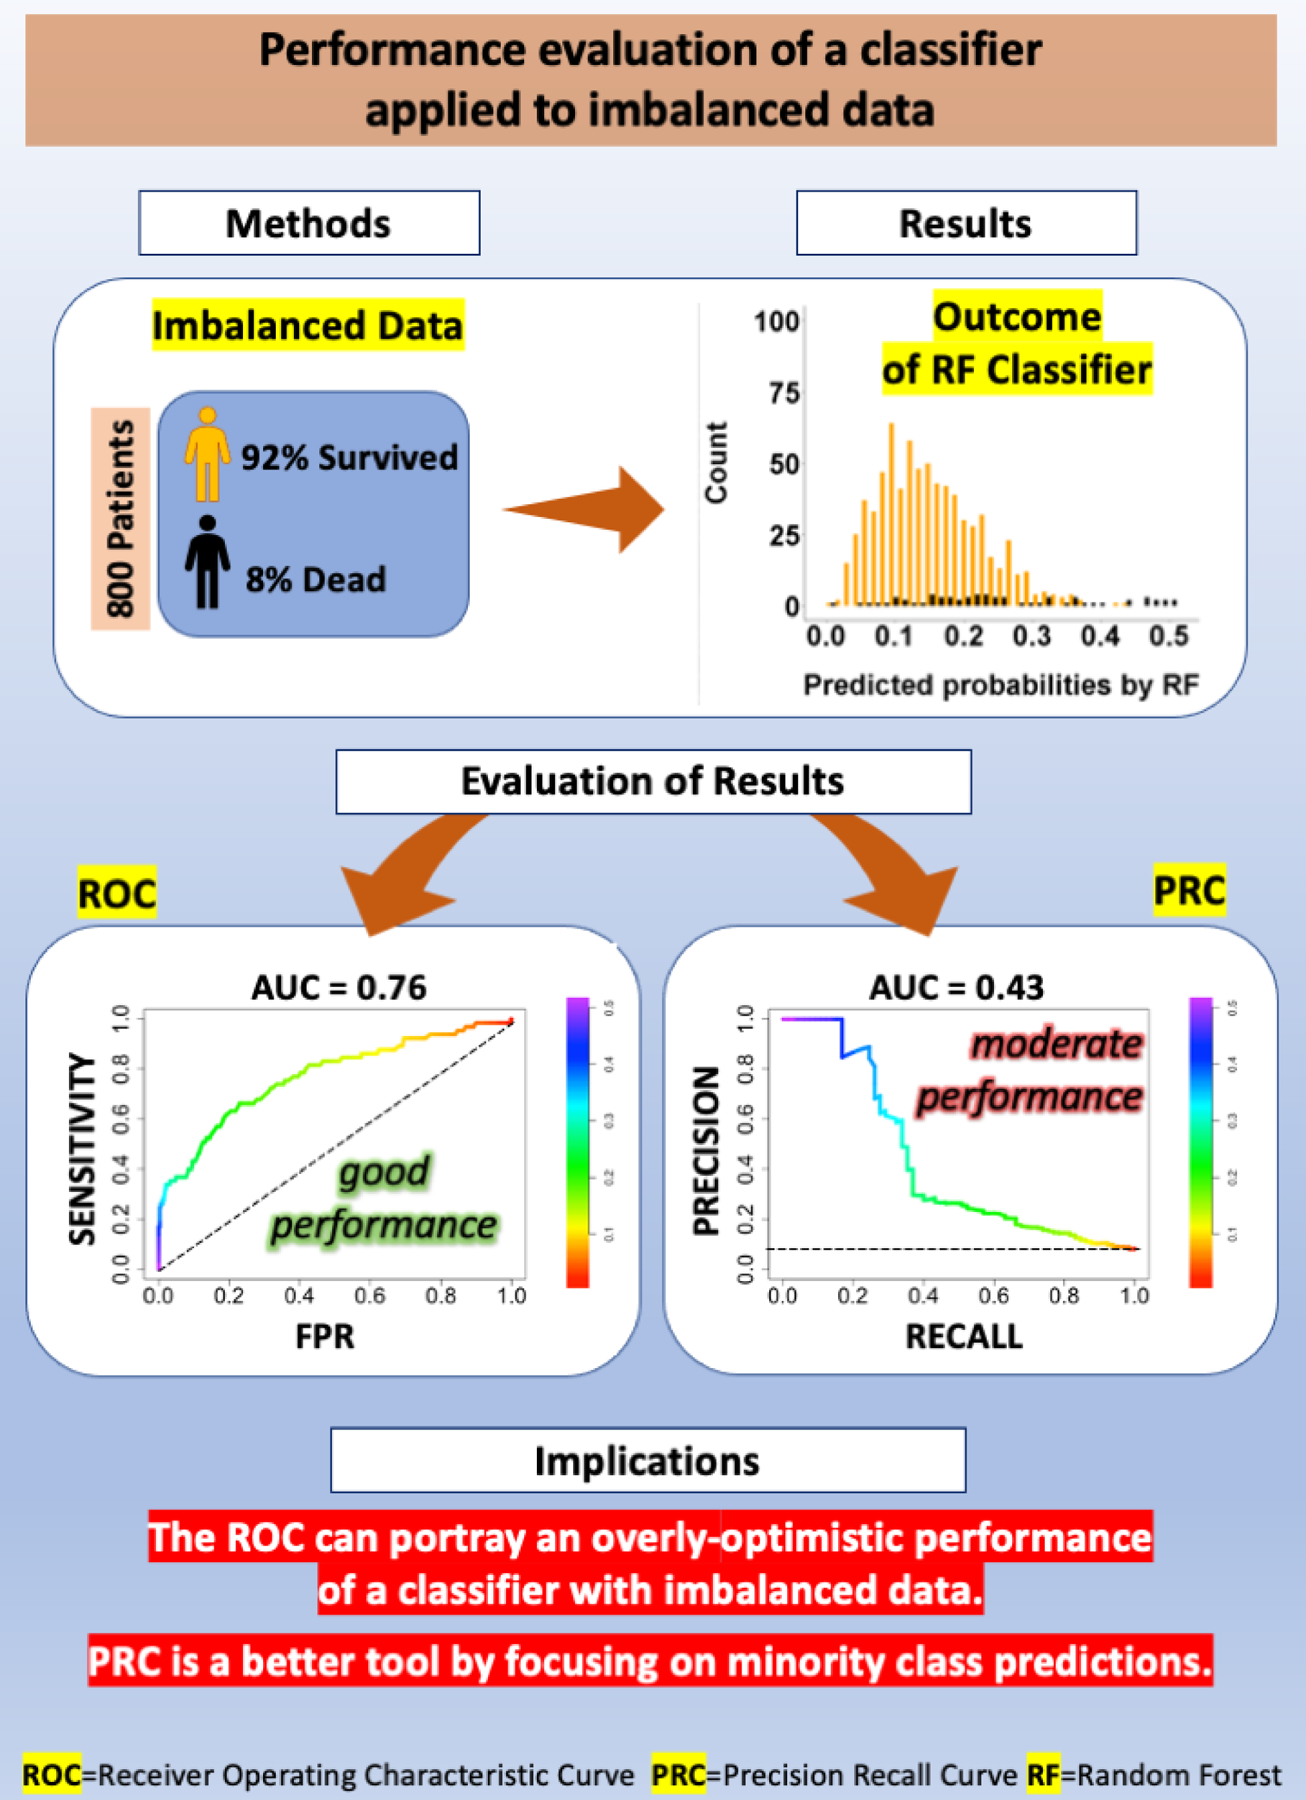
Pictorial summary of the study demonstrating the effect of imbalanced data on the outcome of a Random Forest (RF) classifier. Method: 92% of the 800 patients used in this study to test the RF classifier survived to 90 days and only 8% of patients were dead at 90 days. Result: The plot of predicted probabilities by RF categorized by their real labels illustrates the issues of imbalance and overlap of the two classes. Evaluation of Results: While Receiver operating characteristic (ROC) indicated an acceptable performance for RF (AUC= 0.77), the Precision Recall Curve (PRC) revealed moderate performance (AUC= 0.43).
Supplementary Material
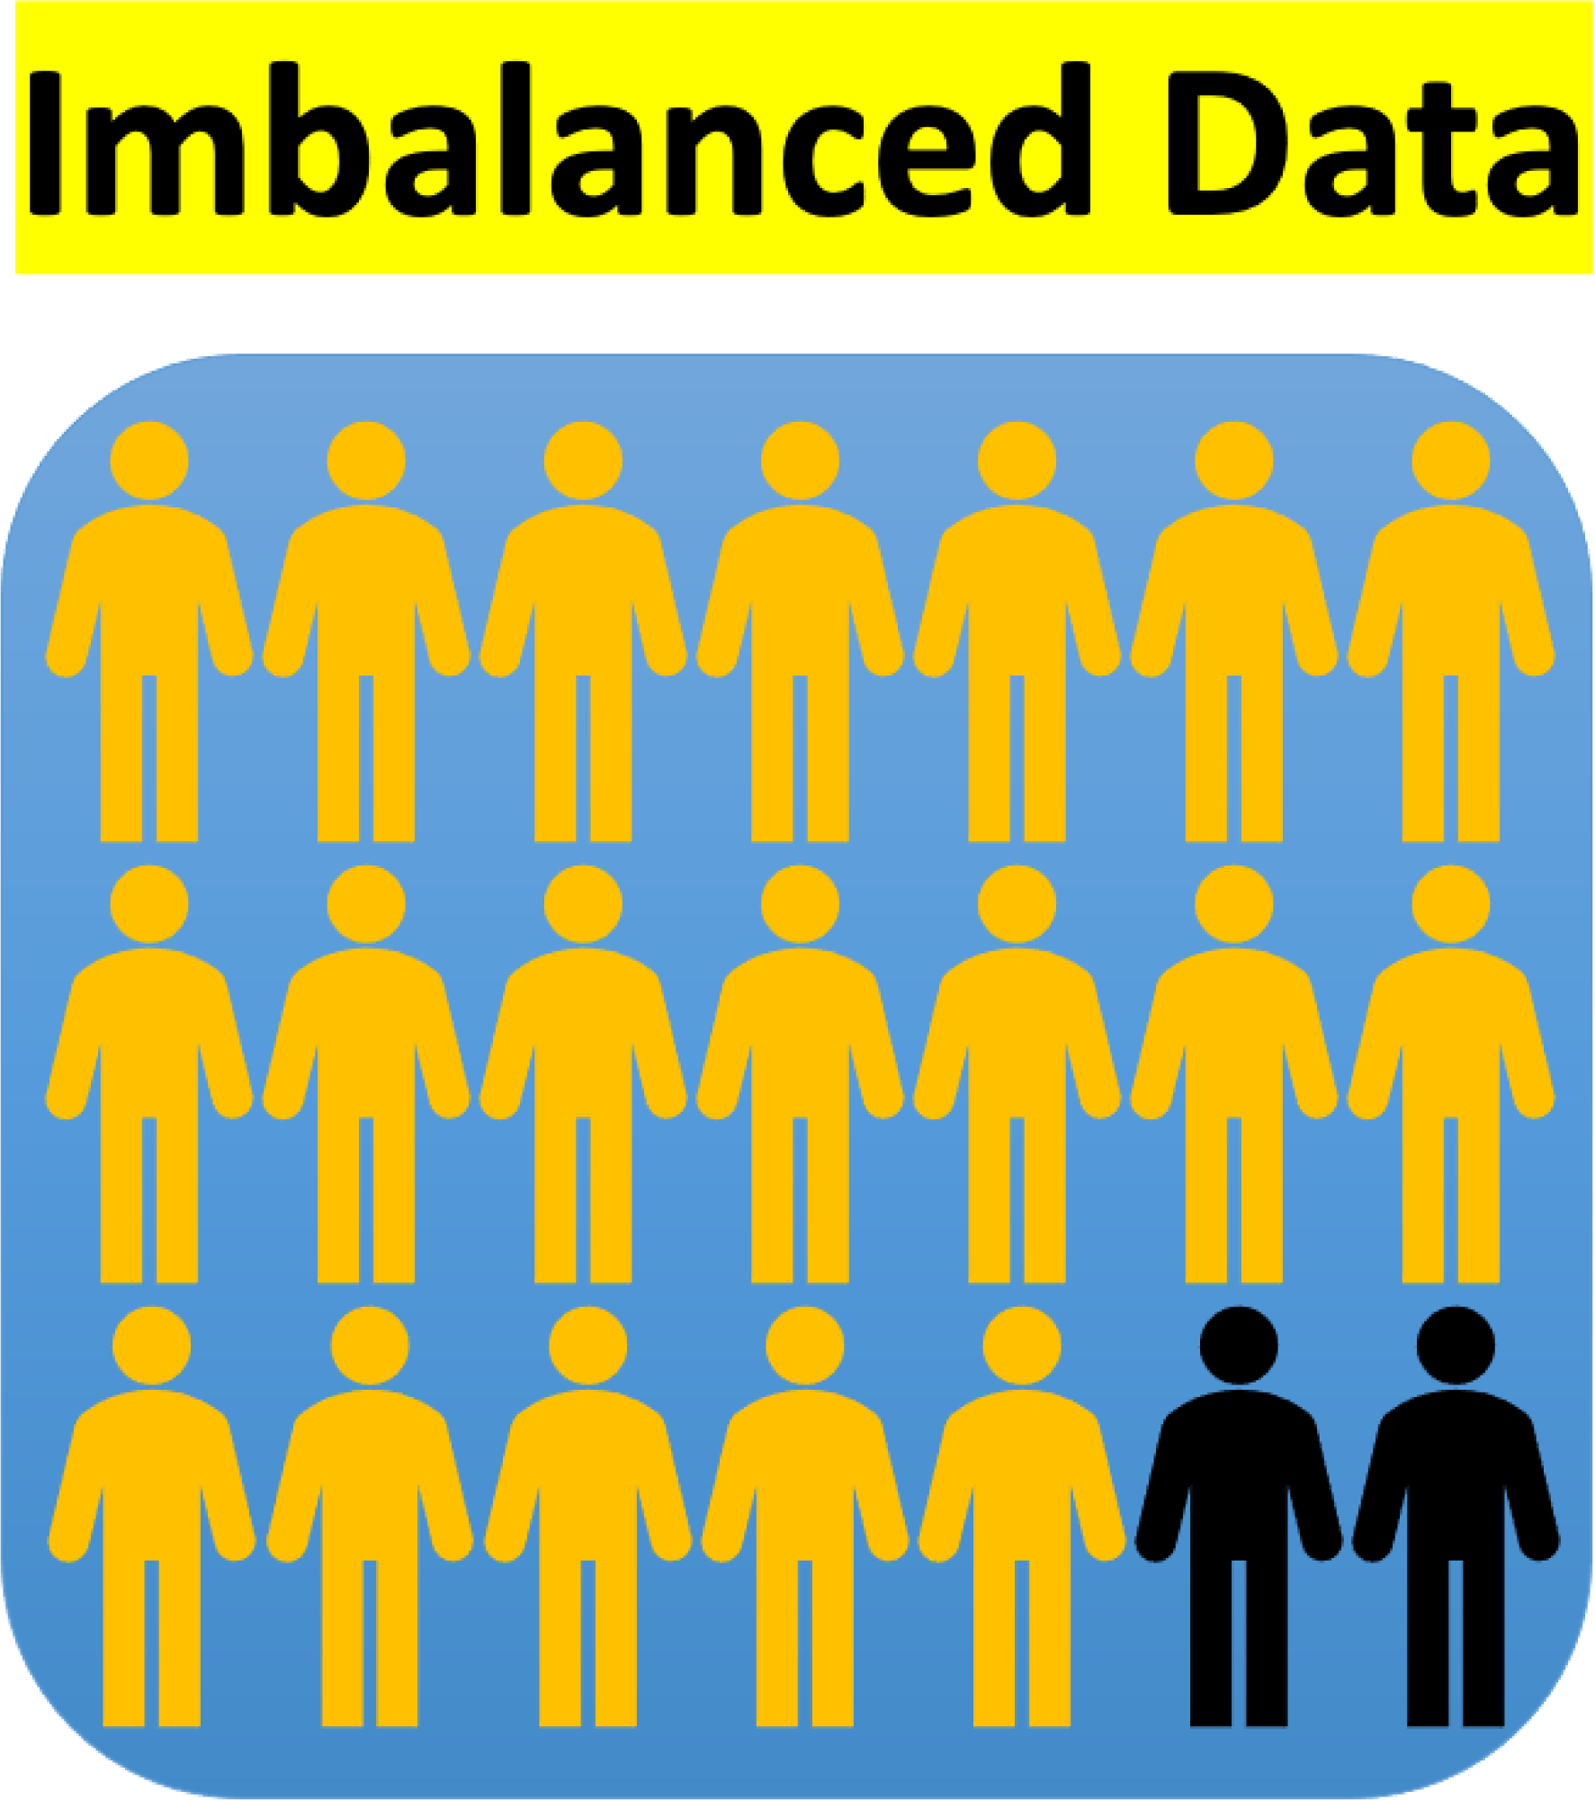
Abbreviated legend for Central Picture:
Imbalanced issue when there is an unequal distribution of classes in the data.
Central Message:
The ROC can portray an overly-optimistic performance of a classifier or risk score when applied to imbalanced data such as mortality risk scores after LVAD implant for patients with heart failures.
Perspective Statement:
Using any classifier for mortality inevitably involves making a conscious decision between two type of errors, False SURV versus False DEAD, by the classifier. This study illustrated that the ROC, a well-known evaluation criterion used to choose between these two errors, leads to an optimistic perception of the performance of the classifier in the case of imbalanced data.
VI. ACKNOWLEDGMENT
This work was supported by the National Institutes of Health under Grant R01HL122639. Data for this study were provided by the International Registry for Mechanical Circulatory Support (INTERMACS), funded by the National Heart, Lung and Blood Institute, National Institutes of Health and The Society of Thoracic Surgeons.
Funding statement
This work was supported by the National Institutes of Health under Grant R01HL122639.
Glossary of Abbreviations:
- ROC
Receiver Operating Characteristic
- PRC
Precision Recall Curve
- AUC
Area Under Curves
- LVAD
Left Ventricular Assist Device
- HMRS
HeartMate Risk Score
- RF
Random Forest
- INTERMACS
Interagency Registry for Mechanically Assisted Circulatory Support
- PPD
Predicted Probabilities of DEAD
- PL
Predicted Labels
- TNR
True Negative Rate
- TPR
True Positive Rate
- FPR
False Positive Rate
- PPV
Positive Predictive Value
Footnotes
Publisher's Disclaimer: This is a PDF file of an unedited manuscript that has been accepted for publication. As a service to our customers we are providing this early version of the manuscript. The manuscript will undergo copyediting, typesetting, and review of the resulting proof before it is published in its final form. Please note that during the production process errors may be discovered which could affect the content, and all legal disclaimers that apply to the journal pertain.
Disclosure
All authors disclose any relationship with industry and other relevant entities—financial or otherwise—within the past 2 years that might pose a conflict of interest in connection with the submitted article.
A statement of the Patients’ Informed Written Consent
This study was waived from Informed Written Consent
REFERENCES
- [1].Cowger J, Sundareswaran K, Rogers JG et al. , “Predicting survival in patients receiving continuous flow left ventricular assist devices: the heartmate ii risk score,” J. Am. Coll. Cardiol, vol. 61, no. 3, pp. 313–321, 2013. [DOI] [PubMed] [Google Scholar]
- [2].Loghmanpour NA, Kanwar MK, Druzdzel MJ et al. , “A new Bayesian network-based risk stratification model for prediction of short-term and long-term LVAD mortality,” ASAIO J, vol. 61, no. 3, p. 313, 2015. [DOI] [PMC free article] [PubMed] [Google Scholar]
- [3].Ravichandran AK and Cowger J, “Left ventricular assist device patient selection: do risk scores help?” J. Thorac. Dis, vol. 7, no. 12, p. 2080, 2015. [DOI] [PMC free article] [PubMed] [Google Scholar]
- [4].Kirklin JK, Pagani FD, Kormos RL et al. , “Eighth annual INTERMACS report: Special focus on framing the impact of adverse events,” J. Heart Lung Transplant, vol. 36, no. 10, pp. 1080–1086, 2017. [DOI] [PubMed] [Google Scholar]
- [5].Weng CG and Poon J, “A new evaluation measure for imbalanced datasets,” in Proc. 7th AusDM, 2008, pp. 27–32.
- [6].Berrar D and Flach P, “Caveats and pitfalls of roc analysis in clinical microarray research (and how to avoid them),” Brief. bioinformatics, vol. 13, no. 1, pp. 83–97, 2012. [DOI] [PubMed] [Google Scholar]
- [7].Saito T and Rehmsmeier M, “The precision-recall plot is more informative than the roc plot when evaluating binary classifiers on imbalanced datasets,” PloS one, vol. 10, no. 3, p. e0118432, 2015. [DOI] [PMC free article] [PubMed] [Google Scholar]
- [8].Davis J and Goadrich M, “The relationship between precision-recall and roc curves,” in Proc. the 23rd ICML, 2006, pp. 233–240.
- [9].Abdallah A, Maarof MA, and Zainal A, “Fraud detection system: A survey,” J. Netw. Comput. Appl, vol. 68, pp. 90–113, 2016. [Google Scholar]
- [10].Mazurowski MA, Habas PA, Zurada JM et al. , “Training neural network classifiers for medical decision making: The effects of imbalanced datasets on classification performance,” Neural Netw, vol. 21, no. 2–3, pp. 427–436, 2008. [DOI] [PMC free article] [PubMed] [Google Scholar]
- [11].Zhang L, Yang H, and Jiang Z, “Imbalanced biomedical data classification using self-adaptive multilayer ELM combined with dynamic GAN,” Biomed. Eng. Online, vol. 17, no. 1, p. 181, 2018. [DOI] [PMC free article] [PubMed] [Google Scholar]
- [12].Gao T, Hao Y, Zhang H et al. , “Predicting pathological response to neoadjuvant chemotherapy in breast cancer patients based on imbalanced clinical data,” Pers. Ubiquit. Comput, vol. 22, no. 5–6, pp. 1039–1047, 2018. [Google Scholar]
- [13].Fotouhi S, Asadi S, and Kattan MW, “A comprehensive data level analysis for cancer diagnosis on imbalanced data,” J. Biomed. Inform, vol. 90, p. 103089, 2019. [DOI] [PubMed] [Google Scholar]
- [14].Ishwaran H and Blackstone EH, “Commentary: Dabblers: Beware of hidden dangers in machine-learning comparisons,” J Thorac Cardiovasc Surg, 2020. [DOI] [PMC free article] [PubMed]
- [15].Ishwaran H and O’Brien R, “Editorial commentary: the problem of class imbalance in biomedical data,” J Thorac Cardiovasc Surg, vol. 1, p. 2, 2020. [DOI] [PMC free article] [PubMed] [Google Scholar]
- [16].Ishwaran H and O’Brien R, “Letter to the editor: the standardization and automation of machine learning for biomedical data,” J Thorac Cardiovasc Surg, 2020. [DOI] [PMC free article] [PubMed]
- [17].Breiman L, “Random forests,” Mach. Learn, vol. 45, no. 1, pp. 5–32, 2001. [Google Scholar]
- [18].Cook J and Ramadas V, “When to consult precision-recall curves,” SJ, vol. 20, no. 1, pp. 131–148, 2020. [Google Scholar]
- [19].Fernandez A, Garcıa S, Galar M et al. , Learning from imbalanced data sets Springer, 2018. [Google Scholar]
- [20].Lopez V, Fernandez A, Garcıa S et al. , “An insight into classification with imbalanced data: Empirical results and current trends on using data intrinsic characteristics,” Inf. Sci, vol. 250, pp. 113–141, 2013. [Google Scholar]
- [21].Krawczyk B, “Learning from imbalanced data: open challenges and future directions,” Prog. Artif. Intell, vol. 5, no. 4, pp. 221–232, 2016. [Google Scholar]
- [22].Guo H and Viktor HL, “Learning from imbalanced data sets with boosting and data generation: the databoost-im approach,” ACM Sigkdd Explor, vol. 6, no. 1, pp. 30–39, 2004. [Google Scholar]
- [23].O’Brien R and Ishwaran H, “A random forests quantile classifier for class imbalanced data,” Pattern Recog, vol. 90, pp. 232–249, 2019. [DOI] [PMC free article] [PubMed] [Google Scholar]
- [24].Swamidass SJ, Azencott C-A, Daily K, and Baldi P, “A croc stronger than roc: measuring, visualizing and optimizing early retrieval,” Bioinformatics, vol. 26, no. 10, pp. 1348–1356, 2010. [DOI] [PMC free article] [PubMed] [Google Scholar]
Associated Data
This section collects any data citations, data availability statements, or supplementary materials included in this article.


