Abstract
Background
Current 18F-NaF assessments of aortic valve microcalcification using 18F-NaF PET/CT are based on evaluations of end-diastolic or cardiac motion-corrected (ECG-MC) images, which are affected by both patient and respiratory motion. We aimed to test the impact of employing a triple motion correction technique (3 × MC), including cardiorespiratory and gross patient motion, on quantitative and qualitative measurements.
Materials and methods
Fourteen patients with aortic stenosis underwent two repeat 30-min PET aortic valve scans within (29 ± 24) days. We considered three different image reconstruction protocols; an end-diastolic reconstruction protocol (standard) utilizing 25% of the acquired data, an ECG-gated (four ECG gates) reconstruction (ECG-MC), and a triple motion-corrected (3 × MC) dataset which corrects for both cardiorespiratory and patient motion. All datasets were compared to aortic valve calcification scores (AVCS), using the Agatston method, obtained from CT scans using correlation plots. We report SUVmax values measured in the aortic valve and maximum target-to-background ratios (TBRmax) values after correcting for blood pool activity.
Results
Compared to standard and ECG-MC reconstructions, increases in both SUVmax and TBRmax were observed following 3 × MC (SUVmax: Standard = 2.8 ± 0.7, ECG-MC = 2.6 ± 0.6, and 3 × MC = 3.3 ± 0.9; TBRmax: Standard = 2.7 ± 0.7, ECG-MC = 2.5 ± 0.6, and 3 × MC = 3.3 ± 1.2, all p values ≤ 0.05). 3 × MC had improved correlations (R2 value) to the AVCS when compared to the standard methods (SUVmax: Standard = 0.10, ECG-MC = 0.10, and 3 × MC = 0.20; TBRmax: Standard = 0.20, ECG-MC = 0.28, and 3 × MC = 0.46).
Conclusion
3 × MC improves the correlation between the AVCS and SUVmax and TBRmax and should be considered in PET studies of aortic valves using 18F-NaF.
Supplementary Information
The online version contains supplementary material available at 10.1186/s40658-022-00433-7.
Keywords: Motion correction, PET/CT, Cardiac PET, 18F-sodium fluoride, Aortic valve imaging
Background
Positron emission tomography (PET) utilizing 18F-sodium fluoride (18F-NaF) combined with computed tomography angiography (CTA) permits identification of microcalcification activity and progression of disease in aortic valves [1–6]. Moreover, 18F-NaF PET is currently being used as an endpoint in several ongoing clinical trials assessing the efficacy of novel therapies in aortic stenosis [7–9].
Cardiac 18F-NaF PET imaging is affected by motion (cardiac and respiratory [cardiorespiratory] and patient) and by technical challenges associated with the current acquisition protocols for 18F-NaF PET, which can last for up to 30 min. The long imaging protocols were initially designed to ensure sufficient count statistics to obtain images of diagnostic quality [10]. Unfortunately, patient motion during imaging protocols with long acquisition times degrades the image quality of the scans [10] and consequently reduces the quantitative accuracy and the test–retest repeatability [11, 12]. In addition, variations in the tracer injection-to-scan delays affect the quantitative assessment of the lesions with 18F-NaF PET [13–15]. While the impact of these factors is of keen interest in studies of aortic valve microcalcification, to date, it has been only evaluated in studies of coronary plaques [10–15]. Best possible image quality and spatial resolution are of critical importance in studies of microcalcification in native valves to understand the pathophysiology of aortic stenosis, and in studies of bioprosthetic valves where accurate localization of 18F-NaF uptake is essential.
To this end, we aimed to test the hypothesis that correcting for cardiorespiratory and patient motion (3 × MC) will lead to improved image quality (signal-to-noise ratio [SNR]) [10], and increased semi-quantitative measurements (maximum standardized uptake values [SUVmax] and maximum target-to-background ratios [TBRmax]) [11] in studies of microcalcification activity in the aortic valve.
Methods
Study population
Fourteen patients with aortic stenosis underwent repeated 18F-NaF aortic valve PET/CT examinations with the two occasions 4 weeks apart as a part of the ongoing study investigating the effect of drugs used to treat osteoporosis on the progression of calcific aortic stenosis (SALTIRE II) [7]. Of note, only the two baseline scans (scan 1 and scan 2) of the SALTIRE II study were evaluated in this study; thus, no disease progression was expected between the two scans. These scans were obtained originally to check the test–retest variability of the entire imaging procedure [10, 16].
This study was approved by the Scottish Research Ethics Committee and the Medicines and Healthcare Products Regulatory Authority of the United Kingdom, and the study was performed in accordance with the declaration of Helsinki. All participants signed written informed consent.
Imaging protocol
PET/CT All patients underwent 30-min listmode PET-emission scans one hour following 18F-NaF injection (target injection 125 MBq). All scans were acquired on a 128-slice Biograph mCT system (Siemens Healthineers, Knoxville, USA). All patients had a low-dose CT scan for attenuation correction purposes prior to the PET acquisitions (120 kV, 50 mAs, 3-mm slice thickness). Three ECG leads were used for the detection of cardiac motion (ECG gating). No additional external markers for tracking patient or respiratory motion were employed.
CT angiography For anatomical identification of the aortic valves, all patients had a cardiac CT angiogram (CTA) for each scan session immediately after emission scanning. All CTA images were acquired using prospective gating, a 330-ms rotation time, and a body-mass index (BMI)-dependent voltage (BMI < 25 kg/m2, 100 kV, BMI ≥ 25 kg/m2, 120 kV). All patients had beta-blockers administered, either orally or intravenously to achieve a target heart rate of < 60 /min. Iodinated contrast was administered in bolus form (400 mg/mL) with an injection rate of 5–6 mL/s after determining the appropriate trigger delay, defined as a test-bolus of 20 mL of contrast material.
Calcium scoring Aortic valve CT calcium scoring was acquired for all patients to estimate the calcium scores for the repeat PET/CT scans and used for primary outcome of the study. A non-contrast ECG-gated CT was performed at each visit using the same scanner, electrocardiogram gating, and a standardized protocol (120 kV CARE Dose4D [Siemens], 3-mm slice thickness, spiral acquisition, 70% R-R interval, inspiratory breath-hold). CT calcium scoring was performed by an experienced operator using dedicated software (Vitrea Advanced; Toshiba Systems) on axial views, with care taken to exclude calcium originating from the ascending aorta, left ventricular outflow tract, and coronary arteries. The calcium score was recorded in Agatston units.
Motion detection and image reconstruction
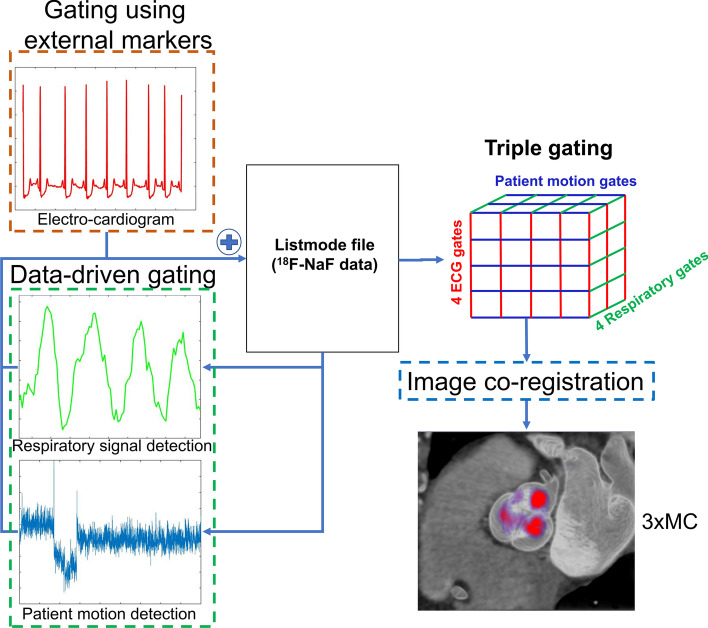
Three different image reconstructions were evaluated in this study; (1) an end-diastolic image reconstruction employing 25% of the counts (Standard) [17] a cardiac motion-corrected dataset (ECG-MC) reconstruction employing four cardiac phases [10], and a triple motion-corrected (3 × MC) dataset employing 16 cardiorespiratory phases per each patient position phase as determined from the listmode. Thus, gross patient motion had variable number of phases. The 3 × MC reconstructions were obtained using a previously described gating protocol (Fig. 1) [12]. In brief, information on cardiac contraction was obtained using ECG gating. Respiratory and patient motion was detected retrospectively using data-driven gating. In brief, the data-driven gating employed a center-of-mass-based analysis of single-slice-rebinned sinograms (3D) obtained for every 200 ms [11, 18]. Information on the respiratory motion was extracted from the diaphragm region only using segmentation on the diaphragm area from the co-registered low-dose CT attenuation correction map, whereas gross body motion was detected by evaluating the whole PET field-of-view (longitudinal direction) as in work by Büther et al. [19] for respiratory motion detection. The motion detection was obtained using four time-of-flight bins covering the central part of the PET system (transaxial direction). For automatic extraction of patient repositioning events, the center-of-mass signal was filtered with a band-stop filter (0.2–0.5 Hz, equivocal to 12–30 respiratory cycles per minute) and a moving-average filter (3 s) to remove stochastic noise in the signal. Patient repositioning events were defined as changes in the center-of-mass baseline (> 0.5 mm over 3 s (sudden repositioning) or > 0.3 mm over 15 s (gradual repositioning events) [11]. The respiratory signal was obtained using a band-pass filter of the extracted center-of-mass signal (0.2–0.5 Hz), followed by a moving-average filter (3 s) to remove stochastic noise in the signal.
Fig. 1.
Overall scheme for simultaneous cardiorespiratory and gross patient motion detection and correction of 18F-NaF aortic valve PET scans. A fixed number of respiratory and electrocardiogram (ECG) gates (4 each) were used. The number of patient repositioning gates depended on the number of repositioning events the patient had during the acquisition. A 3D mesh of gated reconstructions were obtained, which were registered to generate the 3 × MC image set. 3 × MC = triple motion-corrected
Image reconstruction
All PET images were reconstructed using vendor-provided software (JS-Recon12, Siemens, Knoxville, USA), using corrections for both point-spread and time-of-flight using two iterations and 21 subsets. All reconstructions were performed using a voxel-grid of 256 × 256 × 109 indices (2.73 × 2.73 × 2.037 mm) and filtered with a 5-mm Gaussian post-filter.
Image registration
All PET datasets were co-registered to the CTA images, using anatomical landmarks as described in a previous study [10]. In brief, the images were co-registered based on matching of the blood pool of the two imaging modalities by overlaying the four cardiac chambers for the PET and CTA images. Following PET to CTA co-registration, the PET-PET image registration (PET motion correction) was performed within a sphere (radius = 20 mm) enclosing the aortic valve, thereby, creating ECG-MC and 3 × MC image-sets. The motion correction was performed using nonlinear registrations (daemons) [20]. All motion correction was performed in FusionQuant, thus, employing a post-reconstruction motion correction technique registering the 3D reconstructed frames (FusionQuant, Cedars-Sinai Medical Center) [10].
Image analysis
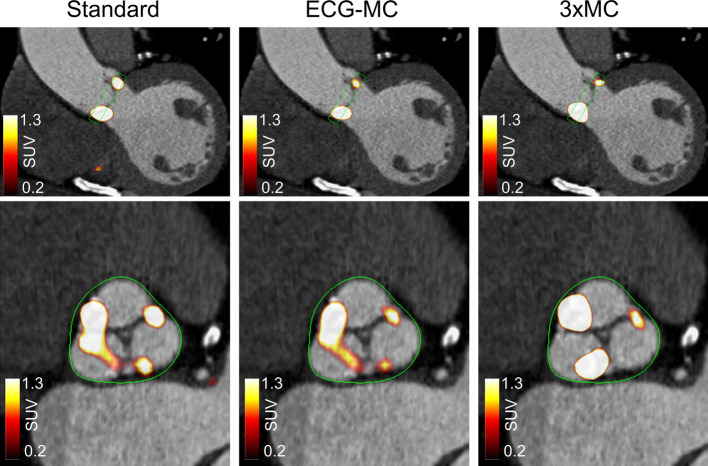
PET Quantification Using the co-registered PET and CTA images, the valvular uptake was measured using a three-dimensional polyhedron (6-mm thickness) encompassing the valve (Fig. 2). In addition, background blood pool uptake was measured in the center of the right atrium (cylindric volume: radius = 8 mm, height = 9 mm) [12, 16]. Of note, the background blood pool activity was extracted from the right atrium as it offers reduced coefficient of variation in the measurements compared to measurements obtained in the vena cava and brachiocephalic vein, although at the cost of slightly increased blood pool activities [16]. The same volume of interests (VOIs) were used for all three reconstruction protocols. All scans were read in a blinded fashion, with readings of the images 6 weeks apart to reduce the risk of bias in the assessment [10]. All the images were read by a cardiologist certified in echocardiography and computed tomography angiography.
Fig. 2.
Segmentation of the aortic valve used for quantification of 18F-NaF uptake (shown as a green polyhedron). The valve was segmented on the end-diastolic image enclosing on the SUVmax observed in the image to ensure high test–retest repeatability. Top row shows the coronal view of the myocardium, while the lower row represents the short-axis view of the aortic valve. ECG-MC = ECG motion-corrected, 3 × MC = triple motion-corrected
To compensate for variations in the background blood pool activity introduced by variations in the injection-to-scan delays [14], the activity observed in the background at time t (in minutes) after the injection was normalized to a standardized injection-to-scan delay of 60 min using a previously described correction factor [12]:
| 1 |
TBRmax measurements were obtained by normalizing the SUVmax measured in the segmented valve to the corrected mean standardized uptake value obtained in the right atrium (SUVCorrected Background) (Eq. 2).
| 2 |
To assess the image quality of the resulting reconstructions (Standard, ECG-MC, and 3 × MC), we evaluated the signal -to-noise ratio (SNR) obtained in the background. The SNR was defined as the SUVmax obtained in the valve normalized to the standard deviation obtained in the background blood pool (right atrium) [10]. The magnitude of the patient repositioning was measured from the PET-to-PET co-registration using the inverse motion vector fields.
Statistical analysis
The data were tested for normality using the Shapiro–Wilk test, using corrections for multiple comparisons (Bonferroni corrections). Continuous variables were presented as mean ± standard deviation. Test–retest repeatability of the TBRmax assessments was compared using the repeatability coefficient (RC; RC = 1.96*standard deviation with the standard deviation being expressed in % difference from the initial scans. Of note, the standard deviation was calculated from the 14 patients included in this study) and using the Kendall’s Tau measure [12]. Tests for variations in TBRmax assessments were evaluated using Pitman–Morgan analyses with p values < 0.05 were considered statistically significant.
Results
All patients underwent two 18F-NaF PET/CTA scans within one month. The patients had an average AVCS of 1259 ± 908AU. Of the 14 patients, 11 were acquired with the arms placed above the head, while the remaining three patients were unable to have the scans performed with the arms elevated. Patient demographics are shown in Table 1.
Table 1.
Patient demographics
| Demographics | Value |
|---|---|
| Age (years) | 73 ± 7 |
| Gender (Males) | 10 (67.7) |
| Body mass index (BMI) | 27.2 ± 4.3 |
| Cardiovascular risk factors | |
| Diabetes mellitus | 4 (26.7) |
| Current smoker | 6 (40.0) |
| Hypertension | 11(73.3) |
| Hyperlipidemia | 10 (67.7) |
| TIA/CVA | 2 (13.3) |
| Renal disease | 0 (0) |
| CABG | 2 (13.3) |
| PCI | 4 (23.7) |
| Medications | |
| ACE inhibitor | 6 (40.0) |
| ARB | 3 (20.0) |
| Beta blocker | 7 (56.6) |
| Statin | 9 (60.0) |
| Aortic stenosis grade | |
| Mild | 7 (47.6) |
| Moderate | 4 (26.7) |
| Severe | 4 (26.7) |
| Aortic valve calcium score (Agatston) | 1269 [246–5774] |
Continuous variables reported as mean ± SD or median [range]; categorical variables reported as n (%)
TIA transient ischemic attack, CVA cerebrovascular accident
Acquisition and motion estimation
The average dose was 124 ± 6 MBq of 18F-NaF. On average, the patients had injection-to-scan delays of 68 ± 11 min (range 59–99 min). During the 30-min acquisitions, patients were found to reposition themselves 3.6 ± 1.3 times (range 1–6). The arm position did not seem to affect the number of repositioning events (Repositioning events: arms up = 4 ± 1, arms down = 4 ± 1). Acquisition individual maximum translations in contrast to the reference frame was of magnitude of 14 mm (3D motion) (3D motion: 14.3 ± 2.3 mm, range = [11.1; 21.8 mm]) (Additional file 1: Supplementary figure 1).
SUVmax and TBRmax assessments
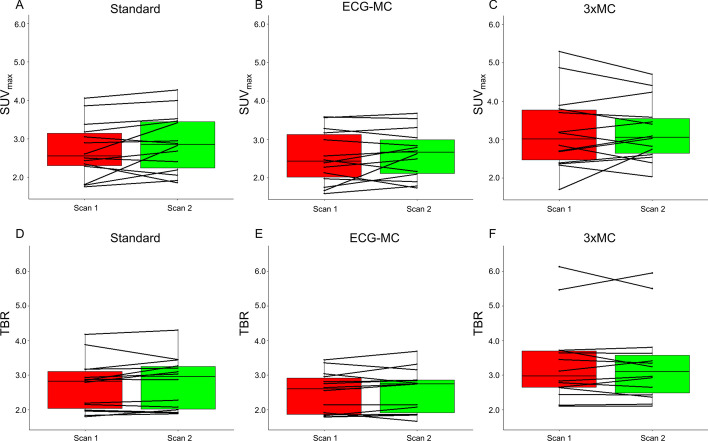
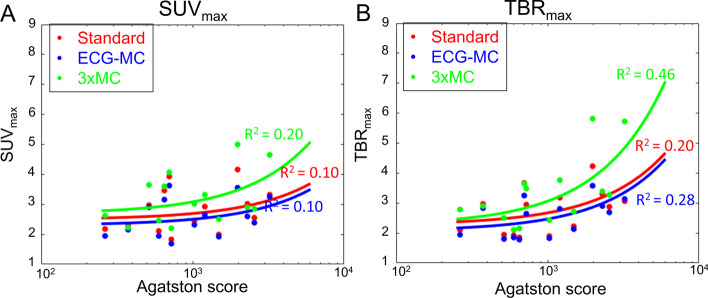
The 3 × MC reconstruction protocol resulted in increased SUVmax and TBRmax values when compared to both the standard and ECG-MC protocols (SUVmax: Standard = 2.8 ± 0.7, ECG-MC = 2.6 ± 0.6, and 3 × MC = 3.3 ± 0.9; TBRmax: Standard = 2.7 ± 0.7, ECG-MC = 2.5 ± 0.6 and 3 × MC = 3.4 ± 1.2, all p values < 0.05) (Fig. 3). Of note, the median variation in the injection-to-scan delay (intra-patient delay) was 6.5 min (inter quartile range = [1.5; 10.5 min]). Correlations plots of the aortic valve calcium score (AVCS) and the SUVmax and TBRmax (Fig. 4) were improved for the 3 × MC technique when compared to the Standard and ECG-MC techniques (R2; SUVmax: Standard = 0.10, ECG-MC = 0.10, and 3 × MC = 0.20; TBRmax: Standard = 0.20, ECG-MC = 0.28, and 3 × MC = 0.46).
Fig. 3.
SUVmax and TBRmax measurements obtained for the three reconstructions. Significantly increased SUVmax and TBRmax values were observed for the 3 × MC datasets when compared to standard and ECG-MC datasets (Pitman–Morgan analyses, all p < 0.05). Standard = end-diastolic imaging, ECG-MC = ECG motion-corrected, 3 × MC = triple motion-corrected. SUVmax = maximum standard uptake value, TBRmax = maximum target-to-background ratio
Fig. 4.
Correlation plots of the aortic valve calcium score and SUVmax and TBRmax. Significantly improved correlations were observed for the 3 × MC when compared to the other reconstructions for both SUVmax (A) and TBRmax (B). Of note, the repeated measurements were averaged for the plots. Standard = end-diastolic imaging, ECG-MC = ECG motion-corrected, 3 × MC = triple motion-corrected. SUVmax = maximum standard uptake value, TBRmax = maximum target-to-background ratio
Image quality
Lower SNR were obtained for the standard (end-diastolic) image approach (SNR = 25.7 ± 10.1) when compared to the motion-corrected datasets (SNR: ECG-MC = 37.3 ± 12.9, 3 × MC = 45.7 ± 16.9) (both p < 0.0001). Noteworthy, the SNR obtained for 3 × MC has improved when compared to the ECG-MC (p < 0.001) (Fig. 5).
Fig. 5.
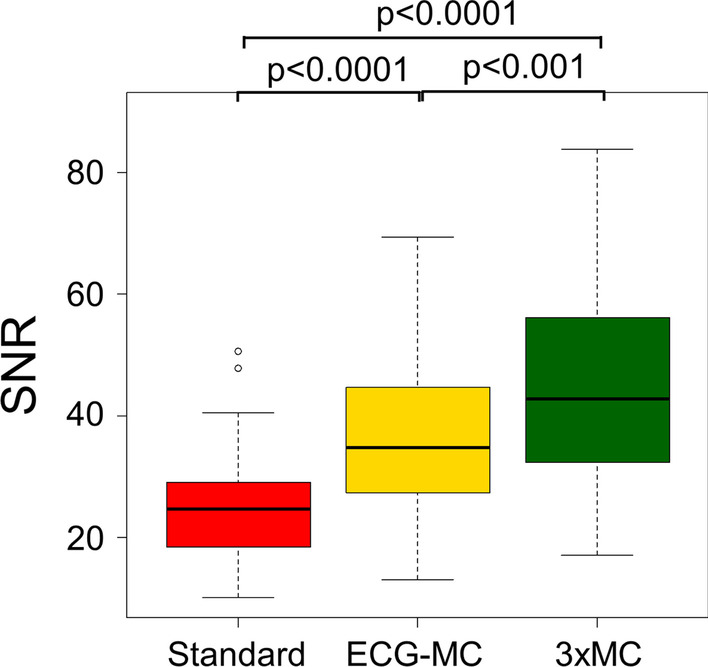
Signal-to-noise ratio (SNR) measurements obtained for the three reconstructions. End-diastolic (Standard) measurements were reported to have significantly lower SNR when compared to the motion-corrected datasets (ECG-MC and 3 × MC). ECG-MC = cardiac contraction motion-corrected, 3 × MC = triple motion-corrected
Test–retest repeatability measurements
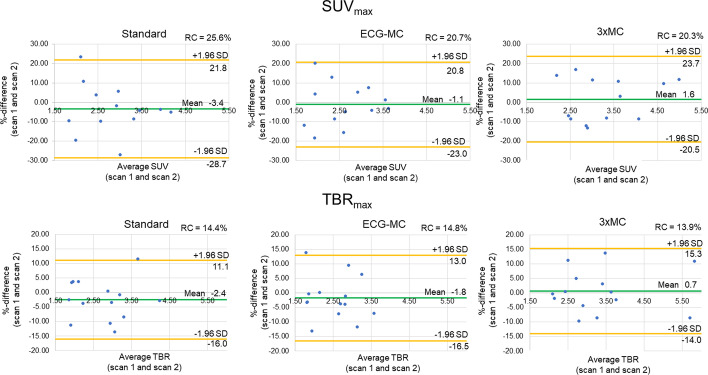
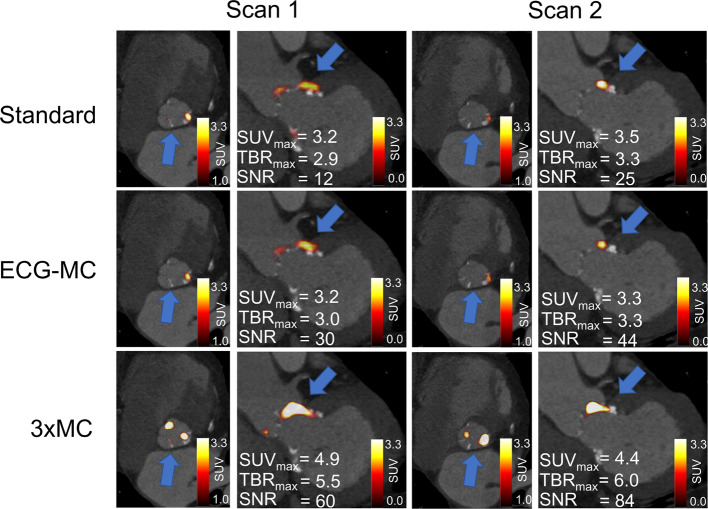
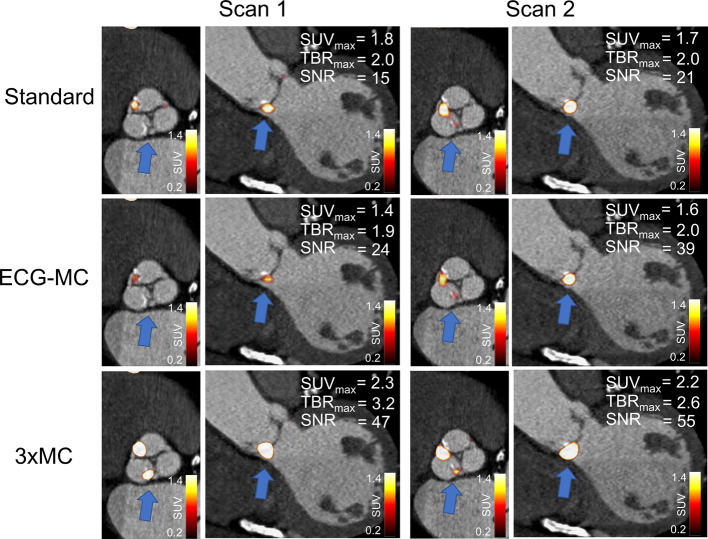
Similar test–retest repeatability coefficient were obtained for all three reconstruction protocols (SUVmax: Standard = 25.6%, ECG-MC = 20.7%, 3 × MC = 20.3%; TBRmax: Standard = 14.4%, ECG-MC = 14.8%, 3 × MC = 13.9%, all p ≥ 0.79) (Fig. 6). Similarly, the Kendall’s Tau measures showed improved reliability of the 3 × MC reconstruction protocols, although not being statistically significant (SUVmax: Standard = 0.74, ECG-MC = 0.69, 3 × MC = 0.74; TBRmax: Standard = 0.80, ECG-MC = 0.78%, 3 × MC = 0.85, all p ≥ 0.79). Figures 7 and 8 show two cases of test–retest repeatability of the tracer-uptake before and after motion correction.
Fig. 6.
Test–retest repeatability of SUVmax and TBRmax for standard (end-diastolic), ECG-MC, and 3 × MC reconstruction protocols. RC = repeatability coefficient, TBRmax = maximum target-to-background ratio, ECG-MC = cardiac contraction motion-corrected, 3 × MC = triple motion-corrected
Fig. 7.
Test–retest valve PET imaging for a patient before and after motion and background blood pool corrections. Standard and ECG-MC images present less specific uptake patterns at the areas with calcification, while 3 × MC images show reproducible uptake patterns for the two scans. ECG-MC = cardiac contraction motion-corrected, 3 × MC = triple motion-corrected, SUVmax = maximum standardized uptake value, TBRmax = maximum target-to-background ratio, SNR = signal-to-noise ratio
Fig. 8.
Test–retest valve PET imaging for a patient before and after motion and background blood pool corrections. Standard and ECG-MC images present lower TBRmax, while 3 × MC images show higher TBRmax (68% and 30% increase in scan 1 and scan 2, respectively). ECG-MC = cardiac contraction motion-corrected, 3 × MC = triple motion-corrected, SUVmax = maximum standardized uptake value, TBRmax = maximum target-to-background ratio, SNR = signal-to-noise ratio
Discussion
We evaluated the use of a novel 3 × MC PET reconstruction technique tested for the first time in PET imaging of aortic valves, including cardiorespiratory and gross patient motion correction. The impact of the 3 × MC protocol was evaluated on five criteria assessing the quantitative and qualitative assessments of the images: SUVmax, TBRmax, SNR, the test–retest repeatability, and the correlation between the quantitative measures and AVCS. The 3 × MC was superior to the standard (end-diastolic) and ECG-MC imaging protocols without affecting the test–retest repeatability. The improved localized uptake observed in the aortic valves for the 3 × MC reconstructions correlated better with the AVCS than the standard and ECG-MC protocols, which in combination with the increased SNR might aid the understanding of the pathophysiology in native and bioprosthetic valve diseases.
The assessment of aortic valve microcalcification with 18F-NaF can be used to predict aortic valve stenosis progression [1, 4, 16, 21]. Studies to date have established the association between increased TBRmax and aortic stenosis progression using either standard (end-diastolic) or ECG-MC image series [1, 10, 15]. However, it is uncertain how much patient and respiratory motion can affect quantitative assessments of 18F-NaF uptake (SUVmax and TBRmax). It is therefore of great interest to evaluate potential image improvements offered by the 3 × MC protocol in the context of aortic valve microcalcification. Specifically, the improved co-localization of PET activity with areas of aortic valve calcification is of high interest in studies investigating the various causes of leaflet calcification, i.e., mechanical stress at the leaflet coaptation points versus commissures. Moreover, it might help differentiate between activities originating in the aortic valve from activity from nearby structures (left main stem, mitral valve, left atrium, etc.) by reducing the spillover effect of those structures. This is of importance in cases of bioprosthetic valves, and transcatheter aortic valve implantation (TAVI), where localizing the source of PET activity can help differentiate between bioprosthetic valve leaflet degeneration and remote activity originating from the valve struts or crushed native leaflets in case of TAVI [22]. In this context, partial volume effects strongly affect the activity observed in the aortic valves and their surrounding tissues. It is anticipated that the 3 × MC reconstruction protocol may ameliorate the impact of the apparent partial volume effects because of the co-registration of the gated images with significantly reduced intra-gate motion compared to the standard and ECG-MC reconstruction protocols where several motion patterns blur the resulting images. Therefore, it is believed that the 3 × MC reduces the impact of the partial volume effects while also aiding toward better test–retest repeatability.
In the current study, all patients demonstrated an increase in both SUVmax and TBRmax when the data were corrected using 3 × MC (cohort-based increase: SUVmax = 26%, TBRmax = 33%) (Fig. 3), indicating loss of signal when not applying these correction techniques. The improved SUVmax and TBRmax assessments for the 3 × MC both had preserved repeatability measures and led to a twofold increase in the correlations to the aortic valve calcium score when compared to the Standard and ECG-MC reported results; thus, suggesting that 3 × MC might improve predictions on disease progression (Figs. 3, 4, 6, 7, 8) [1]. Based on these findings, we can conclude that the motion patterns across different patients vary widely, depending on the respiratory translations and patient motion patterns during the acquisitions, which in some cases can introduce variations in the quantitative values exceeding 40% (average increases of the four scans with substantial changes in SUVmax and TBRmax values: SUVmax = 42%, TBRmax = 72%). The increase in the correlation scores observed for the TBRmax and aortic valve calcium score may translate into lower number of patients required in studies investigating the effects of interventions on 18F-NaF PET uptake (as a marker of calcification activity) because any true effect will not be covered by noise within the region of interest.
Motion during the scans has been shown to have a detrimental impact on the image quality, measured as SNR [10, 13]. In concordance with a previous study of coronary plaques, the SNR was significantly reduced for the standard imaging protocol when compared to the motion-corrected protocols [13]. The low SNR observed for the standard protocols is introduced by two arms, low count statistics (25% of the acquired data used for the analyses), and respiratory and patient motion blur embedded in the ECG-gated images [12]. Introducing motion correction (ECG-MC and 3 × MC), the SNR improved as all the data were used in the analyses partly owing to the increased count statistics in the images (100% of the acquired data). The further improvement observed for the 3 × MC was introduced by the corrections for both respiratory and patient motion, which reduced the residual blur introduced to the ECG-gated reconstructions, as shown in Fig. 4. While SNR was significantly reduced using ECG-MC alone compared to 3 × MC, ECG-MC provides greatly improved SNR when compared to the standard assessment and therefore should be considered when 3 × MC is not possible. Of note, the gated reconstructions took 3 min to reconstruct each gate using a 3 year-old PC, introducing a reconstruction time of 48 min per repositioning event.
While some of the discrepancies, in general, may be attributed to changes in the pathological disease, only minor changes in the SUVmax/TBRmax test–retest variability is expected to be introduced by disease progression owing to the slow microcalcification processes which may change the calcification burden by 24% per year (and thus, only 1–2% change in the SUVmax/TBRmax burden should expected) [16]. Therefore, the discrepancy in the impact of the ECG-MC and 3 × MC observed for SNR, TBRmax, and SUVmax indicate that the different motion patterns (cardiac contraction, respiratory and gross patient motion) affect image quality to varying extent. The improved quantitative and qualitative findings observed for the 3 × MC protocol suggest that cardiac contraction is of less importance to correct for in studies of aortic valves when compared to the patient repositioning events and the respiratory translations. Such results were expected as the cardiac contraction affects mainly the coronary arteries, where the right coronary artery has been reported to shift up to 26 mm [23] which is in contrast to the average displacement of the aortic valves (~ 12 mm) [24]. In contrast, respiratory motion has been reported to displace the heart by up to 21 mm [25] and patient repositioning events might shift the heart 5–15 mm [11]. In this context, patient motion (repositioning events) usually happens with low frequency (approximately 3.5 times per scan) and although the translations are few, they introduce non-periodical shifts of the respiratory baseline and, thus, affect the cardiorespiratory motion correction.
Another important finding in our study is the robustness of the data-driven motion detection techniques, as applied to valve imaging studies. A previous study has shown that motion detection techniques employing these assessments are affected by reductions in the count rates [26]. The count rates are mainly affected by two variables: the injected activity and injection-to-scan delay. While the previous study utilizing a 3 × MC protocol (focusing on coronary plaques) had similar injection-to-scan delays as the current valve study (59–99 min) [12], the injection doses, in general, are halved for the studies of aortic valve microcalcification (to 125 MBq) [7, 10, 17], as compared to studies of coronary plaques (250 MBq) [12, 14, 27]).
Given the large dose-reduction in the current study, it was important to test the robustness of the extracted motion patterns (respiratory and patient). In this context, we evaluated the robustness of the technique by evaluating the impact of the data-driven motion detection techniques through assessments of the TBRmax, SNR, and test–retest repeatability of the TBRmax assessments. First, the number of repositioning events reported in this study was in concordance with previous studies [11, 12], suggesting that the robustness of the motion detection is preserved. Motion correction of the detected repositioning and respiratory events introduced an increase in both SUVmax, TBRmax, and SNR while preserving a high test–retest repeatability which is in concordance with already established imaging protocols [28]. These findings strongly indicate that the data-driven motion detection technique developed for patient and respiratory motion detection algorithm provides robust and reliable results in valve imaging even when using a low-dose imaging protocol.
Limitations
In this study, the number of patients was limited to 14 who underwent two PET/CTA scans within a month—this number is limited by the difficulty in obtaining such repeated PET/CT scans with short time interval. Nevertheless, we were able to report substantial improvements for SUVmax and TBRmax following 3 × MC, which correlated better to the calcium scores. The attenuation correction was not motion-corrected prior to image reconstruction, which might pose another limitation. However, in a previous study from our center, we showed that a respiratory averaged CT attenuation correction did not change the quantitative assessment. Therefore, we do consider this a limitation of this study [29]. Another limitation was the use of only four cardiac and four respiratory gates for each patient repositioning event during the scans; however, double gating imposes count limitations especially in low-dose studies as studied. Further improvement in TBRmax values is possible with an increasing number of cardiorespiratory gates or introducing motion correction during the reconstruction, whereby noise in the images will be suppressed.
Conclusion
3 × MC employed in 18F-NaF aortic valve imaging substantially improves the correlation between the obtained aortic valve calcium score and SUVmax, TBRmax and should be considered in PET studies of aortic valves using 18F-NaF.
Supplementary Information
Additional file 1: Supplementary Figure 1. Maxmum translations (3D) of the aortic valve obtained for the repeat scans. On average, the aortic valve was translated 14.3 mm during the scans, with a maximum translation of 21.8 mm.
Abbreviations
- PET
Positron emission tomography
- CTA
Computed tomography angiography
- ECG- MC
Cardiac contraction motion-corrected
- 3 × MC
Triple motion-corrected
- TBRmax
Maximum target-to-background ratio
- SUV
Standardized uptake value
- VOI
Volume of interest
- AVCS
Aortic valve calcification score
Authors' contributions
MLL interpreted the data, wrote the gating software used for the analysis, and drafted the manuscript. DM drafted the work and assisted in the data analysis. ET interpreted the data and drafted the manuscript. RB, JK, DD, and DSB helped to draft the manuscript. MRD and DEN designed the work and helped to revise the manuscript. PJS helped to interpret the data and draft the manuscript. All authors have approved the manuscript submission and agreed to the submission guidelines.
Funding
This research was supported in part by Grant R01HL135557 from the National Heart, Lung, and Blood Institute/National Institute of Health (NHLBI/NIH). The content is solely the responsibility of the authors and does not necessarily represent the official views of the National Institutes of Health. In addition, the study was supported by Siemens Medical Systems. The study was also supported by a Grant (“Cardiac Imaging Research Initiative”) from the Miriam & Sheldon G. Adelson Medical Research Foundation. DEN is supported by the British Heart Foundation (CH/09/002, RG/16/10/32375, RE/18/5/34216) and is the recipient of a Wellcome Trust Senior Investigator Award (WT103782AIA). MRD is supported by the Sir Jules Thorn Biomedical Research Award (JTA/15) and the British Heart Foundation (FS/14/78/31020).
Availability of data and materials
The data is not publicly available because this study is still ongoing.
Declarations
Ethical approval and consent to participate
All procedures performed in studies involving human participants were in accordance with the ethical standards of the institutional research committee (Edinburgh, UK) and with the 1964 Helsinki declaration and its later amendments or comparable ethical standards. Informed consent was obtained from all individual participants included in the study.
Consent for publication
All co-authors have read and approved the submission of the publication.
Competing interests
No relevant conflict of interests relevant to this manuscript exist. This study was in part supported by Siemens.
Footnotes
Publisher's Note
Springer Nature remains neutral with regard to jurisdictional claims in published maps and institutional affiliations.
References
- 1.Dweck MR, Jenkins WSA, Vesey AT, Pringle MAH, Chin CWL, Malley TS, et al. 18F-sodium fluoride uptake is a marker of active calcification and disease progression in patients with aortic stenosis. Circ Cardiovasc Imaging. 2014;7:371–378. doi: 10.1161/CIRCIMAGING.113.001508. [DOI] [PubMed] [Google Scholar]
- 2.Bing R, Dweck MR. Aortic valve and coronary 18F-sodium fluoride activity: a common cause ? J Nucl Cardiol. 2019 doi: 10.1007/s12350-019-01901-x. [DOI] [PubMed] [Google Scholar]
- 3.Nakamoto Y, Kitagawa T, Sasaki K, Tatsugami F, Awai K, Hirokawa Y, et al. Clinical implications of 18F-sodium fluoride uptake in subclinical aortic valve calcification: its relation to coronary atherosclerosis and its predictive value. J Nucl Cardiol. 2019. 10.1007/s12350-019-01879-6. [DOI] [PubMed]
- 4.Jenkins WSA, Vesey AT, Shah ASV, Pawade TA, Chin CWL, White AC, et al. Valvular 18F-fluoride and 18F-fluorodeoxyglucose uptake predict disease progression and clinical outcome in patients with aortic stenosis. J Am Coll Cardiol. 2015;66:1200–1201. doi: 10.1016/j.jacc.2015.06.1325. [DOI] [PubMed] [Google Scholar]
- 5.Doris MK, Everett RJ, Shun-Shin M, Clavel MA, Dweck MR. The role of imaging in measuring disease progression and assessing novel therapies in aortic stenosis. JACC Cardiovasc Imaging. 2019;12:185–197. doi: 10.1016/j.jcmg.2018.10.023. [DOI] [PMC free article] [PubMed] [Google Scholar]
- 6.Irkle A, Vesey AT, Lewis DY, Skepper JN, Bird JLE, Dweck MR, et al. Identifying active vascular microcalcification by 18 F-sodium fluoride positron emission tomography. Nat Commun. 2015;6:1–11. doi: 10.1038/ncomms8495. [DOI] [PMC free article] [PubMed] [Google Scholar]
- 7.Trials C. Study Investigating the Effect of Drugs Used to Treat Osteoporosis on the Progression of Calcific Aortic Stenosis. (SALTIRE II). Study Investig. Eff. Drugs Used to Treat Osteoporos. Progress. Calcif. Aortic Stenosis. (SALTIRE II). 2014. https://clinicaltrials.gov/ct2/show/NCT02132026?co.
- 8.Peeters FECM, Van Mourik MJW, Meex SJR, Bucerius J, Schalla SM, Gerretsen SC, et al. Bicuspid aortic valve stenosis and the effect of vitamin K2 on calcification using 18F-sodium fluoride positron emission tomography/magnetic resonance: the BASIK2 rationale and trial design. Nutrients. 2018;10. [DOI] [PMC free article] [PubMed]
- 9.Kim H-S. PCSK9 Inhibitors in the Progression of Aortic Stenosis. 2017. https://clinicaltrials.gov/ct2/show/NCT03051360.
- 10.Massera D, Doris MK, Cadet S, Kwiecinski J, Pawade TA, Peeters FECM, et al. Analytical quantification of aortic valve 18F-sodium fluoride PET uptake. J Nucl Cardiol. 2020;27:962–972. doi: 10.1007/s12350-018-01542-6. [DOI] [PMC free article] [PubMed] [Google Scholar]
- 11.Lassen ML, Kwiecinski J, Cadet S, Dey D, Wang C, Dweck MR, et al. Data-driven gross patient motion detection and compensation: Implications for coronary 18F-NaF PET imaging. J Nucl Med Soc Nucl Med. 2019;60:830–836. doi: 10.2967/jnumed.118.217877. [DOI] [PMC free article] [PubMed] [Google Scholar]
- 12.Lassen ML, Kwiecinski J, Dey D, Cadet S, Germano G, Berman DS, et al. Triple-gated motion and blood pool clearance corrections improve reproducibility of coronary 18F-NaF PET. Eur J Nucl Med Mol Imaging. 2019;46:2610–2620. doi: 10.1007/s00259-019-04437-x. [DOI] [PMC free article] [PubMed] [Google Scholar]
- 13.Lassen ML, Kwiecinski J, Dey D, Cadet S, Germano G, Berman D, et al. Triple motion correction including cardiorespiratory and gross patient motion: application in coronary plaque imaging using PET. J Nucl Med Soc Nucl Med. 2019;60:104. [Google Scholar]
- 14.Kwiecinski J, Berman DS, Lee S-E, Dey D, Cadet S, Lassen ML, et al. Three-hour delayed imaging improves assessment of coronary 18 F-sodium fluoride PET. J Nucl Med. 2019;60:530–5. doi: 10.2967/jnumed.118.217885. [DOI] [PMC free article] [PubMed] [Google Scholar]
- 15.Andrews JPM, MacNaught G, Moss AJ, Doris MK, Pawade T, Adamson PD, et al. Cardiovascular 18F-fluoride positron emission tomography-magnetic resonance imaging: a comparison study. J Nucl Cardiol. 2019 doi: 10.1007/s12350-019-01962-y. [DOI] [PMC free article] [PubMed] [Google Scholar]
- 16.Pawade TA, Cartlidge TRG, Jenkins WSA, Adamson PD, Robson P, Lucatelli C, et al. Optimization and reproducibility of aortic valve 18F-fluoride positron emission tomography in patients with aortic stenosis. Circ Cardiovasc Imaging. 2016;9:1–11. doi: 10.1161/CIRCIMAGING.116.005131. [DOI] [PMC free article] [PubMed] [Google Scholar]
- 17.Doris MK, Rubeaux M, Pawade T, Otaki Y, Xie Y, Li D, et al. Motion-Corrected imaging of the aortic valve with 18 F-NaF PET/CT and PET/MRI: a feasibility study. J Nucl Med. 2017;58:1811–1814. doi: 10.2967/jnumed.117.194597. [DOI] [PubMed] [Google Scholar]
- 18.Lassen ML, Beyer T, Berger A, Beitzke D, Rasul S, Büther F, et al. Data-driven, projection-based respiratory motion compensation of PET data for cardiac PET/CT and PET/MR imaging. J Nucl Cardiol. 2020;27:2216–2230. doi: 10.1007/s12350-019-01613-2. [DOI] [PubMed] [Google Scholar]
- 19.Büther F, Ernst I, Dawood M, Kraxner P, Schäfers M, Schober O, et al. Detection of respiratory tumour motion using intrinsic list mode-driven gating in positron emission tomography. Eur J Nucl Med Mol Imaging. 2010;37:2315–2327. doi: 10.1007/s00259-010-1533-y. [DOI] [PubMed] [Google Scholar]
- 20.Rubeaux M, Joshi N, Dweck MR, Fletcher A, Motwani M, Thomson LE, et al. Demons versus level-set motion registration for coronary 18 F-sodium fluoride PET. Proc SPIE Int Soc Opt Eng. 2016; 97843Y. [DOI] [PMC free article] [PubMed]
- 21.Tzolos E, Dweck MR. Aortic valve stenosis—multimodality assessment with PET/CT and PET/MRI. Br J Radiol. 2019;93:20190688. doi: 10.1259/bjr.20190688. [DOI] [PMC free article] [PubMed] [Google Scholar]
- 22.Cartlidge TRG, Doris MK, Sellers SL, Pawade TA, White AC, Pessotto R, et al. Detection and prediction of bioprosthetic aortic valve degeneration. J Am Coll Cardiol. 2019;73:1107–1119. doi: 10.1016/j.jacc.2018.12.056. [DOI] [PMC free article] [PubMed] [Google Scholar]
- 23.Shechter G, Resar JR, McVeigh ER. Displacement and velocity of the coronary arteries: cardiac and respiratory motion. IEEE Trans Med Imaging. 2006;25:369–75. doi: 10.1109/TMI.2005.862752. [DOI] [PMC free article] [PubMed] [Google Scholar]
- 24.Plonek T, Berezowski M, Kurcz J, Podgorski P, Sasiadek M, Rylski B, et al. The evaluation of the aortic annulus displacement during cardiac cycle using magnetic resonance imaging. BMC Cardiovasc Disord. 2018;18:1–6. doi: 10.1186/s12872-018-0891-4. [DOI] [PMC free article] [PubMed] [Google Scholar]
- 25.Dawood M, Büther F, Stegger L, Jiang X, Schober O, Schäfers M, et al. Optimal number of respiratory gates in positron emission tomography: a cardiac patient study. Med Phys. 2009;36:1775–1784. doi: 10.1118/1.3112422. [DOI] [PubMed] [Google Scholar]
- 26.Büther F, Ernst I, Frohwein LJ, Pouw J, Schäfers KP, Stegger L. Data-driven gating in PET: influence of respiratory signal noise on motion resolution. Med Phys. 2018;45:3205–3213. doi: 10.1002/mp.12987. [DOI] [PubMed] [Google Scholar]
- 27.Bellinge JW, Francis RJ, Majeed K, Watts GF, Schultz CJ. In search of the vulnerable patient or the vulnerable plaque: 18 F-sodium fluoride positron emission tomography for cardiovascular risk stratification. J Nucl Cardiol. 2018;25:1774–1783. doi: 10.1007/s12350-018-1360-2. [DOI] [PubMed] [Google Scholar]
- 28.Rasmussen JH, Fischer BM, Aznar MC, Hansen AE, Vogelius IR, Ofgren JL, et al. Reproducibility of 18F-FDG PET uptake measurements in head and neck squamous cell carcinoma on both PET/CT and PET/MR. Br J Radiol. 2015;88:15–21. doi: 10.1259/bjr.20140655. [DOI] [PMC free article] [PubMed] [Google Scholar]
- 29.Tzolos E, Lassen ML, Pan T, Kwiecinski J, Cadet S, Dey D, et al. Respiration-averaged CT versus standard CT attenuation map for correction of 18F-sodium fluoride uptake in coronary atherosclerotic lesions on hybrid PET/CT. J Nucl Cardiol. 2020 doi: 10.1007/s12350-020-02245-7. [DOI] [PMC free article] [PubMed] [Google Scholar]
Associated Data
This section collects any data citations, data availability statements, or supplementary materials included in this article.
Supplementary Materials
Additional file 1: Supplementary Figure 1. Maxmum translations (3D) of the aortic valve obtained for the repeat scans. On average, the aortic valve was translated 14.3 mm during the scans, with a maximum translation of 21.8 mm.
Data Availability Statement
The data is not publicly available because this study is still ongoing.


