Figure 3.

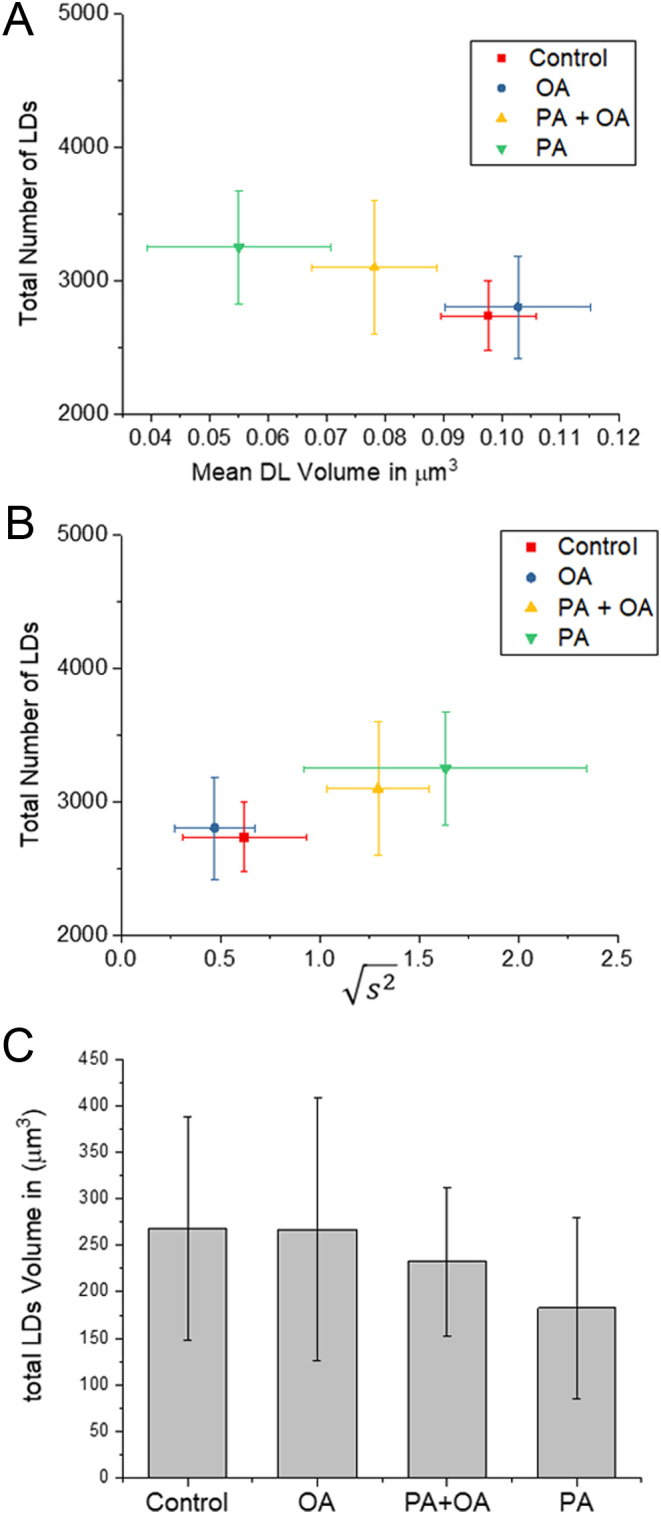
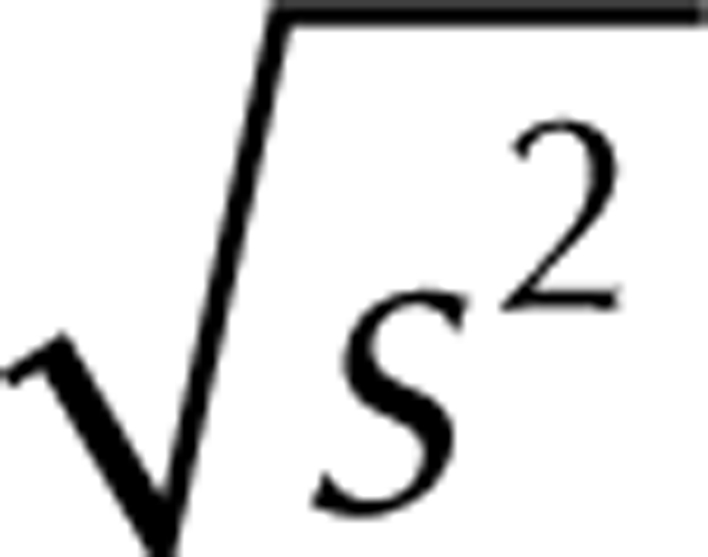
LD contents and aggregation size with FA treatments. (A) Scatter plot of the square root of the mean squared aggregate size  against the total number of LDs in ensembles of MII oocytes imaged immediately after overnight incubation in standard M2 medium (red square, n = 12), or supplemented with 200 µM PA (green triangle, n = 10), 200 µM OA (blue circle, n = 8) or combination of 200 µM PA and 200 µM OA (yellow triangle, n = 8). The distribution of each variable in the corresponding ensemble is shown as the average ± s.d. (B) LD volume V in μm3 against total number of LDs. The distribution of each variable in the corresponding ensemble is shown as the average ± s.d. All data represent multiple trials, using two to three mice per trial. (C) The total lipid content of oocytes with the three different treatments calculated as the product of the volume and total number of LDs.

 This work is licensed under a