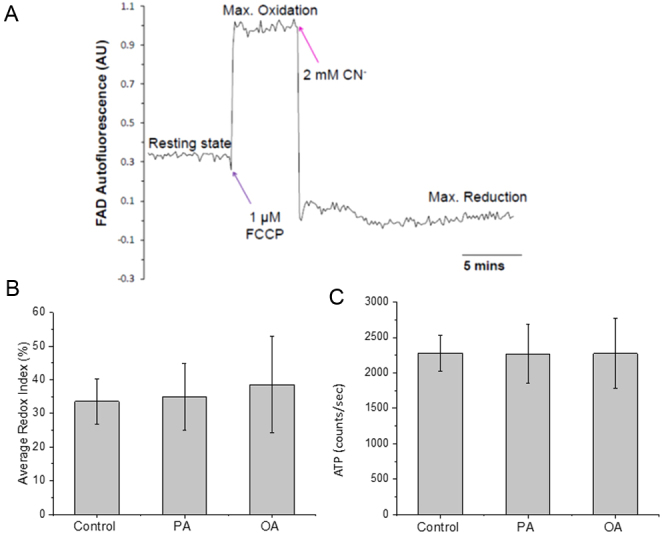
Figure 4.

Mitochondrial metabolism of living MII oocytes matured in high-FA environments. An example of traces of mitochondrial FAD autofluorescence signal in MII oocytes subjected to induction of maximum reduction (2 mM cyanide) followed by subsequent maximum oxidation (1 μM FCCP). (B) The average FAD redox indexes of MII oocytes matured with various FA condition. The FAD redox index of each oocyte is the resting fluorescence level before adding drugs normalized by fluorescence levels of the maximum reductions state and maximum oxidation state. Data represent multiple oocytes (n = 50, 34 or 26 for control, PA or OA condition, respectively) using two or three mice trials. Both PA and OA condition showed no significant difference (P > 0.05) from controls. (C) The luminescence of individual oocyte from each condition was measured separately after IVM; luminescence levels are shown as counts per second, and the average ATP level of each condition was calculated from multiple oocytes (n = 20, 24 or 22 for control PA or OA condition, respectively), using two or three mice trials. Both PA and OA condition showed no significant difference (P > 0.5) from controls.

 This work is licensed under a