

Abstract
Hypocretins (orexins) are recently discovered hypothalamic neuropeptides that have been implicated in the etiology of narcolepsy. The normal behavioral functions of these peptides are unclear, although a role in feeding has been suggested. We measured hypocretin-1 (Hcrt-1) in the cerebrospinal fluid of dogs during a variety of behaviors. We found that 48 h without food (24 h beyond normal 24-h fasting period) produced no significant change in Hcrt-1 levels nor did feeding after the deprivation. In contrast, 24 h of sleep deprivation produced on average a 70% increase in Hcrt-1 level compared with baseline levels. The amount of increase was correlated with the level of motor activity during the sleep-deprivation procedure. A 2-h period of exercise in the same dogs produced a 57% increase in Hcrt-1 levels relative to quiet waking levels, with the magnitude of the increase being highly correlated with the level of motor activity. The strong correlation between motor activity and Hcrt-1 release may explain some of the previously reported behavioral, physiological, and pathological phenomena ascribed to the Hcrt system.
Keywords: cerebrospinal fluid, locomotor activity, feeding, orexin
THE HYPOCRETINS (Hcrts; also known as orexins) are recently discovered peptides synthesized only in hypothalamic neurons (6, 44). Loss of Hcrt neurons (56) and reduced levels of Hcrt mRNA in the brain (42) have been shown to be linked to human narcolepsy, a disorder characterized by abrupt losses of muscle tone called cataplexy, a related symptom called sleep paralysis, overwhelming daytime sleepiness, and disrupted nighttime sleep (2). Null mutant mice in which the Hcrt peptides are not synthesized (6) and mice in which Hcrt neurons are ablated by insertion of the ataxin-3 gene (16) have symptoms of narcolepsy, as do dogs with mutations of the Hcrt-2 receptor (62) and rats with saporin lesions of Hcrt neurons (13).
Initial work on the Hcrts emphasized their putative role in appetite control, hence the name orexin, from the Greek word for appetite. It was reported that intracerebroventricular injection increased food consumption (44). Dube et al. (8) and Sweet et al. (51) identified some hypothalamic sites at which microinjection of Hcrt-1 increased feeding. However, other studies on the appetite relations of Hcrt produced mixed results. Edwards et al. (9) and Ida et al. (17) found that appetite was increased by intracerebroventricular injection but that the effect was weak compared with that of neuropeptide Y (NPY). Yamanaka et al. (64) found that continuous intracerebroventricular infusion of Hcrt-1 increased feeding during the daytime (the normally inactive phase) but had no effect on total feeding. Similarly, Kotz et al. (25) reported that microinjection of Hcrt-1 into the lateral hypothalamus stimulated feeding during the light but not during the dark period. Conversely, it was reported that food deprivation raised Hcrt-1 levels during the light period but did not further elevate levels during the dark (12). An increase of locomotor activity associated with food deprivation (18, 31, 33) cannot be ruled out as the cause of the raised Hcrt-1 levels. Intracerebroventricular injection and direct microinjection are nonphysiological means of transmitter delivery in terms of their concentration gradients and anatomic distribution. Consequently, behavioral effects produced by such means need to be confirmed with other techniques before one can conclude that they represent the normal function of the applied agonist.
To clarify the normal functions of Hcrts, we measured Hcrt-1 levels in the cerebrospinal fluid (CSF) during food deprivation, feeding, motor activity, and sleep deprivation. These results have been reported in preliminary form (63).
MATERIALS AND METHODS
Animals.
Seventeen adult genetically narcoleptic (mean age = 2.4 ± 0.4 yr; 12 females, 5 males) and seven adult normal (mean age = 2.4 ± 0.9 yr; 3 females, 4 males) Doberman pinscher dogs were used in this study. All the procedures were conducted in accord with the National Research Council Guide for the Care and Use of Laboratory Animals (38) and the American Physiological Society’s “Guiding Principles For Research Involving Animals and Human Beings” (3) and were approved by the Institutional Animal Care and Use Committee of the University of California at Los Angeles and the Department of Veterans Affairs.
CSF collection.
Aseptic procedures were used for CSF collection under thiopental anesthesia (12.5 mg/kg iv). All baseline and experimental CSF collections were done between 9 and 11 AM to control for circadian effects on Hcrt levels, although the dog has relatively weak circadian sleep, activity, and endocrine rhythms (53). Baseline CSF collections were done before the morning meal (food was given after the collection). CSF was collected from the cerebellomedullary cistern just behind the occipital protuberance. After disinfecting the area with applications of a surgical scrub and 70% alcohol, a 22- or 20-gauge, 1.5- or 2.5-in. spinal needle was inserted perpendicular to the skin in the midline half-way between the occipital protuberance and the line joining the wings of the atlas. Once the cistern was punctured, 1.0 ml CSF was collected in a sterilized polypropylene vial and then quickly frozen at −20°C within 5 min of the initial injection of anesthetic. Vital signs (electrocardiogram, oxygen saturation, respiration, and temperature) were monitored during and after the procedure.
Hcrt-1 was extracted from 1-ml samples with a reverse-phase SEP-PAK C18 column. Samples were acidified with 1% trifluoracetic acid (TFA) and loaded onto the C18 SEP-Column (Waters, Milford, MA). The peptide was eluted with 1% TFA/40% acetonitrile. The eluant was then dried down and resuspended in RIA buffer before assay. The Hcrt-1, iodinated Hcrt-1, and Hcrt-1 antiserum were obtained from Phoenix Pharmaceuticals, Cat. #RK-003–30 (Belmont, CA). Hcrt-1 and Hcrt-2 are cleaved from the same precursor peptide and are generally thought to be found in the same neurons (7, 44). Hcrt-2 is much less stable than Hcrt-1 (22) and was not measured in the current study. The solid-phase peptide assay (32) provided an IC50 of 3.8 ± 0.7 fmol and a limit of detection of ~0.2 fmol.
Actigraphy.
The activity of the dogs was monitored continuously for 24 h/day with collar-mounted actigraphs (Actiwatch, Mini Mitter, Sundriver, OR) as described earlier (20). Data were downloaded to a personal computer and further analyzed by a program of our design. The program could integrate total numbers of movements above a preset amplitude for measurements of activity (total activity, total duration of activity/inactivity, and average duration of activity/inactivity bouts) in 30-s epochs. The actigraphic correlates of sleep were determined by simultaneous polygraphic and actigraphic monitoring (20). We found that sleep onset and sleep time could be identified by a reduction in actigraphic activity to <10 actigraphic units within each 30-s epoch.
Food deprivation and intake.
Six normal dogs were used in this study. Dogs were fed daily at 9 AM with a mixture of Eukanuba Adult Maintenance feed (600 g) (The IAMS, Dayton, OH) and Pedigree chopped beef (375 g) (Kal Kan Foods, Vernon, CA) in a bowl. The 48-h food-withholding procedure (24 h beyond their normal 24-h fasting interval) started immediately after feeding on day 1. The normal morning feeding on day 2 was omitted, with continued water availability. At the end of food deprivation on day 3, CSF was collected between 9 and 10 AM or food was first reintroduced at the regular time and CSF was collected immediately (<5 min) or 30 min or 60 min after feeding. All the dogs finished the food entirely within 1–2 min of presentation. CSF was collected 1 wk apart between trials.
Sleep deprivation.
A 24-h total sleep deprivation began at 9 AM after feeding. A total of 13 dogs, 7 narcoleptics and 6 normals, was used. Both normal and narcoleptic dogs average between 9 and 12 h of sleep over the 24-h period under ad libitum sleep conditions (20, 30). During sleep deprivation, dogs stayed in their home cage (3.3 × 1.1 m) during the day and in a room (5.5 × 3.4 m) during the night. Gentle handling, sound, or short-walk strategies were used to deprive them of sleep. No food was available during deprivation. The activity level of nine of these dogs (5 narcoleptic and 4 normals) was monitored throughout the deprivation period using the Actiwatch system. Four pairs of dogs (2 narcoleptic and 2 normals), one sleep deprived and one yoked control, underwent sleep deprivation during which the yoked control was allowed to sleep whenever the sleep-deprived one was awake. In two of the pairs (both normals), their roles were reversed during another trial of sleep deprivation in which the deprived became yoked control and vice versa. The same amount of stimulation was given to both the sleep-deprived and the yoked control whenever the sleep-deprived one was falling asleep. At other times, the yoked control was allowed uninterrupted sleep. To summarize, one of the subjects had undergone one unpaired sleep deprivation, one was involved in two paired sleep deprivations (1 time as the deprived and another time as the yoked control), four were involved in one paired sleep deprivation, and the other three were involved in one unpaired sleep deprivation and two paired sleep deprivations. In all, 16 data points were available, not including baseline. These data points were treated as independent samples in the analysis. The activity measurements of three subjects during one sleep deprivation were unavailable due to instrumental failure; therefore 29 data points (13 deprivation plus 16 baseline points) were used in the correlation between activity and percent total sleep and between activity and Hcrt-1 level. CSF was collected immediately at the end of the 24-h sleep-deprivation period and again at 24 and 48 h after the termination of sleep deprivation before the morning meal. Baseline Hcrt-1 and activity level were determined a week before sleep deprivation between 9 and 11 AM before the morning meal while the animals were in quiet waking state.
Activity.
Dogs (17 narcoleptics and 7 normals) were encouraged to run and play in an outdoor exercise area (26.7 × 17.7 m) for 0, 30, 60, or 120 min before CSF collection, with concurrent quantification of motor activity by actigraphic measurement. The 2-h exercise period occurred between 8 and 11 AM. No food was available during exercise. CSF collections for baseline and each exercise condition were done 1 wk apart. Baseline Hcrt-1 level was determined after the animals had 2 h of quiet waking in their home cage. Their activity measurements were calculated in 30-, 60-, and 120-min episodes to match the exercise conditions. For the 30-min exercise, the dogs were released into the exercise area after 1.5 h of wake period in their home cage. For the 1-h exercise, the dogs were released into exercise area after 1 h of wake period in their home cage. For the 2-h exercise, the dogs were in the exercise area for the entire 2-h period.
The animals were continuously monitored to ensure that they remained awake for the entire 2-h period in all baseline and exercise conditions. However, it was not necessary to intervene in any way to maintain waking during this period in either group because the sampling was occurring during the dog’s normal waking period. Not every dog was involved in every experimental manipulation. Although most normals were involved in all three exercise conditions, most narcoleptics were involved in one to two conditions. Overall, 46 data points were collected in which activity measurements were available (26 data points from 7 normals and 20 data points from 17 narcoleptics) and included both baseline and exercise conditions.
Data analysis.
Activity and sleep measurements at various times before CSF collection were calculated from the actogram and correlated with CSF Hcrt-1 level. Changes of Hcrt-1 level were analyzed with ANOVA, followed by post hoc comparisons using Fisher’s least significant difference (LSD) test.
RESULTS
Food deprivation and feeding.
Hcrt-1 levels were not elevated by withholding food for 48 h; there was no difference between baseline Hcrt-1 level and that after food deprivation (49.7 ± 3.2 vs. 45.4 ± 3.1 fmol/ml). Hcrt-1 levels were also not significantly decreased (or increased) after feeding [P > 0.2, F(4,20) = 1.43, ANOVA] (Fig. 1). The baseline Hcrt-1 level was similar to that of 2- to 6-wk-old dogs with food available ad libitum (20). There was also no significant change in motor activity assessed actigraphically across these conditions [P > 0.1, F(4,20) = 2.22, ANOVA].
Fig. 1.
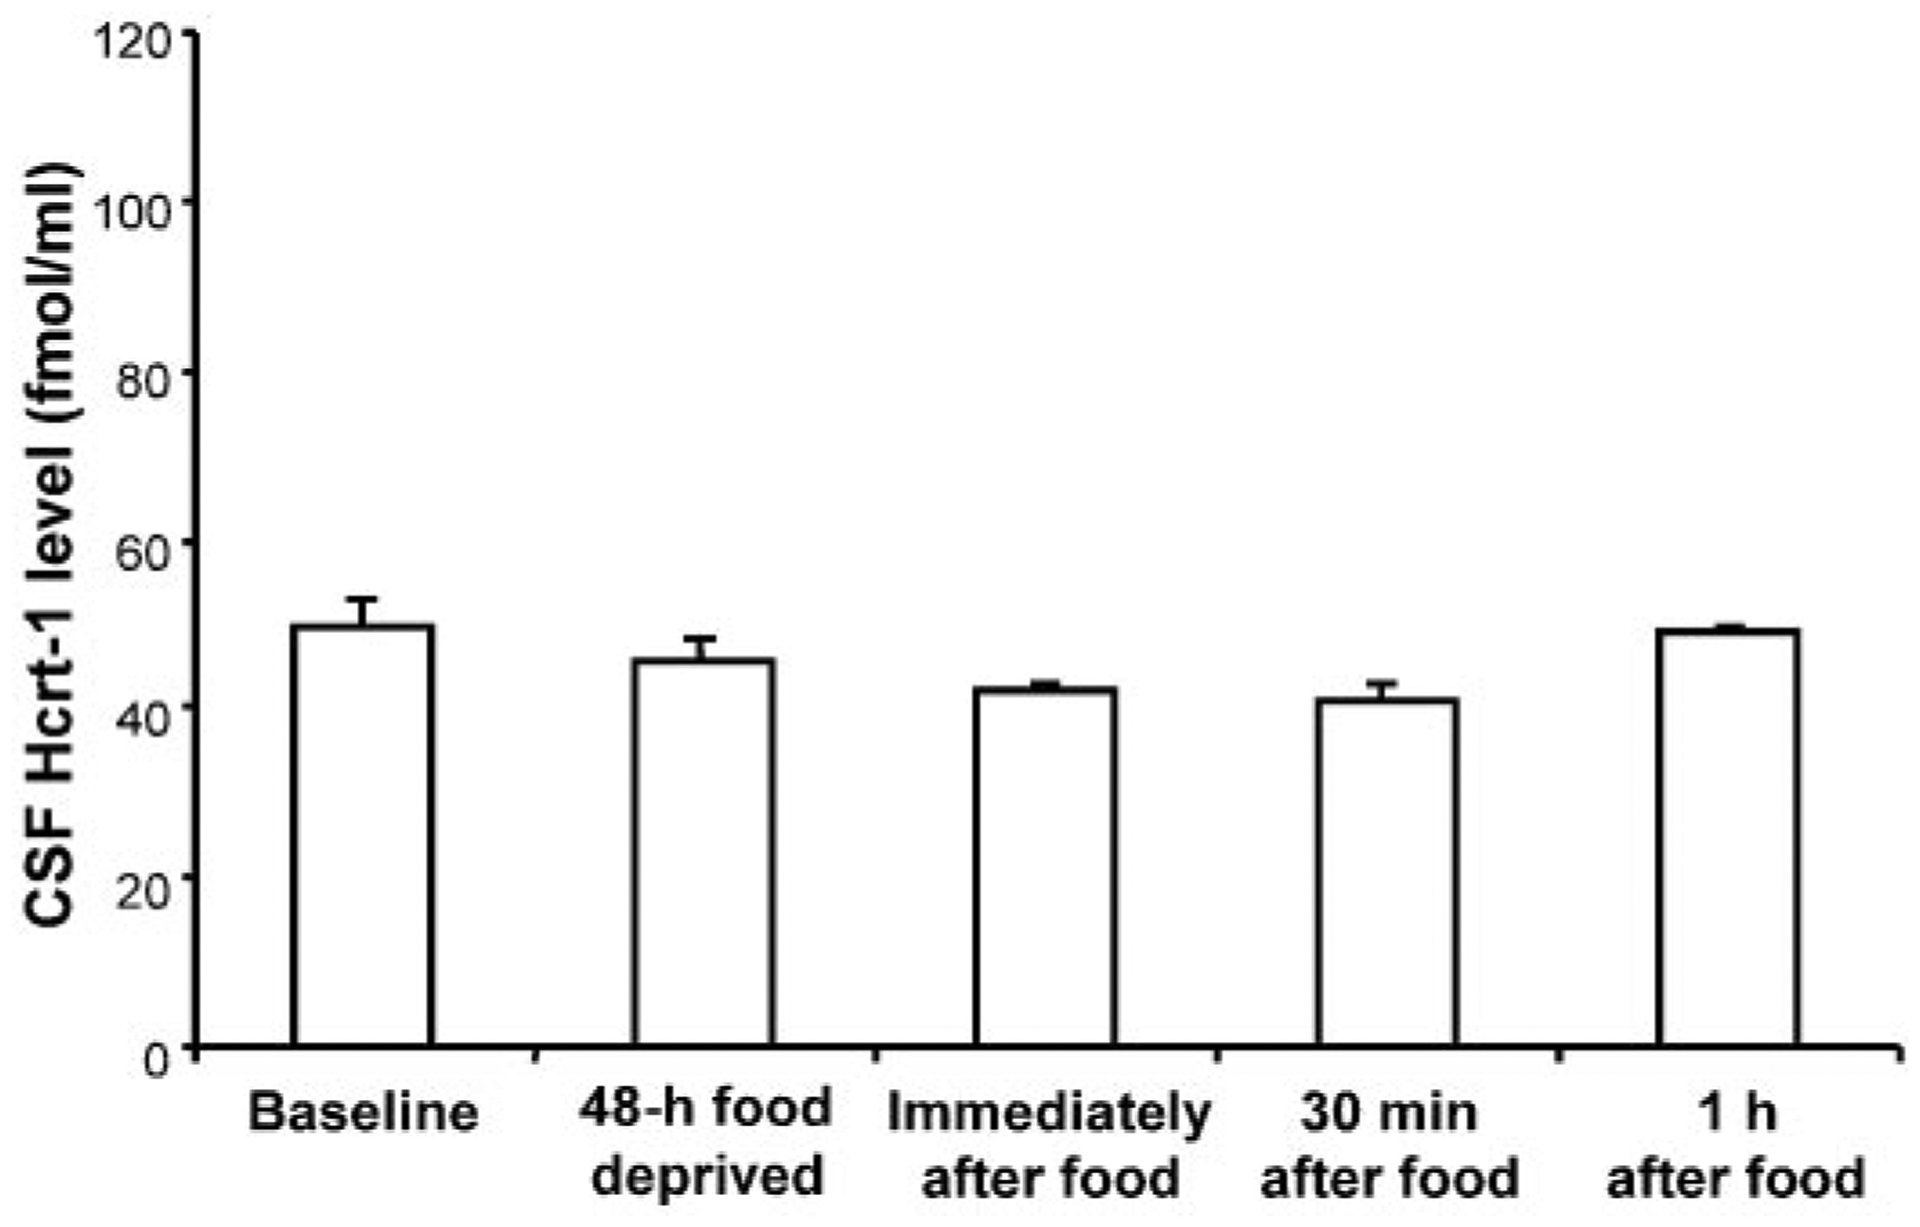
Cerebrospinal fluid (CSF) hypocretin (Hcrt)-1 level after 48 h without food (n = 6) and immediately (n = 5), 30 min (n = 5), or 1 h (n = 6) after eating following food deprivation in normal dogs. No significant changes were seen (ANOVA). Hcrt-1 level was not increased with food deprivation nor was it decreased with feeding.
Sleep deprivation and Hcrt.
A 2 × 2 × 4 ANOVA with factors of sleep deprivation status (sleep deprived vs. yoked control), genetic status (normals vs. narcoleptics), and time point (baseline, immediately after 24-h sleep deprivation, 24 h postdeprivation, and 48 h postdeprivation) was performed. Total sleep deprivation for 24 h produced a significant increase in Hcrt-1 level in the CSF; there was a significant effect of time point [F(3,24) = 12.70, P < 0.0001]. There was no significant effect of deprivation status [F(1,8) = 0.35, P > 0.5]. Figure 2 shows the data with deprivation factor collapsed. Post hoc comparisons showed that 24-h sleep deprivation produced a significant increase in Hcrt-1 level in the CSF for both the normals and narcoleptics, compared with the baseline (P < 0.01, Fisher’s LSD). Hcrt-1 level returned to baseline level within 24 h after the end of sleep deprivation. There was no difference in the magnitude of the deprivation-induced increase between narcoleptics and normals [F(1,8) = 0.01, P > 0.9], with a mean increase of 70%. There was also no difference in the basal CSF Hcrt-1 level between narcoleptics (50.8 ± 8.1 fmol/ml) and normals (59.1 ± 10.5 fmol/ml).
Fig. 2.
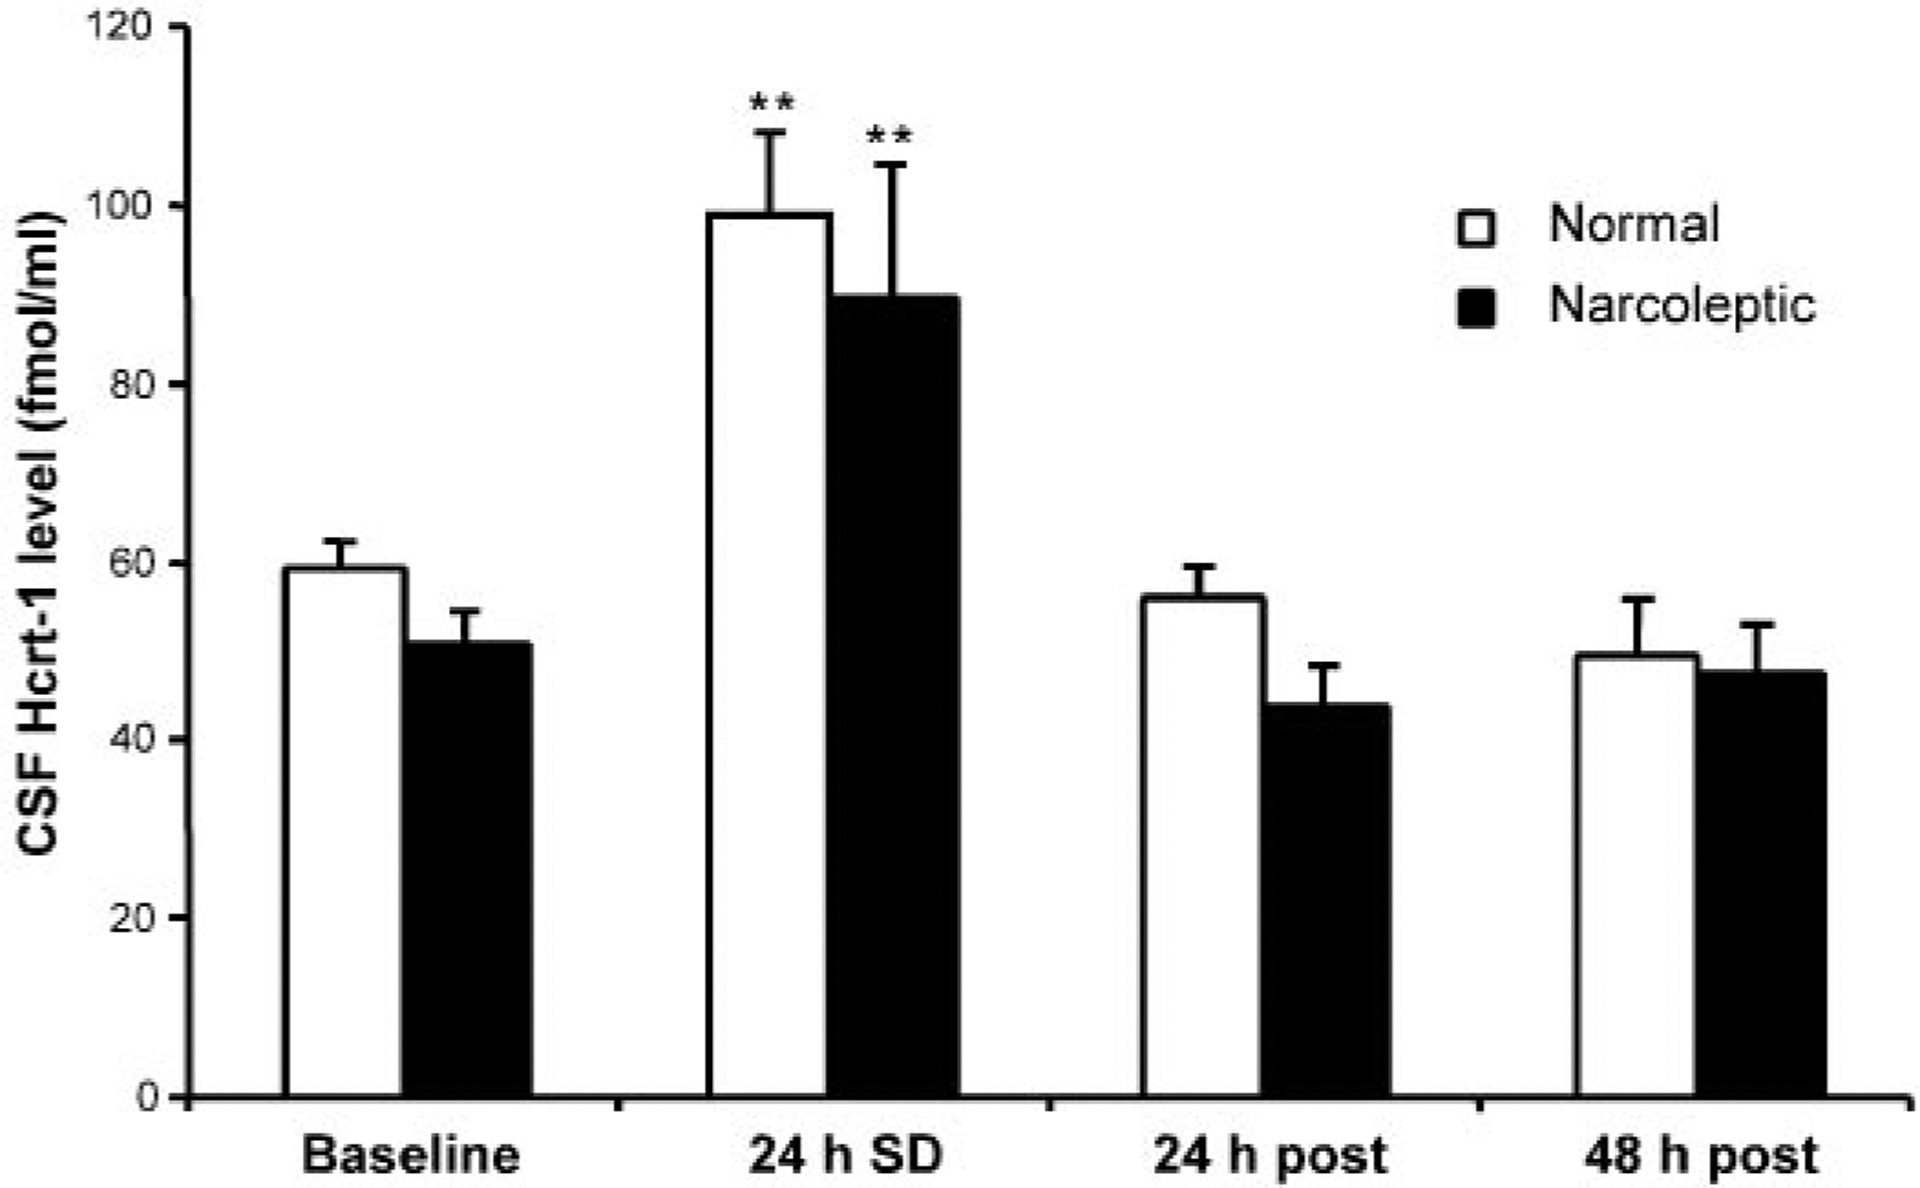
Sleep deprivation induced changes in Hcrt level in CSF. Sleep deprivation was correlated with an increase in Hcrt-1 level. Data represent Hcrt-1 level at the termination of 24-h sleep deprivation (24 h SD) and at 24 h (24 h post) and 48 h (48 h post) after the sleep deprivation. Normal: normal dogs (n = 6); narcoleptic: narcoleptic dogs (n = 7). **P < 0.01 Fisher’s least significant difference (LSD) test compared with baseline.
Because motor activity is necessarily increased during sleep deprivation, we quantified the level of activity and sleep during the sleep-deprivation procedure using collar-mounted actigraphs. We found that activity and sleep during this procedure were significantly correlated with each other (r = −0.79, df = 27, P < 0.0001; Fig. 3). The amount of sleep during the deprivation procedure was significantly correlated with the change in Hcrt level (r = −0.66, df = 30, P < 0.0001; Fig. 4). This relation held for both the narcoleptic (r = −0.75, P < 0.02, n = 10) and normal dogs (r = −0.67, P < 0.001, n = 22). However, we also found that the increase in activity during the procedure was significantly correlated with the change in Hcrt level (r = 0.61, df = 27, P < 0.0005, last 24 h) (Fig. 5). A partial correlation of sleep with Hcrt level, holding activity constant, was not significant (r = −0.20, df = 27, P > 0.2). However, a partial correlation of activity with Hcrt level, holding sleep constant, was significant (r = 0.46, df = 27, P < 0.02).
Fig. 3.
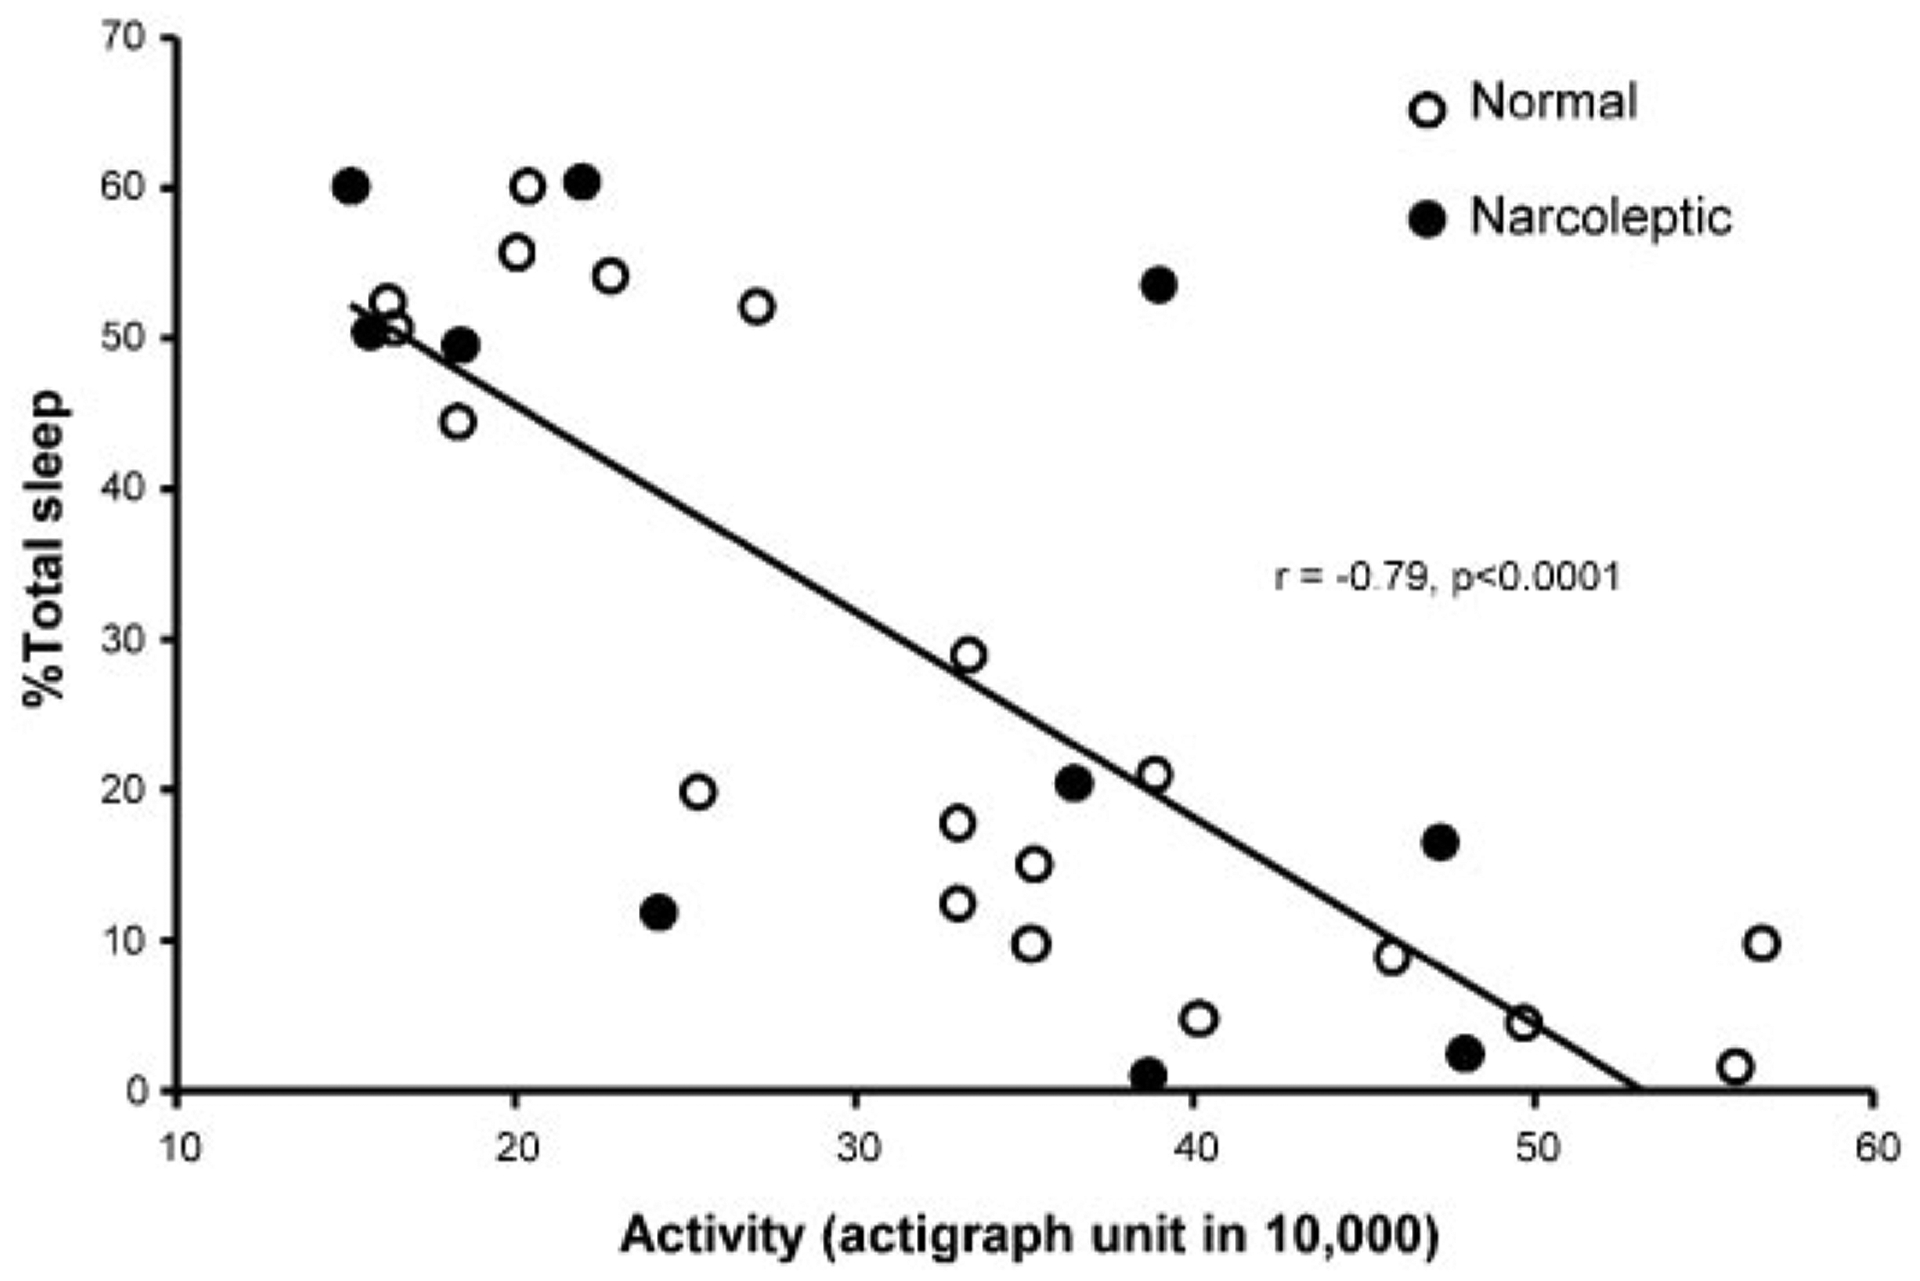
Correlation of 24-h total activity level and percentage sleep time during baseline and sleep deprivation. Percentage of sleep is negatively correlated with increased activity in 29 runs with actigraph data.
Fig. 4.
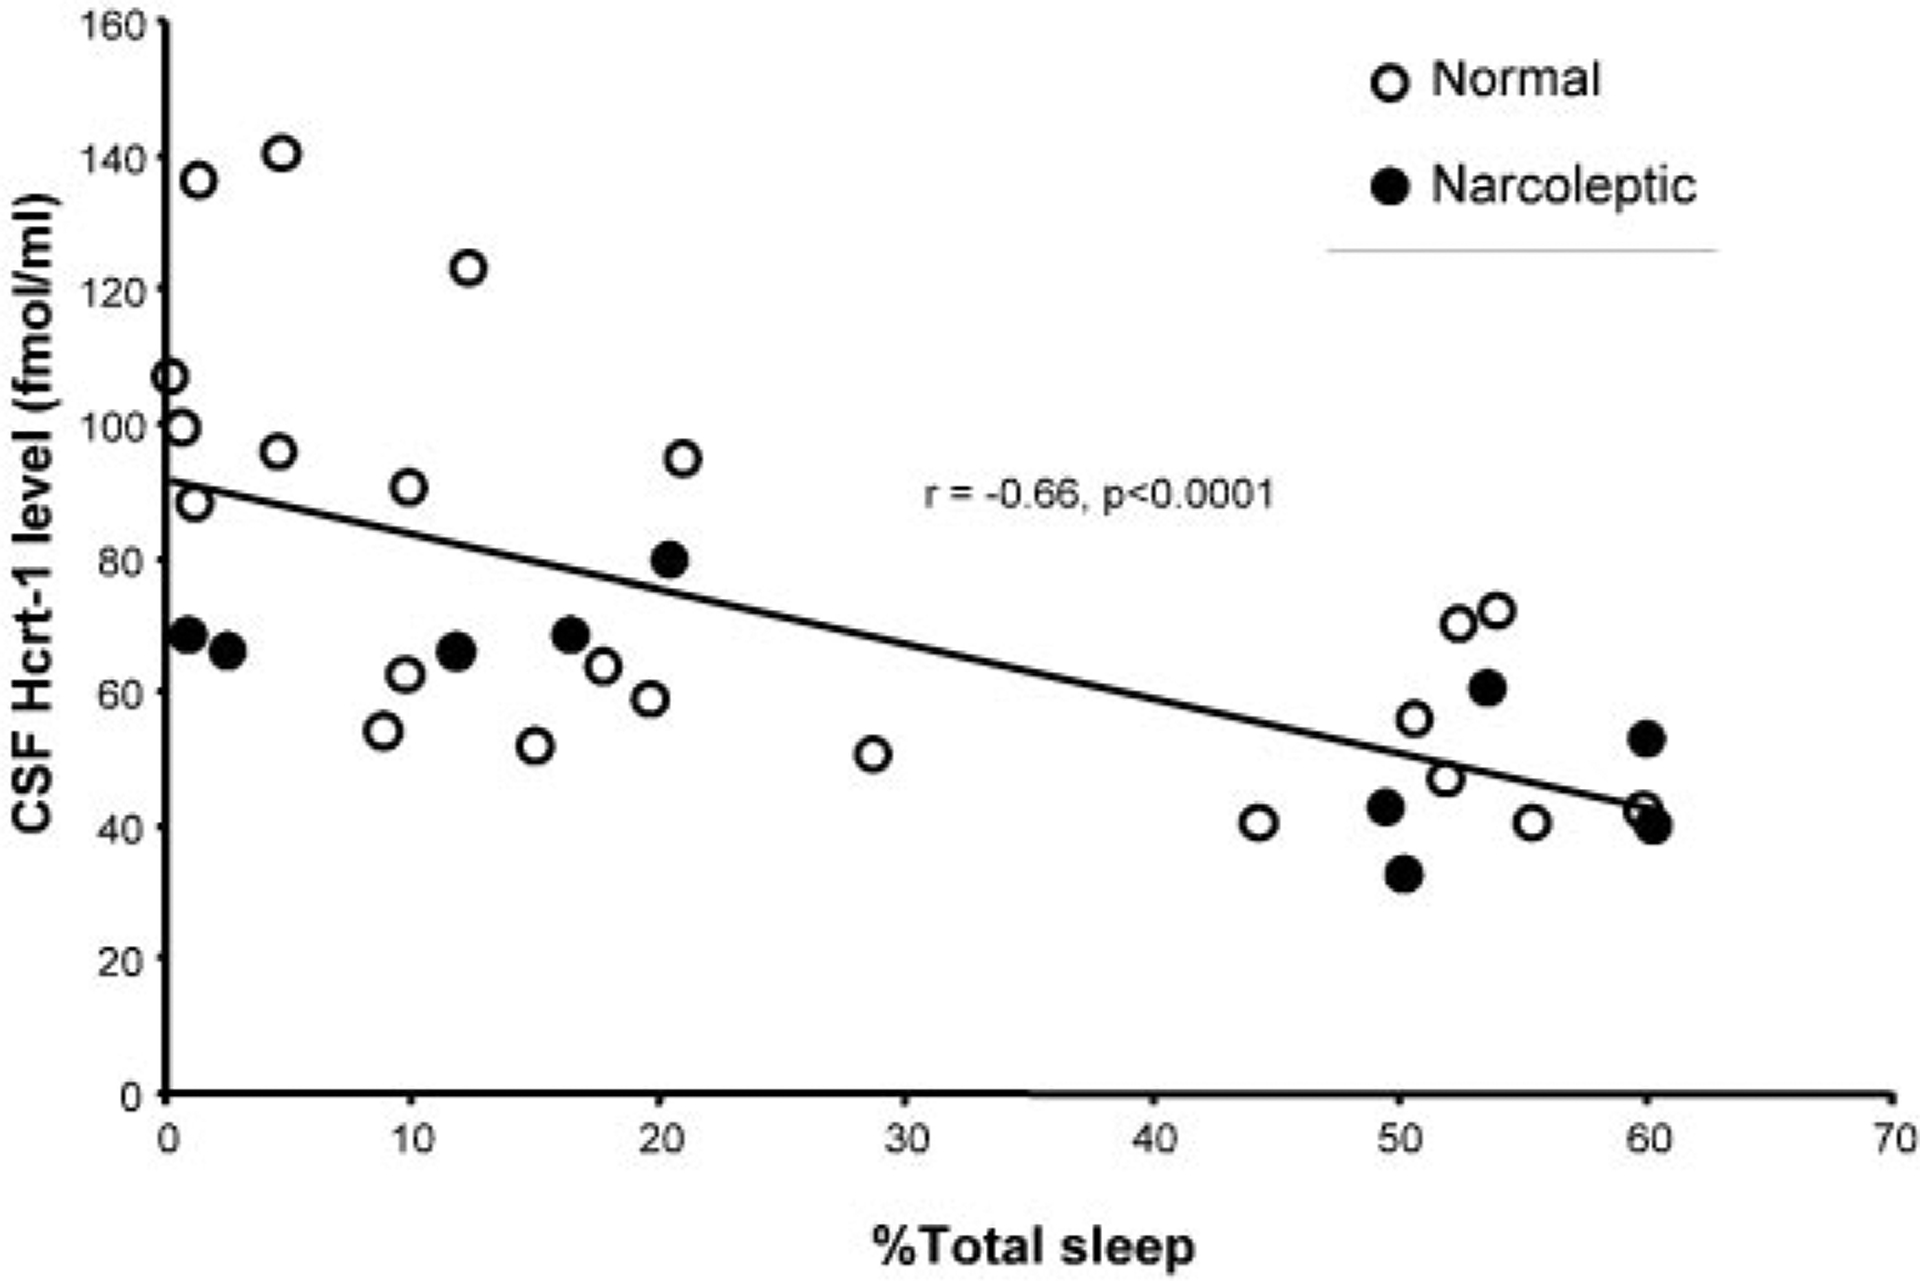
Percentage time asleep during baseline and sleep deprivation are negatively correlated with Hcrt-1 level. Overall, 32 data points were collected from 9 animals in which activity was measured and included Hcrt-1 levels in both baseline (n = 16) and those after sleep deprivation (n = 16).
Fig. 5.
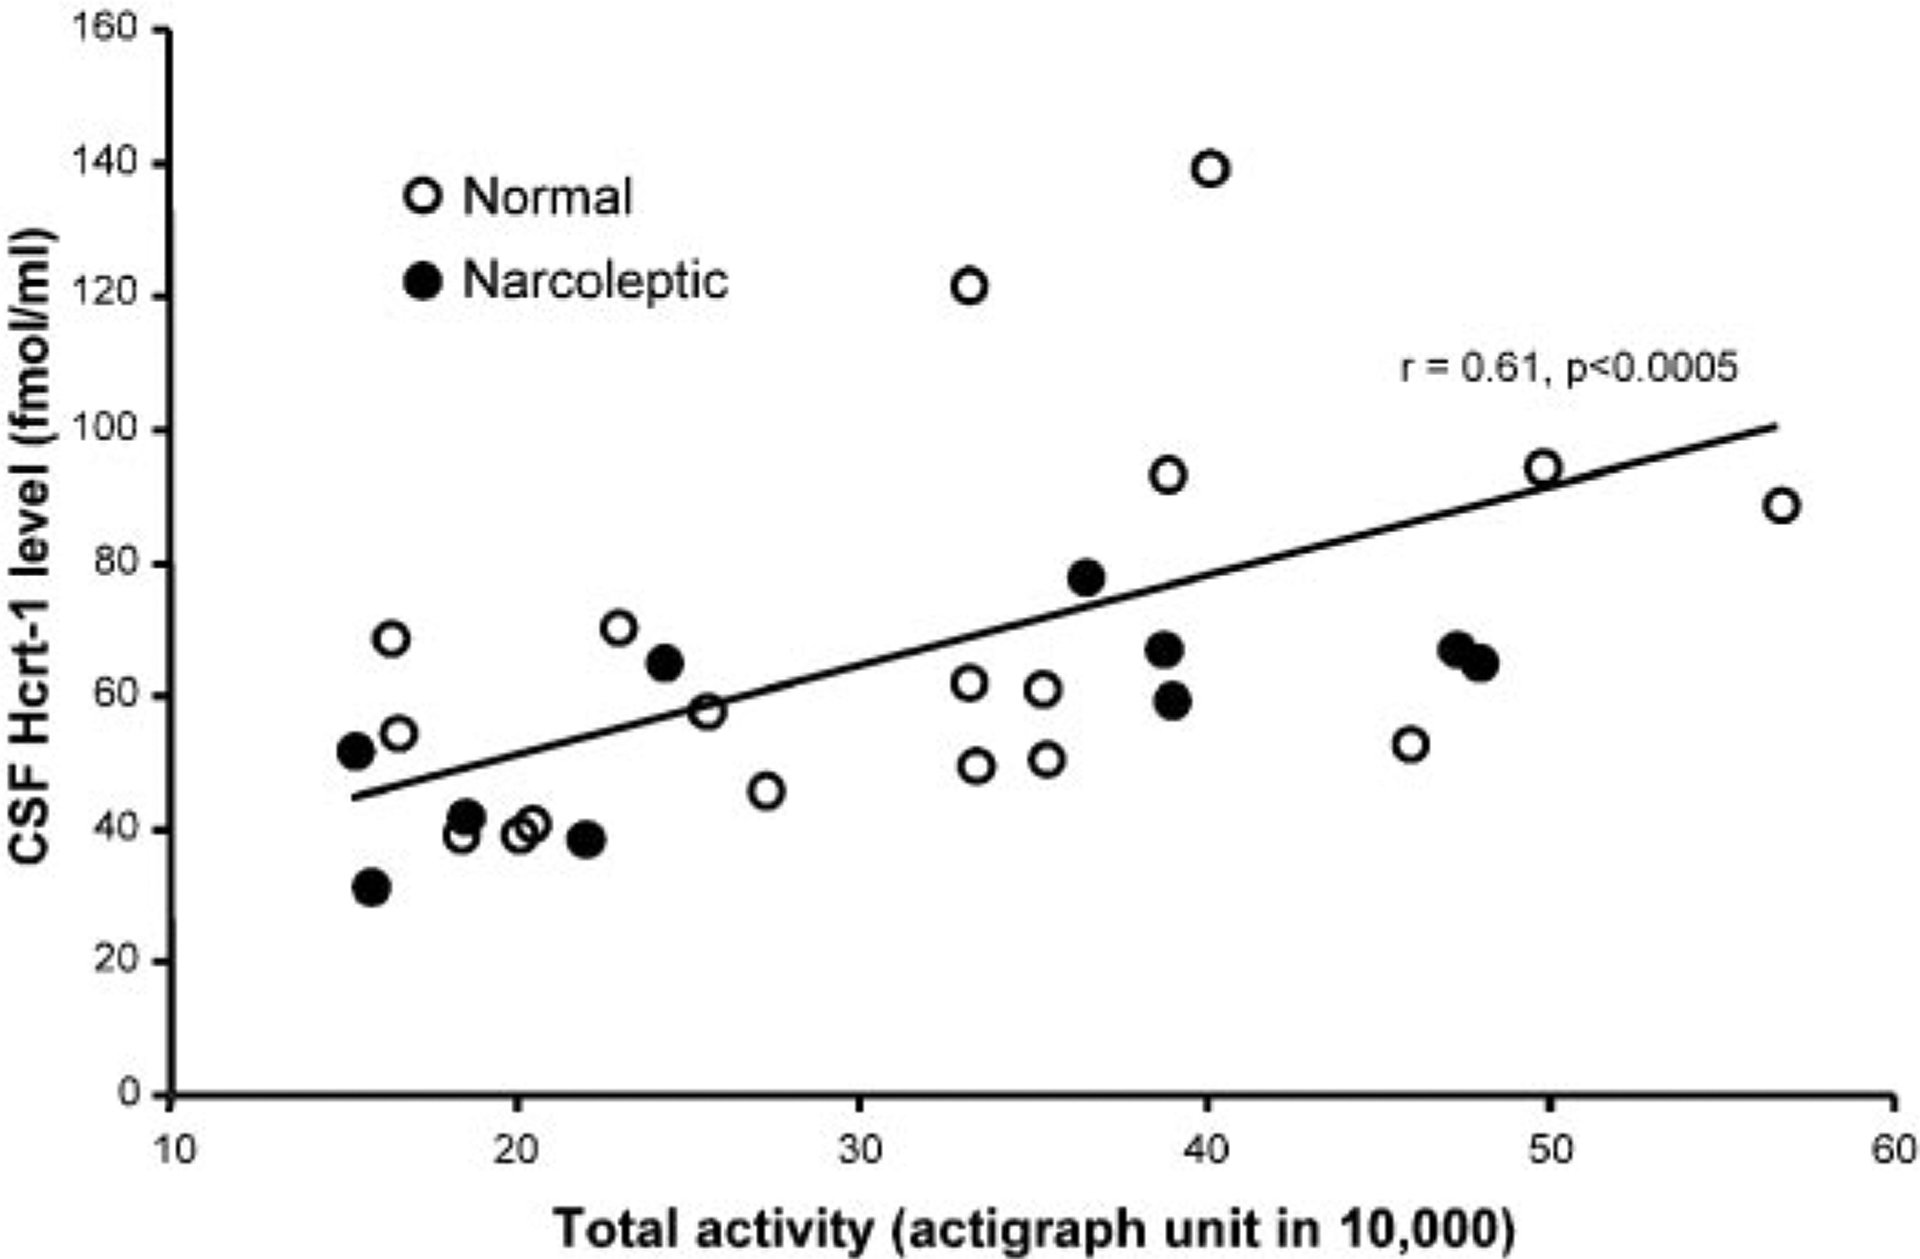
Twenty-four-hour total activity level during sleep deprivation is positively correlated with Hcrt-1 level (n = 29).
To clarify the motor role in the sleep deprivation-linked elevation of Hcrt level, we examined the sleep loss and activity levels in yoked pairs of sleep-deprived (n = 6) and control (n = 6) dogs. In these pairs, we systematically disturbed the controls in the same way the experimentals were disturbed but restricted this disturbance to waking periods. The activity levels of the yoked and experimental dogs did not differ during the procedure (t = 0.68, df = 10, P > 0.5; 44.6 ± 3.2 actigraph units in 10,000 in deprived vs. 40.8 ± 3.6 in controls), although the distribution of the activity periods differed, with the yoked animals having more long-duration periods of activity, corresponding to sleep. As expected, the deprived dogs showed significantly greater sleep loss than the yoked controls (t = 3.35, df = 10, P < 0.01). However, the deprived and control dogs did not have a significant difference in the elevation of Hcrt levels during the procedure (49.4 ± 17.4 vs. 31.3 ± 18.2%, t = 0.72, df = 10, P > 0.4), consistent with the hypothesis that motor activity was the underlying cause of the Hcrt elevation.
Activity and Hcrt.
To more directly test this hypothesis, we compared Hcrt levels during two types of waking periods. In one, the animals were monitored at a time of day during which they were normally spontaneously awake, to confirm that they remained awake for the 30-, 60-, or 120-min periods. In the other waking period, elicited in a counterbalanced sequence in the same dogs at the same time of day, the dogs were encouraged to run in an exercise yard for 30, 60, or 120 min. Activity was monitored in both conditions with actigraphs. The 120-min exercise periods produced a mean elevation of Hcrt level of over 57%, nearly as large as those resulting from 24 h of sleep deprivation (Fig. 6). This change in Hcrt-1 level was a function of the duration of activity [30, 60, or 120 min; F(3,46) = 4.00, P < 0.02] and type of dogs [narcoleptic vs. normal; F(1,12) = 7.40, P < 0.02]. Normal dogs showed a significant increase of Hcrt after 120 min of activity (P < 0.05, Fisher’s LSD). Narcoleptic dogs had a significant increase of Hcrt after 30, 60, and 120 min of activity (all P < 0.01, Fisher’s LSD). The Hcrt-1 level of the narcoleptic dogs was significantly greater than that of the normals after all durations of activity (all P < 0.05; Fisher’s LSD) but did not differ under baseline conditions.
Fig. 6.
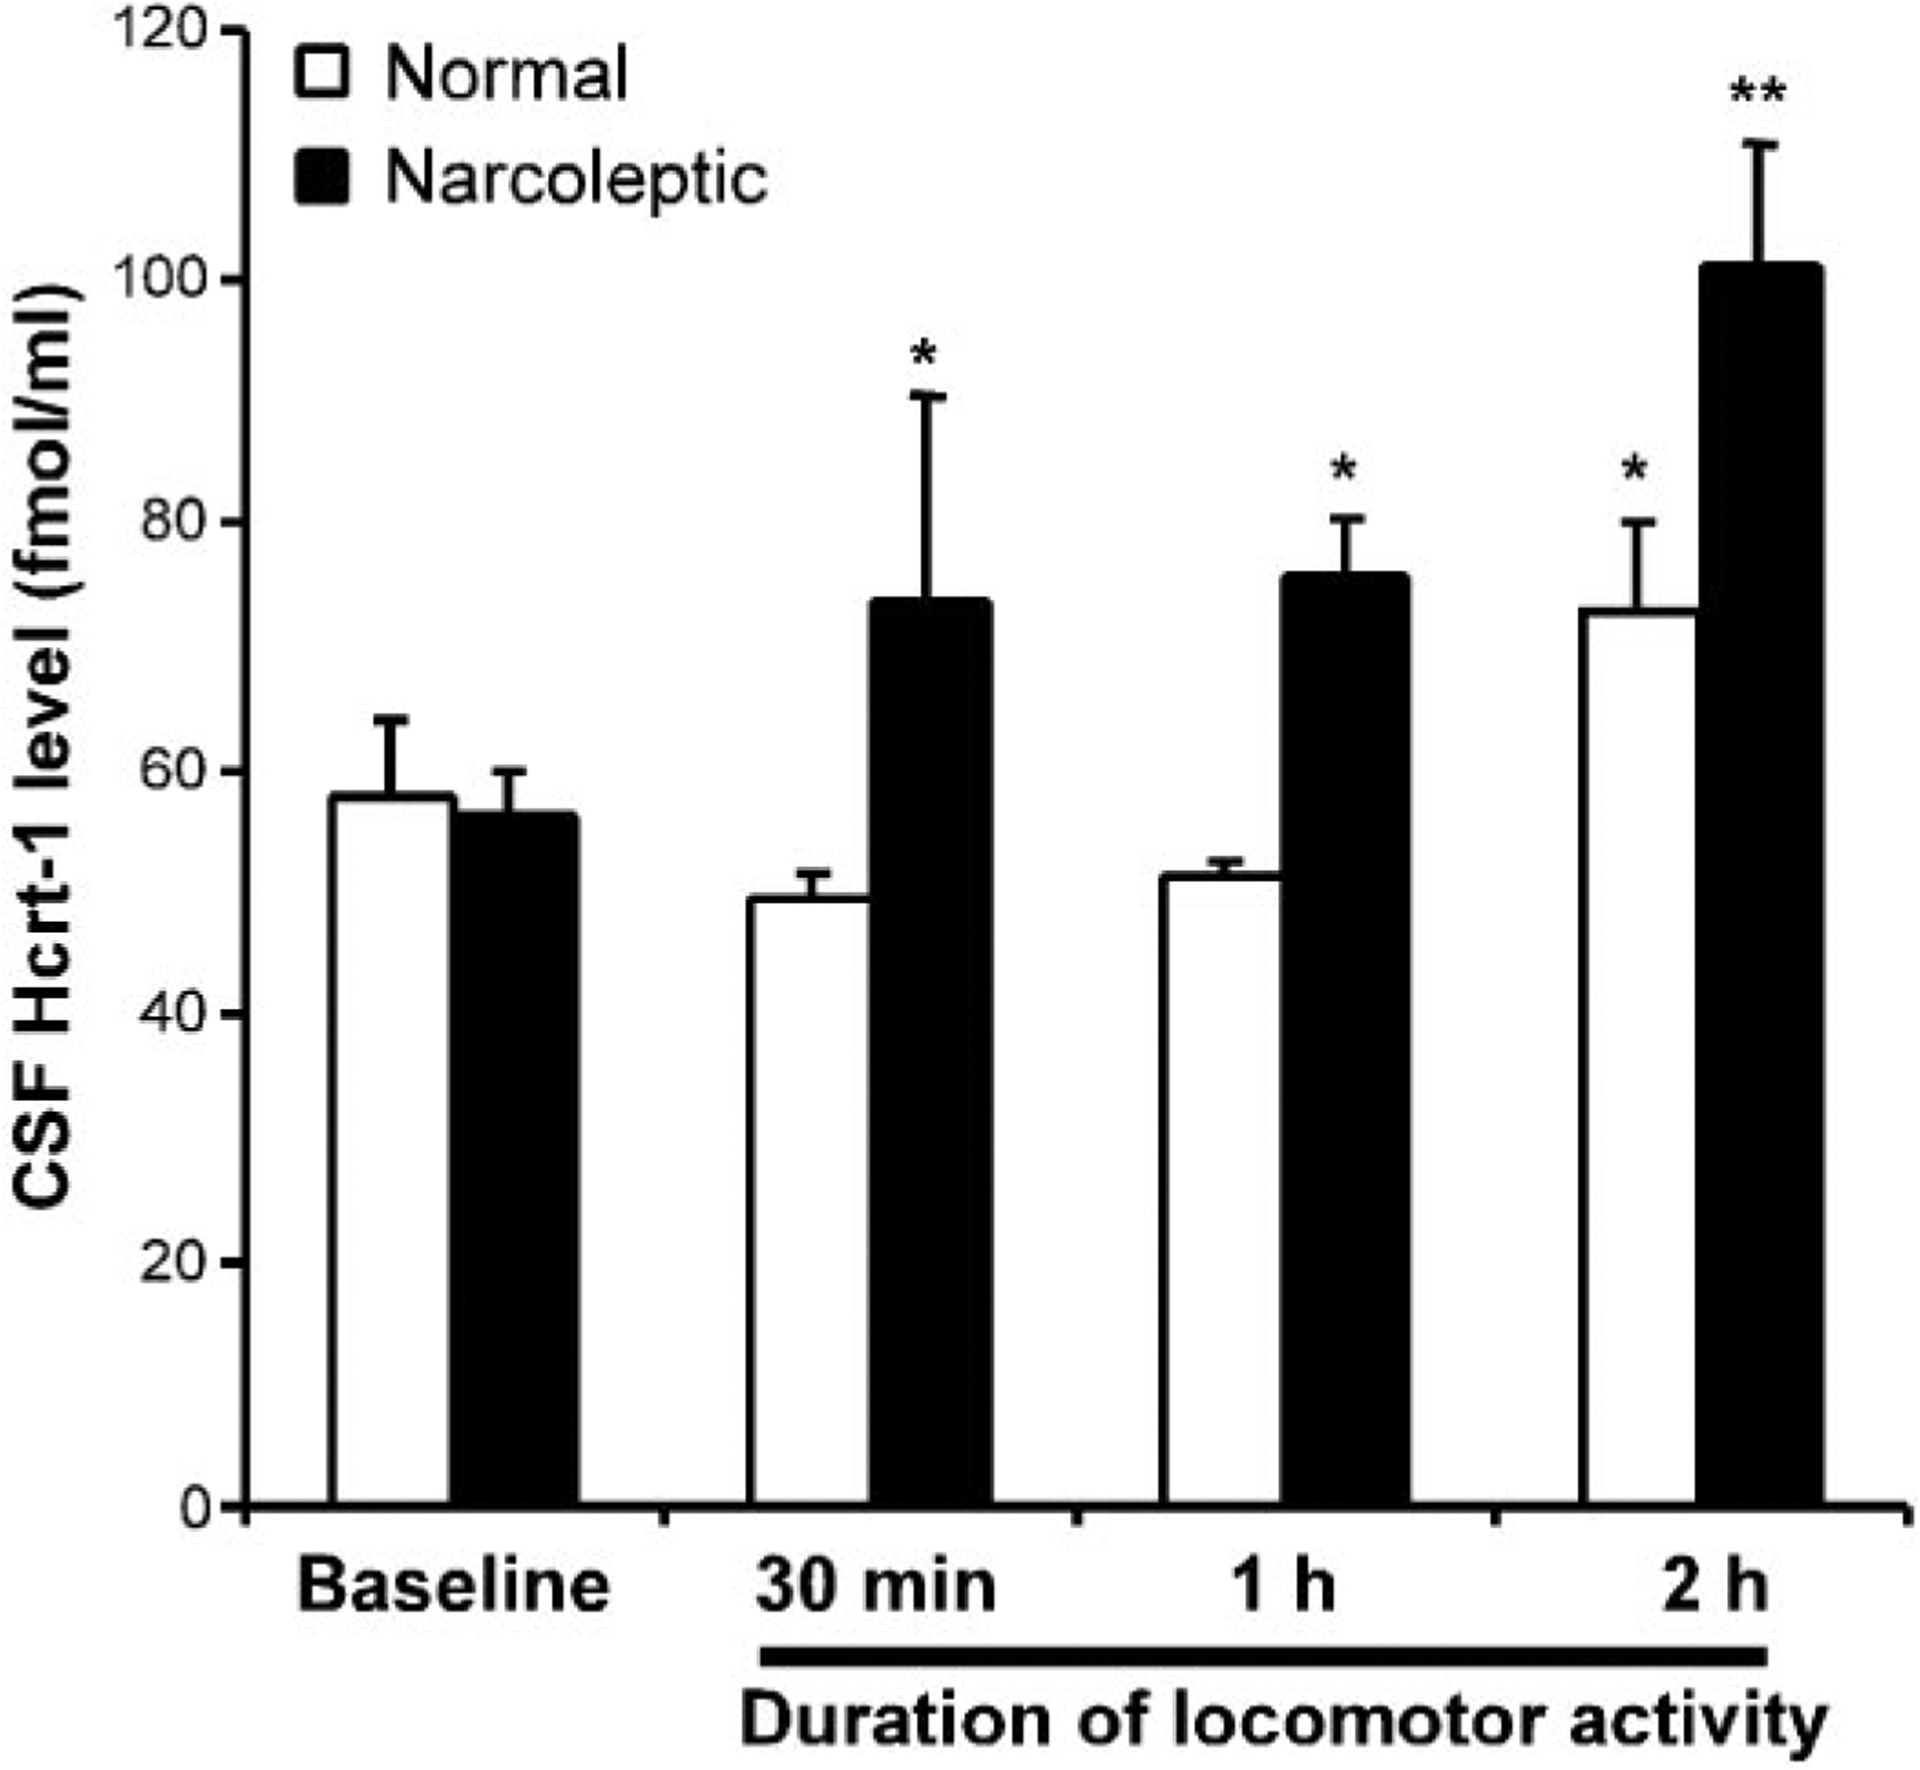
Changes in Hcrt-1 in CSF after 30–120 min of increased locomotor activity. *P < 0.05, **P < 0.01 Fisher’s LSD test compared with baseline. Exercise produced increased Hcrt-1 levels with narcoleptic dogs showing a more rapid and larger magnitude increase.
In a further analysis, we correlated the actual motor activity, determined actigraphically during both baseline and exercise periods, with the Hcrt level and found a highly significant correlation (r = 0.53, df = 45, P < 0.0002; Fig. 7). No sleep occurred during any of the waking periods sampled.
Fig. 7.
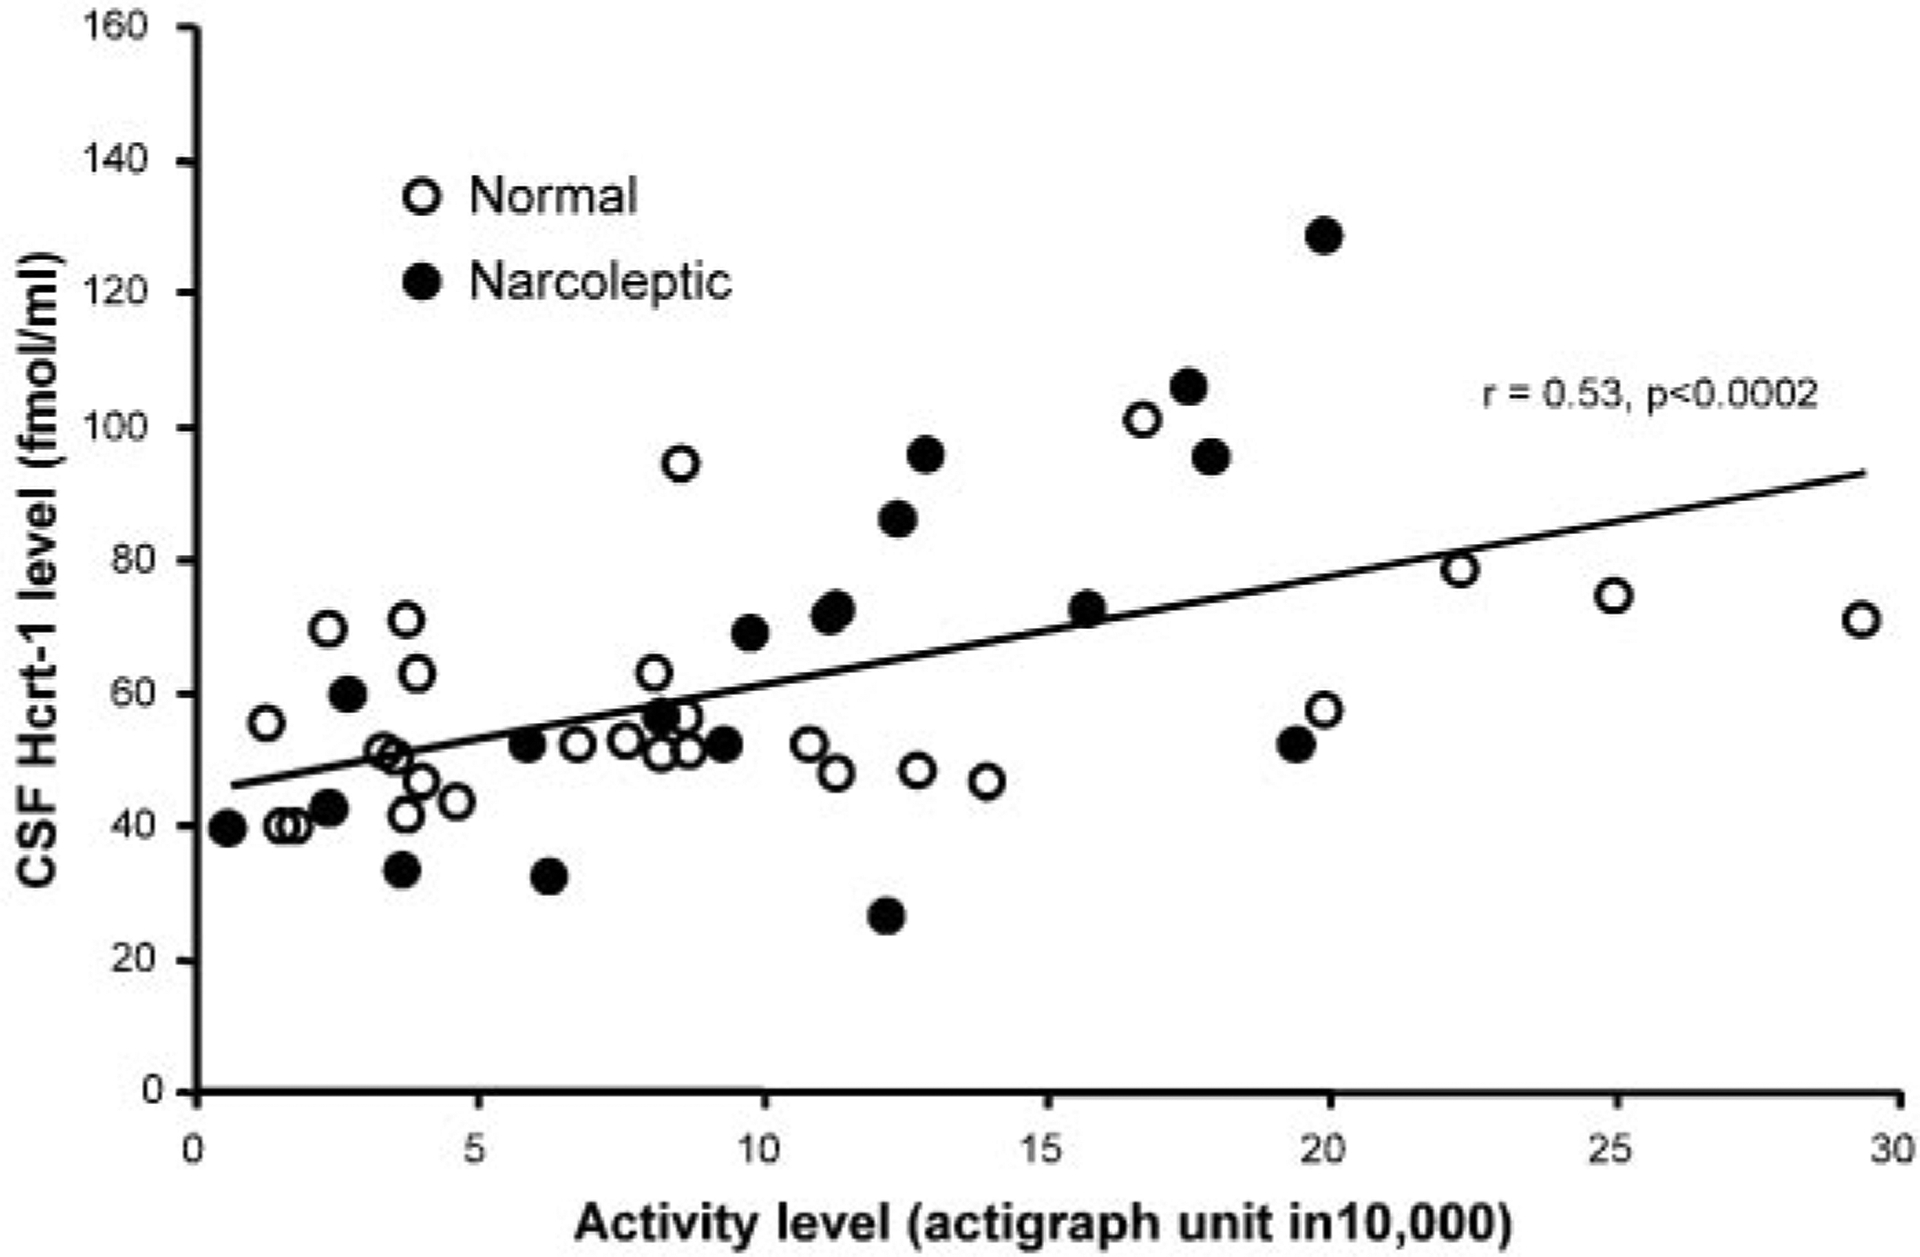
Hcrt-1 level during varying amounts of waking activity in non-sleep-deprived dogs. Data points represent Hcrt-1 levels and activity measures during both baseline and experimental conditions (30-, 60-, and 120-min exercise). A total of 46 data points (26 from normals and 20 from narcoleptics) was collected in which activity was measured. CSF Hcrt-1 level is correlated with the amount of activity before CSF sampling.
Although there was no difference in age between the normal (4 males, 3 females) and narcoleptic (5 males, 9 females) dogs, our normal dogs were significantly heavier than the narcoleptics (34.7 ± 1.5 vs. 25.8 ± 1.1 kg, P < 0.0001, t-test) (Fig. 8). This relation also held if we restricted our comparisons to the female dogs. The normal dogs were less active than the narcoleptics under free running 24-h conditions, but this difference was not significant (P > 0.4, t = 0.76, df = 14).
Fig. 8.
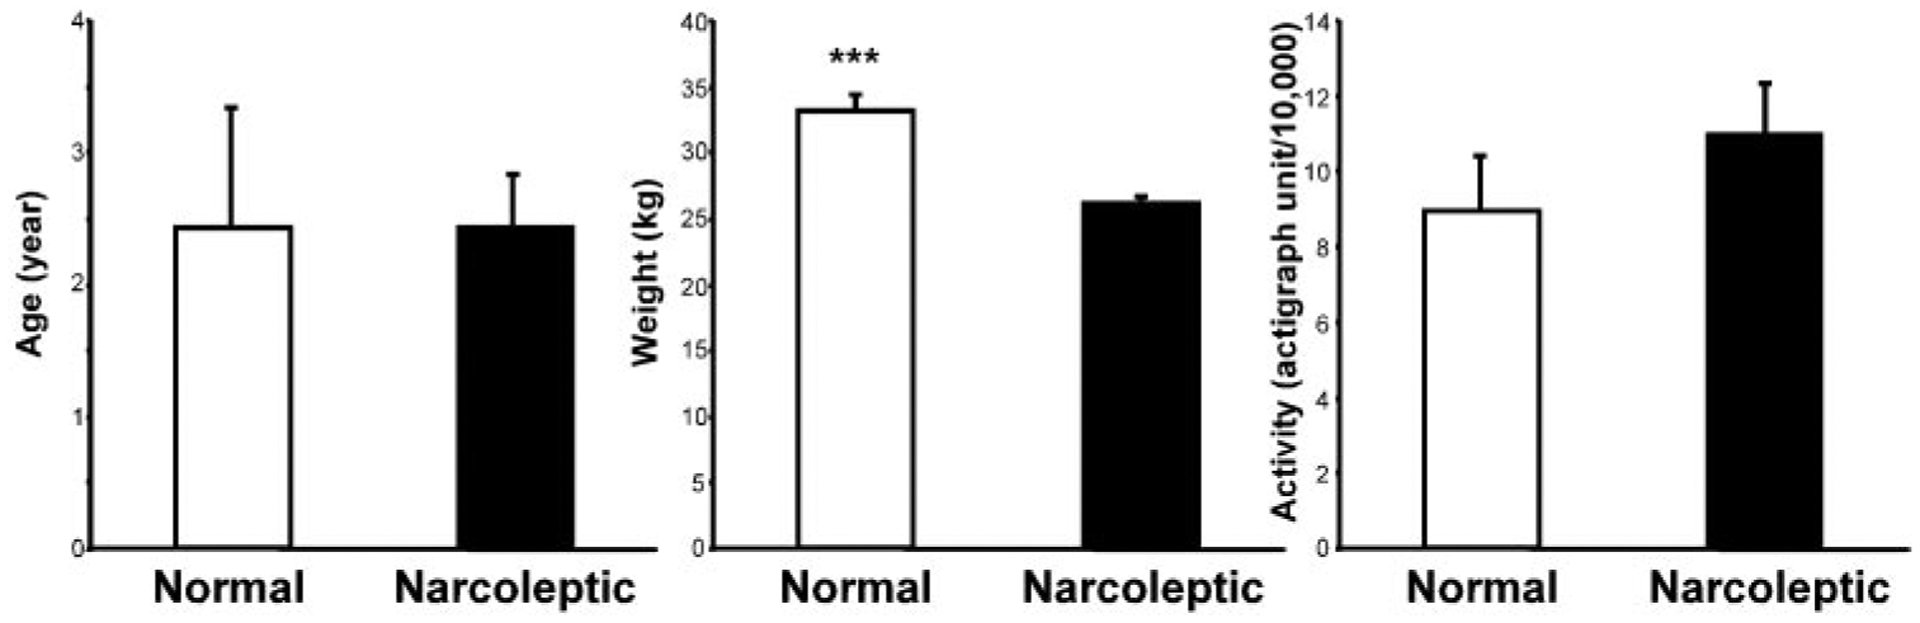
Comparison of age, weight, and activity levels of narcoleptics (n = 14) and normals (n = 7) in the exercise study. ***P < 0.0001, t-test.
DISCUSSION
We find a major effect of motor activity on Hcrt-1 level in the CSF. Two hours of exercise produced a >50% elevation of Hcrt-1 levels in the CSF. We saw a similar increase in Hcrt level in the CSF of normal cats after exercise (24). In the current study, we see a 70% increase of Hcrt level after 24 h of sleep deprivation. However, the “sleep-deprivation” effect that we see was not correlated with the amount of sleep loss. Rather, it was correlated with the activity level during the deprivation procedure. Because we see a comparable increase in Hcrt levels relative to quiet waking levels with exercise alone, the most parsimonious conclusion is that the Hcrt increase observed in the sleep-deprivation procedure is linked to motor activity rather than sleep loss. This interpretation would be consistent with a recent study that found that sleep loss in the mouse and rat does not produce changes in Hcrt mRNA levels (55).
The largest extrahypothalamic projection of the Hcrt system terminates in the locus ceruleus (43) and is excitatory (4, 19). We found that microinjection of Hcrt into the locus ceruleus increases muscle tone in a dose-dependent manner (23). We also reported that cataplexy, the abrupt loss of muscle tone experienced by narcoleptics, is linked to a cessation of locus ceruleus activity in narcoleptic dogs (62). Although the receptor affected in canine narcolepsy, the Hcrt-2 subtype, is not present in the locus ceruleus (which contains the Hcrt-1 subtype), the dysfunctional Hcrt-2 receptors may result in abnormal activity in Hcrt cells, thereby affecting postsynaptic cells with both receptors types. The effectiveness of anti-cataplectic therapeutic agents is strongly correlated with the extent to which they act as noradrenergic agonists (39), suggesting that these drugs are compensating for the lack of Hcrt drive to the locus ceruleus. The activity of locus ceruleus and reticulospinal cells projecting to motoneurons excited by Hcrt is tightly linked to motor activity (23, 47, 49, 50). These cells may mediate aspects of the Hcrt-motor relations reported here. Hcrt-containing cells also project directly to the spinal cord and may thereby directly affect motoneuron activity (60).
Levitt and Teitelbaum (28) reported that lesion of the lateral hypothalamus, which contains a large portion of the Hcrt cell population, produces akinesia. They hypothesized that this lack of motor activation was the underlying cause of the lack of eating (aphagia) that resulted from the lesion. Valenstein and colleagues (35, 58, 59) showed in a series of studies that stimulation of the lateral hypothalamus can produce feeding. However, they found that this effect was best understood as a generalized motor or motivational activation, because unlike the effects of food deprivation, the expressed behavior depended on the consummatory objects placed near the animal. For example, if a wooden block was placed in the cage, it was gnawed on during stimulation; if water was placed in the cage, it was drunk; and if a female was present during stimulation of a male rat, the male attempted copulation. In the absence of consummatory objects, stimulation produced grooming and locomotion. In the context of our current results, we suggest that Hcrt release elicited by electrical stimulation of the hypothalamus or by application of Hcrt to projection sites by intracerebroventricular administration produces a motor activation that can lead to feeding (44), drinking (26), grooming (17), or other consummatory responses.
Examination of Hcrt gene expression in obese mice produced an apparently paradoxical result. Both NPY and Hcrt have been hypothesized to increase feeding. However, whereas the expression of the gene for NPY, a peptide that potently increases feeding, was increased in these overeating animals, Hcrt gene expression was found to be significantly decreased (57). Cai et al. (5) found a similar downregulation of Hcrt in Zucker fatty and Zucker diabetic fatty (ZDF) rats. However, they found that nonobese ZDF diabetic rats had normal Hcrt gene expression. When treated with Rosiglitazone, which induced weight gain, the ZDF diabetic rats showed a significant downregulation of Hcrt gene expression. The motor relations we observed can explain these findings. If motor activity and Hcrt release were reduced in the animals that became obese, one would expect downregulation of the gene linked to the synthesis of the peptide.
The hypothesis that motor activity underlies previously described Hcrt relations to weight could be tested by carefully monitoring movement. However, most studies of Hcrt and feeding have not monitored movement or electromyograms. In the current study, we find no significant change in motor activity during our food-deprivation procedure and no accompanying change in Hcrt level, in clear contrast to the substantial changes in Hcrt level in the same dogs with relatively short periods of activity.
It would be desirable to monitor the effects on motor activity of other manipulations that have been found to affect the Hcrt system. For example, insulin treatment (14, 37), insulin secretion (40), fasting in rodents (44, 36), and gastric acid secretion (54) have been shown to be correlated with Hcrt levels. Careful monitoring and control of various parameters and correlates of motor activity during these observations are necessary to separate the movement correlates of Hcrt synthesis and release and other putative regulatory or metabolic roles.
Consistent with the relations between Hcrt release and motor activity that we see here are prior reports showing locomotion and grooming after intracerebroventricular (15, 17) and intravenous (21) injection of Hcrt. The increase in metabolic rate (29), peripheral norepinephrine levels, and heart rate seen after Hcrt injection (46) are also consistent with an underlying relation to motor activity. The observed circadian rhythms of Hcrt release (12, 52), maximal at the times of maximal motor activity, may also be a consequence of motor activity rather than circadian time. Recent fos expression studies found increased labeling of Hcrt cells correlated with a higher percentage of wake time (10), findings that can be explained by the link between Hcrt release and motor activity.
Human narcoleptics have an >85% loss of Hcrt cells (56). If Hcrt were tightly linked to food intake, one would hypothesize that narcoleptics would be underweight. On the other hand, if the major link were to motor activity, one would hypothesize reduced motor activity (48). A recent study demonstrated that narcoleptics were not underweight but rather had a significantly elevated body mass index (45) despite reduced food intake (27). Reduced motor activity leading to reduced caloric expenditure is consistent with these findings. Similarly, although “knockout” mice that do not produce the peptide reduce their food intake, they do not have reduced weight (61). A study of mice in which the Hcrt neurons are ablated postnatally by the insertion of an ataxin-3 transgene found that these mice gained weight despite reduced food intake (16).
Reduced motor activity may be linked to the major symptom of narcolepsy, excessive daytime sleepiness. Because of the arousing effect of exercise (34, 41), the impairment of a major motor-activating system in narcoleptics can be seen, at a behavioral level, as linked to periods of reduced mobility and associated loss of arousal.
Motor activity is normally linked to arousal, autonomic, and metabolic processes. Anatomically localized Hcrt release patterns may not parallel levels detected in the CSF. Therefore, the motor link emphasized here certainly does not exclude direct functional relations between Hcrt and these other processes. The Hcrt system is likely to have a role in integrating these physiological and behavioral processes through its inputs and anatomic projections.
Neuronal recording studies show that the majority of neurons in the perifornical regions, in which Hcrt neurons are concentrated, fire in bursts during motor activity (1). The neurotransmitter phenotype of these cells was not positively determined. We and others found that systemic, intracerebroventricular, and intraparenchymal injection of Hcrt increases motor activity (15, 17, 21, 23). Our current work shows a greater than 50% increase in overall brain Hcrt levels with 2 h of moderate exercise. These data indicate a close correlation of Hcrt level with motor activity. This pattern of change suggests that Hcrt is not involved in a homeostatic regulation of motor activity such that high levels of motor activity would inhibit Hcrt release whereas low levels of activity would disinhibit release. Rather, Hcrt release appears to be linked to increased movement, whether movement is elicited by Hcrt administration or by exercise. This is the pattern shown by reticulomotor and pyramidal cells (11, 49, 50). The hypothesis that Hcrt activity is linked to motor activity is consistent with the massive projection of Hcrt cells to monoaminergic cells that, in turn, project strongly to motoneurons and facilitate motor activity. The precise parameters and correlates of movements to which Hcrt release is most closely linked remain to be determined.
Finally, our demonstration that brain CSF levels are a function of prior behavior needs to be taken into account in evaluating the significance of Hcrt levels in humans and animals. Clearly, CSF Hcrt levels are not solely a “trait” variable, invariant in each individual or solely a function of circadian time. Rather, they are dependent on prior behavior. Similarly, changes in Hcrt level across development could be a consequence (or cause) of changes in activity levels rather than simply be age dependent. These variables need to be separated experimentally with careful monitoring of motor activity along with other investigated variables.
Acknowledgments
We thank M. Patton, K. Alderman, and M. Nguyen for technical assistance.
This study was supported by NS-14610, MH-64109, and the Veterans Administration.
REFERENCES
- 1.Alam MN, Gong H, Alam T, Jaganath R, McGinty D, and Szymusiak R. Sleep-waking discharge patterns of neurons recorded in the rat perifornical lateral hypothalamic area. J Physiol 538: 619–631, 2002. [DOI] [PMC free article] [PubMed] [Google Scholar]
- 2.Aldrich MS. Diagnostic aspects of narcolepsy. Neurology 50, Suppl 1: S2–S7, 1998. [DOI] [PubMed] [Google Scholar]
- 3.American Physiological Society. Guiding principles for research involving animals and human beings. Am J Physiol Regul Integr Comp Physiol 283: R281–R283, 2002. [DOI] [PubMed] [Google Scholar]
- 4.Bourgin P, Huitron-Resendiz S, Spier AD, Fabre V, Morte B, Criado JR, Sutcliffe JG, Henriksen SJ, and De Lecea L. Hypocretin-1 modulates rapid eye movement sleep through activation of locus coeruleus neurons. J Neurosci 20: 7760–7765, 2000. [DOI] [PMC free article] [PubMed] [Google Scholar]
- 5.Cai XJ, Lister CA, Buckingham RE, Pickavance L, Wilding J, Arch JR, Wilson S, and Williams G. Down-regulation of orexin gene expression by severe obesity in the rats: studies in zucker fatty and zucker diabetic fatty rats and effects of rosiglitazone. Mol Brain Res 77: 131–137, 2000. [DOI] [PubMed] [Google Scholar]
- 6.Chemelli RM, Willie JT, Sinton C, Elmquist J, Scammell T, Lee C, Richardson J, Williams S, Xiong Y, Kisanuki Y, Fitch T, Nakazato M, Hammer R, Saper C, and Yanagisawa M. Narcolepsy in orexin knockout mice: molecular genetics of sleep regulation. Cell 98: 437–451, 1999. [DOI] [PubMed] [Google Scholar]
- 7.De Lecea L, Kilduff T, Peyron C, Gao XB, Foye PE, Danielson PE, Fukahara C, Battenberg ELF, Gautvik VT, Barlett FS, Frankel WN, van den Pol AN, Bloom F, Gautvik KM, and Sutcliffe JG. The hypocretins: hypothalamus-specific peptides with neuroexcitatory activity. Proc Natl Acad Sci USA 95: 322–327, 1998. [DOI] [PMC free article] [PubMed] [Google Scholar]
- 8.Dube MG, Kalra SP, and Kalra PS. Food intake elicited by central administration of orexins/hypocretins: identification of hypothalamic sites of action. Brain Res 842: 473–477, 1999. [DOI] [PubMed] [Google Scholar]
- 9.Edwards CM, Abusnana S, Sunter D, Murphy KG, Ghatei MA, and Bloom SR. The effect of the orexins on food intake: comparison with neuropeptide Y, melanin-concentrating hormone and galanin. J Endocrinol 160: R7–R12, 1999. [DOI] [PubMed] [Google Scholar]
- 10.Estabrooke IV, McCarthy MT, Ko E, Chou TC, Chemelli RM, Yanagisawa M, Saper CB, and Scammell TE. Fos expression in orexin neurons varies with behavioral state. J Neurosci 21: 1656–1662, 2001. [DOI] [PMC free article] [PubMed] [Google Scholar]
- 11.Evarts EV. Temporal patterns of discharge of pyramidal tract neurons during sleep and waking in the monkey. J Neurophysiol 27: 152–171, 1964. [DOI] [PubMed] [Google Scholar]
- 12.Fujiki N, Yoshida Y, Ripley B, Honda K, Mignot E, and Nishino S. Changes in CSF hypocretin-1 (orexin A) levels in rats across 24 hours and in response to food deprivation. Neuroreport 12: 993–997, 2001. [DOI] [PubMed] [Google Scholar]
- 13.Gerashchenko D, Kohls MD, Greco M, Waleh NS, Salin-Pascual R, Kilduff TS, Lappi DA, and Shiromani PJ. Hypocretin-2-saporin lesions of the lateral hypothalamus produce narcoleptic-like sleep behavior in the rat. J Neurosci 21: 7273–7283, 2001. [DOI] [PMC free article] [PubMed] [Google Scholar]
- 14.Griffond B, Risold PY, Jacquemard C, Colard C, and Fellmann D. Insulin-induced hypoglycemia increases preprohypocretin (orexin) mRNA in the rat lateral hypothalamic area. Neurosci Lett 262: 77–80, 1999. [DOI] [PubMed] [Google Scholar]
- 15.Hagan JJ, Leslie RA, Patel S, Evans ML, Wattam TA, Holmes S, Benham CD, Taylor SG, Routledge C, Hemmati P, Munton RP, Ashmeade TE, Shah AS, Hatcher JP, Hatcher PD, Jones DN, Smith MI, Piper DC, Hunter AJ, Porter RA, and Upton N. Orexin A activates locus coeruleus cell firing and increases arousal in the rat. Proc Natl Acad Sci USA 96: 10911–10916, 1999. [DOI] [PMC free article] [PubMed] [Google Scholar]
- 16.Hara J, Beuckmann CT, Nambu T, Willie JT, Chemelli RM, Sinton CM, Sugiyama F, Yagami K, Goto K, Yanagisawa M, and Sakurai T. Genetic ablation of orexin neurons in mice results in narcolepsy, hypophagia, and obesity. Neuron 30: 345–354, 2001. [DOI] [PubMed] [Google Scholar]
- 17.Ida T, Nakahara K, Katayama T, Murakami N, and Nakazato M. Effect of lateral cerebroventricular injection of the appetite-stimulating neuropeptide, orexin and neuropeptide Y, on the various behavioral activities of rats. Brain Res 821: 526–529, 1999. [DOI] [PubMed] [Google Scholar]
- 18.Itoh T, Murai S, Nagahama H, Miyate H, Abe E, Fujiwara H, and Saito Y. Effects of 24-hr fasting on methamphetamine- and apomorphine-induced locomotor activities, and on monoamine metabolism in mouse corpus striatum and nucleus accumbens. Pharmacol Biochem Behav 35: 391–396, 1990. [DOI] [PubMed] [Google Scholar]
- 19.Ivanov A and Aston-Jones G. Hypocretin/orexin depolarizes and decreases potassium conductance in locus coeruleus neurons. Neuroreport 11: 1755–1758, 2000. [DOI] [PubMed] [Google Scholar]
- 20.John J, Wu MF, Maidment N, and Siegel JM. Developmental changes in hypocretin-1 (orexin A) level in canine narcolepsy. Abstract presented in the Society for Neuroscience 31st Annual Meeting, San Diego, CA, Nov. 11, 2001. [Google Scholar]
- 21.John J, Wu MF, and Siegel JM. Systemic administration of hypocretin-1 reduces cataplexy and normalizes sleep and waking durations in narcoleptic dogs (Online). Sleep Res 3: 23–28, 2000. [http://www.sro.org/2000/John/23/]. [PMC free article] [PubMed] [Google Scholar]
- 22.Kastin AJ and Akerstrom V. Orexin A but not orexin B rapidly enters brain from blood by simple diffusion. J Pharmacol Exp Ther 289: 219–223, 1999. [PubMed] [Google Scholar]
- 23.Kiyashchenko LI, Mileykovskiy BY, Lai YY, and Siegel JM. Increased and decreased muscle tone with orexin (hypocretin) microinjections in the locus coeruleus and pontine inhibitory area. J Neurophysiol 85: 2008–2016, 2001. [DOI] [PMC free article] [PubMed] [Google Scholar]
- 24.Kiyashchenko LI, Mileykovskiy BY, Maidment N, Lam HA, Wu MF, John J, Peever J, and Siegel JM. Release of hypocretin (orexin) in waking and sleep states. J Neurosci 22: 5282–5286, 2002. [DOI] [PMC free article] [PubMed] [Google Scholar]
- 25.Kotz CM, Teske JA, Levine JA, and Wang CF. Feeding and activity induced by orexin A in the lateral hypothalamus in rats. Regul Pept 104: 27–32, 2002. [DOI] [PubMed] [Google Scholar]
- 26.Kunii K, Yamanaka A, Nambu T, Matsuzaki I, Goto K, and Sakurai T. Orexins/hypocretins regulate drinking behaviour. Brain Res 842: 256–261, 1999. [DOI] [PubMed] [Google Scholar]
- 27.Lammers GJ, Pijl H, Iestra J, Langius JA, Buunk G, and Meinders AE. Spontaneous food choice in narcolepsy. Sleep 19: 75–76, 1996. [DOI] [PubMed] [Google Scholar]
- 28.Levitt DR and Teitelbaum P. Somnolence, akinesia, and sensory activation of motivated behavior in the lateral hypothalamic syndrome. Proc Natl Acad Sci USA 72: 2819–2823, 1975. [DOI] [PMC free article] [PubMed] [Google Scholar]
- 29.Lubkin M and Stricker-Krongrad A. Independent feeding and metabolic actions of orexins in mice. Biochem Biophys Res Commun 253: 241–245, 1998. [DOI] [PubMed] [Google Scholar]
- 30.Lucas EA, Foutz AS, Dement WC, and Mitler MM. Sleep cycle organization in narcoleptic and normal dogs. Physiol Behav 23: 737–743, 1979. [DOI] [PubMed] [Google Scholar]
- 31.Mabry PA and Campbell BA. Food-deprivation-induced behavioral arousal: mediation by hypothalamus and amygdala. J Comp Physiol Psychol 89: 19–38, 1975. [DOI] [PubMed] [Google Scholar]
- 32.Maidment NT and Evans CJ. Measurement of extracellular neuropeptides in the brain: microdialysis linked to solid phase radioimmunossays with subfemptomole limits of detection. In: Microdialysis in the Neurosciences, edited by Robinson TE and Justice JB. New York: Elsevier Science, 1991, p. 275–303. [Google Scholar]
- 33.Mangels RA, Jetton AE, Powers JB, and Wade GN. Food deprivation and the facilitatory effects of estrogen in female hamsters: the LH surge and locomotor activity. Physiol Behav 60: 837–843, 1996. [DOI] [PubMed] [Google Scholar]
- 34.Millea PJ and Holloway RL. Treating fibromyalgia. Am Fam Physician 62: 1575–1587, 2000. [PubMed] [Google Scholar]
- 35.Mittleman G and Valenstein ES. Ingestive behavior evoked by hypothalamic stimulation and schedule-induced polydipsia are related. Science 224: 415–417, 1984. [DOI] [PubMed] [Google Scholar]
- 36.Mondal MS, Nakazato M, Date Y, Murakami N, Hanada R, Sakata T, and Matsukura S. Characterization of orexin-A and orexin-B in the microdissected rat brain nuclei and their contents in two obese rat models. Neurosci Lett 273: 45–48, 1999. [DOI] [PubMed] [Google Scholar]
- 37.Moriguchi T, Sakurai T, Nambu T, Yanagisawa M, and Goto K. Neurons containing orexin in the lateral hypothalamic area of the adult rat brain are activated by insulin-induced acute hypoglycemia. Neurosci Lett 264: 101–104, 1999. [DOI] [PubMed] [Google Scholar]
- 38.National Research Council. Guide for the care and use of laboratory animals. Washington, DC: National Academy, 1996. [Google Scholar]
- 39.Nishino S, Arrigoni J, Shelton J, Dement WC, and Mignot E. Desmethyl metabolites of serotonergic uptake inhibitors are more potent for suppressing canine cataplexy than their parent compounds. Sleep 16: 706–712, 1993. [DOI] [PubMed] [Google Scholar]
- 40.Nowak KW, Mackowiak P, Switonska MM, Fabis M, and Malendowicz LK. Acute orexin effects on insulin secretion in the rat: in vivo and in vitro studies. Life Sci 66: 449–454, 2000. [DOI] [PubMed] [Google Scholar]
- 41.Offenbacher M and Stucki G. Physical therapy in the treatment of fibromyalgia. Scand J Rheumatol Suppl 113: 78–85, 2000. [DOI] [PubMed] [Google Scholar]
- 42.Peyron C, Faraco J, Rogers W, Ripley B, Overeem S, Charnay Y, Nevsimalova S, Aldrich M, Reynolds D, Albin R, Li R, Hungs M, Pedrazzoli M, Padigaru M, Kucherlapati M, Fan J, Maki R, Lammers GJ, Bouras C, Kucherlapati R, Nishino S, and Mignot E. A mutation in a case of early onset narcolepsy and a generalized absence of hypocretin peptides in human narcoleptic brains. Nat Med 6: 991–997, 2000. [DOI] [PubMed] [Google Scholar]
- 43.Peyron C, Tighe DK, van den Pol AN, de Lecea L, Heller HC, Sutcliffe JG, and Kilduff TS. Neurons containing hypocretin (orexin) project to multiple neuronal systems. J Neurosci 18: 9996–10015, 1998. [DOI] [PMC free article] [PubMed] [Google Scholar]
- 44.Sakurai T, Amemiya A, Ishii M, Matsuzaki I, Chemelli RM, Tanaka H, Williams SC, Richardson JA, Kozlowski GP, Wilson S, Arch JR, Buckingham RE, Haynes AC, Carr SA, Annan RS, McNulty DE, Liu WS, Terrett JA, Elshourbagy NA, Bergsma DJ, and Yanagisawa M. Orexins and orexin receptors: a family of hypothalamic neuropeptides and G protein-coupled receptors that regulate feeding behavior. Cell 92: 573–585, 1998. [DOI] [PubMed] [Google Scholar]
- 45.Schuld A, Hebebrand J, Geller F, and Pollmacher T. Increased body-mass index in patients with narcolepsy. Lancet 355: 1274–1275, 2000. [DOI] [PubMed] [Google Scholar]
- 46.Shirasaka T, Nakazato M, Matsukura S, Takasaki M, and Kannan H. Sympathetic and cardiovascular actions of orexins in conscious rats. Am J Physiol Regul Integr Comp Physiol 277: R1780–R1785, 1999. [DOI] [PubMed] [Google Scholar]
- 47.Siegel JM. Behavioral functions of the reticular formation. Brain Res Rev 1: 69–105, 1979. [DOI] [PMC free article] [PubMed] [Google Scholar]
- 48.Siegel JM. Narcolepsy: a key role for hypocretins (orexins). Cell 98: 409–412, 1999. [DOI] [PMC free article] [PubMed] [Google Scholar]
- 49.Siegel JM and Tomaszewski KS. Behavioral organization of reticular formation: studies in the unrestrained cat. I. Cells related to axial, limb, eye, and other movements. J Neurophysiol 50: 696–716, 1983. [DOI] [PMC free article] [PubMed] [Google Scholar]
- 50.Siegel JM, Tomaszewski KS, and Wheeler RL. Behavioral organization of reticular formation: studies in the unrestrained cat. II. Cells related to facial movements. J Neurophysiol 50: 717–723, 1983. [DOI] [PMC free article] [PubMed] [Google Scholar]
- 51.Sweet DC, Levine AS, Billington CJ, and Kotz CM. Feeding response to central orexins. Brain Res 821: 535–538, 1999. [DOI] [PubMed] [Google Scholar]
- 52.Taheri S, Sunter D, Dakin C, Moyes S, Seal L, Gardiner J, Rossi M, Ghatei M, and Bloom S. Diurnal variation in orexin A immunoreactivity and prepro-orexin mRNA in the rat central nervous system. Neurosci Lett 279: 109–112, 2000. [DOI] [PubMed] [Google Scholar]
- 53.Takahashi Y, Ebihara S, Nakamura Y, and Takahashi K. A model of human sleep-related growth hormone secretion in dogs: effects of 3, 6, and 12 hours of forced wakefulness on plasma growth hormone, cortisol, and sleep stages. Endocrinology 109: 262–272, 1981. [DOI] [PubMed] [Google Scholar]
- 54.Takahashi N, Okumura T, Yamada H, and Kohgo Y. Stimulation of gastric acid secretion by centrally administered orexin-A in conscious rats. Biochem Biophys Res Commun 254: 623–627, 1999. [DOI] [PubMed] [Google Scholar]
- 55.Terao A, Peyron C, Ding J, Wurts SW, Edgar DM, Heller HC, and Kilduff TS. Prepro-hypocretin (prepro-orexin) expression is unaffected by short-term sleep deprivation in rats and mice. Sleep 23: 867–874, 2000. [PubMed] [Google Scholar]
- 56.Thannickal TC, Moore RY, Nienhuis R, Ramanathan L, Gulyani S, Aldrich M, Cornford M, and Siegel JM. Reduced number of hypocretin neurons in human narcolepsy. Neuron 27: 469–474, 2000. [DOI] [PMC free article] [PubMed] [Google Scholar]
- 57.Tritos NA, Mastaitis JW, Kokkotou E, and Maratos-Flier E. Characterization of melanin concentrating hormone and preproorexin expression in the murine hypothalamus. Brain Res 895: 160–166, 2001. [DOI] [PubMed] [Google Scholar]
- 58.Valenstein ES. Channeling of responses elicited by hypothalamic stimulation. J Psychiatr Res 8: 335–344, 1971. [DOI] [PubMed] [Google Scholar]
- 59.Valenstein ES, Cox VC, and Kakolewski JW. Reexamination of the role of the hypothalamus in motivation. Psychol Rev 77: 16–31, 1970. [DOI] [PubMed] [Google Scholar]
- 60.Van den Pol AN. Hypothalamic hypocretin (orexin): robust innervation of the spinal cord. J Neurosci 19: 3171–3182, 1999. [DOI] [PMC free article] [PubMed] [Google Scholar]
- 61.Willie JT, Chemelli RM, Sinton CM, and Yanagisawa M. To eat or sleep? Orexin in the regulation of feeding and wakefulness. Annu Rev Neurosci 24: 429–458, 2001. [DOI] [PubMed] [Google Scholar]
- 62.Wu MF, Gulyani S, Yao E, Mignot E, Phan B, and Siegel JM. Locus coeruleus neurons: cessation of activity during cataplexy. Neuroscience 91: 1389–1399, 1999. [DOI] [PMC free article] [PubMed] [Google Scholar]
- 63.Wu MF, John J, Maidment N, and Siegel JM. Hypocretin/orexin release in normal and narcoleptic dogs: comparison of the effects of food deprivation, eating, sleep deprivation and motor activity. Abstract presented in Society for Neuroscience 31st Annual Meeting, San Diego, CA, Nov. 11, 2001. [Google Scholar]
- 64.Yamanaka A, Sakurai T, Katsumoto T, Yanagisawa M, and Goto K. Chronic intracerebroventricular administration of orexin-a to rats increases food intake in daytime, but has no effect on body weight. Brain Res 849: 248–252, 1999. [DOI] [PubMed] [Google Scholar]