Abstract
Purpose
The oxygen-induced retinal neovascularization mouse model closely approximates pathological changes associated with human retinal neovascularization-associated diseases, including retinopathies. We used this model and human retinal endothelial cells (HRECs) under hypoxia to explore the relationship between taurine upregulated gene-1 (TUG1), vascular endothelial growth factor (VEGF), and miR-299-3p on retinopathy of prematurity (ROP).
Methods
An oxygen-induced retinopathy (OIR) mouse model was established; the mice were divided into a normal control group, OIR group, TUG1 control group (lentivirus control), and TUG1-knockdown group. The apoptosis of retinal cells was evaluated using a TUNEL assay. Angiogenic, apoptotic, and inflammatory factors were detected by Western blot, immunohistochemistry, and immunofluorescence analyses. HRECs were cultured under hypoxia and assessed for VEGF expression, apoptosis, tubule formation, and migration ability. The relationship between TUG1, VEGF, and miR-299-3p was detected via a dual luciferase reporter gene assay.
Results
Intravitreal injection of TUG1 lentivirus reduced the inflammatory response in the mouse retinal tissue and markedly reduced pathological changes in the retina. Overexpression of miR-299 in HRECs reduced the apoptosis rate, tube formation, and migration ability of hypoxia-treated cells, thereby inhibiting the formation of new blood vessels. The dual luciferase reporter gene assay suggested that miR-299 has binding sites for TUG1 and VEGF.
Conclusions
TUG1 reduces the expression of VEGFA by competitively adsorbing miR-299-3p and facilitates the regulation of retinal neovascularization, suggesting that it may serve as a new therapeutic target for retinal neovascular diseases.
Keywords: retinopathy of prematurity, taurine up-regulated gene-1, retinal neovascularization, oxygen-induced retinopathy, vascular endothelial growth factor
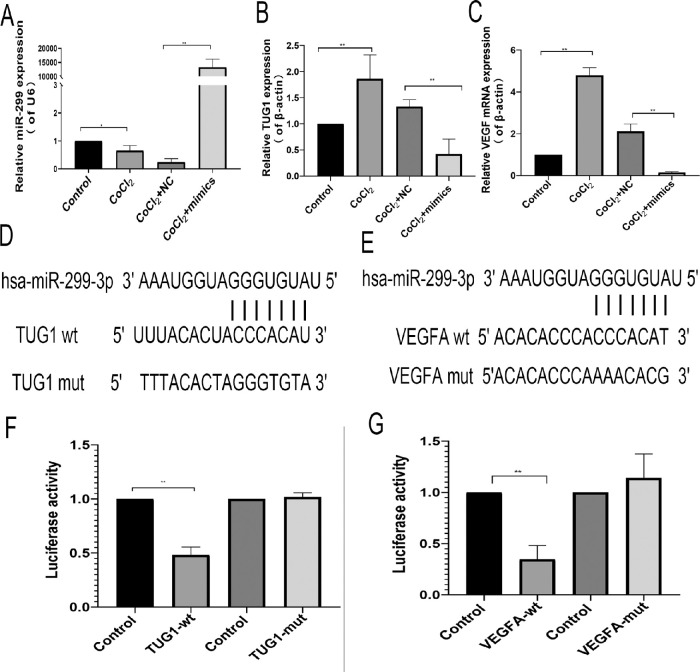
Retinopathy of prematurity (ROP) is a retinal pathological neovascularization-associated disease. The clinical treatment for ROP is similar to that for diabetic retinopathy (DR), retinal vascular occlusion, age-related macular degeneration, and other neovascularization diseases, which involves intravitreal injection of anti-vascular endothelial growth factor (VEGF) drugs.1 Although this treatment is very effective, relapse and the need for repeated intraocular injections leading to retinal damage and choroidal atrophy have been shown to negatively affect the visual development of children.2 Therefore there has been extensive research effort to discover a more suitable treatment for retinal neovascularization disease.3,4 Long non-coding RNAs (lncRNA) are now recognized to participate in a variety of biological activities and are closely associated with the occurrence and development of various diseases.5,6 The lncRNA taurine upregulated gene-1 (TUG1) was initially identified in the retina and plays a role in retinal development.7 Recent studies have shown that TUG1, which is highly conserved in humans and mice, facilitates the occurrence and development of a variety of tumors.8,9 Abnormal expression of TUG1 plays an important role in neurovascular pathological processes such as tumor angiogenesis, pathologically changed hypertensive vessels, and vascular cognitive impairment.10–12 Several studies have indicated that lncRNA TUG1 regulates the expression of various factors in endothelial cells via competitive adsorption of a variety of microRNAs (miRNAs), thereby participating in the angiogenesis and vascular remodeling of diverse endothelial cells.13,14 In addition, recent studies have shown that TUG1 is sensitive to changes in the oxygen environment, wherein ischemia and hypoxia increase TUG1 expression levels, leading to pathological changes.15–17 Based on this background, we hypothesized that TUG1 might play a role in retinal neovascularization (RNV). To test this possibility, we explored the role of TUG1 in a mouse retinal neovascularization model induced by oxygen and hypoxic-cultured human retinal endothelial cells (HRECs). See Figure 6 for bioinformatics analysis, which showed that TUG1 may interact with miR-299 and VEGF. Therefore we further analyzed the effect of reducing TUG1 expression on the regulation of mir-299-3p/VEGF. These findings can help to find a more effective clinical treatment method for ROP/RNV and provide insight into the pathogenesis.
Figure 6.
Effect of miR-299 on VEGF and TUG1 expression in human retinal endothelial cells. (A) MiR-299 overexpression. (B) Effect of miR-299 overexpression on TUG1 expression. (C) Effect of miR-299 overexpression on VEGF expression. (A–C) The values represent the mean ± SD (n = 3). **P < 0.01 control versus CoCl2; **P < 0.01 CoCl2+NC versus mimics+CoCl2. (D, E) Predicted TUG1 and VEGFA binding sites in has-miR-299-3p. (F, G) Dual luciferase reporter gene results. The values represent the mean ± SD (n = 3). **P < 0.01 control versus TUG1-wt; **P < 0.01 control versus VEGFA-wt.
Materials and Methods
Experimental Animals and Model Establishment
Healthy adult female and male C57/BL6J mice were purchased from Changsheng Company (Shenyang, China) for breeding young mice. The young mice were divided into four groups with 60 mice per group: control group, oxygen-induced retinopathy (OIR) group, OIR-C group, and OIR-T group. The mice in the control group were fed by their mothers in a normal environment. The mice in the OIR group were exposed to 75% ± 2% oxygen on day 7 after birth and returned to the normal environment 12 days after birth. The mice in the OIR-C group were established as in the OIR model and then received intravitreal injection of 1 µL of TUG1 short hairpin RNA (shRNA) control reagent + 0.5 µL of lentivirus infection reagent. The mice in the OIR-T group were treated with 1 µL TUG1 shRNA + 0.5 µL of lentivirus infection reagent. The titer of the lentivirus was 3E+8 TU/mL. The mice in the OIR-C and OIR-T groups received intravitreal injection of the lentivirus at 12 days old under sevoflurane inhalation anesthesia. The TUG1 shRNA sequences were as follows: 5′-TTGAAGGAAA-GCTGTGTGGAA-3′, 5′-CTGCCTGTTCTTCTAGCTTAA-3′, and 5′-AGGGACTTGCAACCTGGTTAT-3′ (Genechem, Shanghai, China). The TUG1 Control shRNA sequence was as follows: 5′-TTCTCCGAACGTGTCACGT-3′. Specimens for follow-up experiments were prepared by selecting four groups of mice on the fourteenth day after birth for polymerase chain reaction (PCR) and the seventeenth day after birth for other experiments. This study was approved by the Medical Ethics Committee of Shengjing Hospital of China Medical University (approval No. 2018PS239K).18
Cell Culture and Transfection
The HREC line was obtained from ScienCell Research Laboratory (Carlsbad, CA, USA). The 293T cell line was obtained from Shanghai Cell Bank of the Chinese Academy of Sciences, which was identified via short tandem repeats. Cells were cultured in Prmi1640 medium (Hyclone Laboratories, Logan, UT, USA) and 10% fetal bovine serum (Biological Industries, Kibbutz Beit-Haemek, Israel) at 37°C and 5% CO2. All cells were subcultured two or three times after resuscitation and then used in subsequent experiments. HRECs were divided into the control group, cobalt chloride (CoCl2) group, CoCl2 control group, and mimics group. Cells in the experimental groups were treated with 200 µmol/L CoCl2 (Sigma Aldrich, St. Louis, MO, USA) for 24 hours to simulate hypoxia. The cells in the mimic group were transfected with Has-miR-299-3p mimics (GenePharma, Suzhou, China; 5′-UAUGUGGGAUGGUAAACCGCUUGCGGUUUACCCACAUAUU-3′) using Lipo3000 reagent (Invitrogen, Carlsbad, CA, USA) according to the manufacturer's instructions.
Reverse Transcription (RT)-PCR
Total RNA was extracted from the retina tissues of 14-day-old mice or from the cells of the aforementioned treatment groups using RNAiso Plus (Takara Biotechnology Co., Kyoto, Japan). PrimeScript RT reagent Kit with gDNA Eraser (Takara, Japan) was used for reverse transcription and TB Green Premix Ex Taq II (Takara Biotechnology Co.) was for used for quantitative PCR under the following thermal cycling program: pre-degradation at 95°C for 30 seconds, followed by 40 cycles of 95°C for 3 seconds and 60°C for 30 seconds. The 2△△CT method was used to calculate the relative expression levels of TUG1, VEGF, and miR-299. The mRNA expression levels of the target genes were normalized to the β-actin mRNA expression. The specific primer sequences used in RT-PCR are provided in the Table.
Table.
Primer Sequences Used in Quantitative Polymerase Chain Reaction
| Gene | Species | Sequence (5′–3′) |
|---|---|---|
| TUG1 | Human | F: GCAAGCACTACCACCAGCACTG |
| R: CACTCAGCAATCAGGAGGCACA | ||
| VEGF | Human | F: ATCGAGTACATCTTCAAGCCAT |
| R: GTGAGGTTTGATCCGCATAATC | ||
| miR-299 | Human | CGTATGTGGGATGGTAAACCGCTT |
| β-actin | Human | F: CCTGGCACCCAGCACAAT |
| R: GGGCCGGACTCGTCATAC | ||
| Tug1 | Mouse | F: GAGACACGACTCACCAAGCACTG |
| R: CAGAAGGAAGGTCATTGGCAGGTC | ||
| miR-299 | Mouse | CTATGTGGGACGGTAAACCGCTT |
| β-actin | Mouse | F: GTGCTATGTTGCTCTAGACTTCG |
| R: ATGCCACAGGATTCCATACC | ||
| U6 | F: GGAACGATACAGAGAAGATTAGC | |
| R: TGCAACGCTTCACGAATTTGCG |
Evaluation of Retinal Pathological Changes
The eyeballs of 17-day-old mice were removed after isoflurane inhalation anesthesia and fixed in 4% paraformaldehyde for four hours. The anterior segment and vitreous were removed under a microscope, and the retinal tissue was completely separated to ensure a retinal morphology. The retinal tissue was dissolved in Isolectin IB4 Alexa Fluor dye conjugate (Invitrogen) dissolved in phosphate-buffered saline solution (PBS) solution containing 1% TritonX-100 (Solarbio Life Science, Beijing, China) overnight at 4°C after washing with PBS. The retina was cut into four sections under the microscope and placed on a glass slide. After sealing with anti-quenching agent, the samples were observed under a fluorescent microscope (Eclipse Ni; Nikon Inc., Melville, NY, USA), and images were acquired. ImageJ (National Institutes of Health, Bethesda, MD, USA) was used to calculate the area of the retinal neovascularization cluster and avascular areas. The 10 eyeballs were fixed and embedded in paraffin, and 4-µm-thick sections were obtained. After dewaxing, the paraffin sections were stained with hematoxylin eosin (HE) and then dehydrated and sealed with neutral gum. A double-blind method was used to count the number of vascular nuclei breaking through the inner limiting membrane.
Western Blotting
Total retina protein was extracted using RIPA lysis buffer and phenylmethylsulphonyl fluoride (Solarbio Life Science). The expression levels of VEGF, hypoxia-inducible factor-1 alpha, interleukin (IL)-1 β, IL-6, tumor necrosis factor (TNF)-α, BAX, Bcl-2, and caspase-3 in the retina were detected via Western blotting. First, the samples were subjected to gel electrophoresis (80 V) and then transferred onto a polyvinylidene fluoride membrane. After blocking with 5% bovine serum albumin, samples were incubated with corresponding primary antibodies (1:1000; ImmunoWay Biotechnology Company, Plano, TX, USA) at 4°C overnight. The samples were subsequently incubated with horseradish peroxidase-labeled goat anti-rabbit IgG(H+L) secondary antibody (1:2000; ImmunoWay) at 37°C for one hour after being washed three times in PBS. The Western blot results were visualized with GE680 gel imager (GE-Healthcare, Chicago, IL, USA).
Immunohistochemistry and Immunofluorescence
Immunohistochemistry and immunofluorescence were performed with the Streptavidin-Biotin Complex (SABC) kit (Boster Bio, Pleasanton, CA, USA). Following dewaxing, paraffin sections were placed in heated 3% citric acid and subsequently incubated with 3% H2O2 for 10 min to remove endogenous oxidases. The sections were then washed three times with PBS and blocked with 5% goat serum for 30 min at 37°C. After rewashing, the sections were incubated with a rabbit IgG primary antibody (IL-1β, IL-6, TNF-α, VEGF; 1:200; ImmunoWay) overnight at 4°C. Subsequently, the samples were rewashed, treated with biotinylated goat anti-rabbit IgG drop-wise (1:200), and incubated for 30 minutes at 37°C. SABC-POD or SABC-FITC reagent was then added dropwise to the samples, and the preparation was incubated for 30 minutes at 37°C. The primary antibody was replaced with PBS for the negative controls. The sections intended for immunohistochemistry were stained with DAB for 70 seconds and counterstained with hematoxylin, mounted with neutral gum, and photographed under the microscope, whereas sections intended for immunofluorescence were photographed after mounting with anti-quenching mounting tablets. Immunohistochemical-positive cells were described by integral optical density using Image-pro plus 6.0.
Terminal Deoxynucleotide Transferase dUDP Nick-end Labeling (TUNEL) Staining
The TUNEL BrightRed Apoptosis Detection Kit (Vazyme Biotech Co., Ltd, Nanjing, China) was used to measure apoptosis in the retina. The paraffin sections were conventionally deparaffinized and digested with pepsin K for 20 minutes. After washing, the preparation was treated with 1 × equilibration buffer drop-wise, equilibrated at room temperature for 20 minutes, washed with PBS, and treated with 50 µL of TdT incubation buffer. The preparation was then incubated for 60 minutes at 37°C, washed, counterstained with DAPI, and mounted on a water-soluble anti-fluorescence attenuation mounting plate (Solarbio Life Science, Beijing, China) to obtain images. The green fluorescence was observed under a fluorescence microscope at 520 nm, the red fluorescence was observed at 620 nm, and the blue fluorescence of DAPI was observed at 460 nm.
Tube Formation
For the tube-formation assay, 50 µL Matrigel (Corning Inc., Corning, NY, USA) was applied to a precooled (−20°) 96-well culture plate, and then the plate was incubated in a cell culture incubator for 30 minutes at 37°C. Cell suspensions of the different treatment groups were added to the microplate and cultured for six hours, after which images and counts were obtained.
Wound-Healing Assay
HRECs were inoculated in a 12-well plate at a density of 5 × 10⁵ cells/mL, cultured overnight, and subjected to different treatments for 24 hours. Cultures that grew to more than 90% confluency were scratched (0-hour group) and cultured for a further 24 hours (24-hour group). The area of three fields randomly selected from the cell-free part of the scratch was measured under an optical microscope using magnification ×4, and the 24-hour cell migration rate was calculated as follows: Cell migration rate = (area of the initial scratch − area of the cell-free part during the test)/area of the initial scratch.
Flow Cytometry
HRECs were subjected to different treatments for 24 hours. The cells were then digested with trypsin-free ethylenediaminetetraacetic acid, spun in a centrifuge to remove the supernatant, washed twice with PBS, stained with Annexin-PE/7AAD (Vazyme Biotec Co. Ltd), and measured via flow cytometry (Millipore, Burlington, MA, USA) to obtain the proportion of apoptotic cells in each group. The experimental results of flow cytometry were analyzed by guava Incyte software.
Dual Luciferase Reporter Gene Assay
The sites in hsa-miR-299-3p that facilitate binding with TUG1 and VEGF were predicted via the following bioinformatics website: https://starbase.sysu.edu.cn/ceRNA.php (For the predicted binding results, see Figure 6). An expression vector was designed and constructed, and then dual luciferase reporter genes were used to verify binding of hsa-miR-299-3p with TUG1 and VEGF, as reported previously.19 The 293T cells were seeded onto a 96-well plate (105 cells/well). When the cell confluence reached approximately 70%, the cells were transfected with the expression vector with firefly fluorescence and the control plasmid with Renilla fluorescence. Next, has-miR-299-3P mimics were added to the experimental group, whereas the negative control vector was added to the control group. After 48 hours of cotransfection, the dual luciferase detection kit (Promega Corporation, Madison, WI, USA) was used to measure fluorescence as reported previously.20
Statistical Analysis
All statistical data are expressed as the mean ± standard deviation (SD). Differences were analyzed by analysis of variance or Student's t-test using GraphPad Prism 8.0 software (GraphPad, USA). P values < 0.05 were considered statistically significant.
Results
TUG1 was Associated With miR-299 and Highly Expressed in OIR Mice
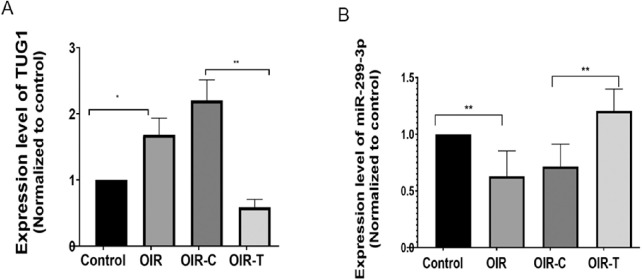
The RT-PCR results indicated that the expression level of Tug1 in the retina of the OIR group was higher than that in the Control group (P = 0.0225; Fig. 1A), and was significantly lower in the OIR-T group than that in the OIR-C group (P = 0.0007, Fig. 1A), confirming that the lentivirus carrying the shRNA effectively interfered with endogenous Tug1 expression. Concurrently, mmu-miR-299-3p expression exhibited an opposite trend to Tug1 expression, indicating that knocking down Tug1 increased the expression of mmu-miR-299-3p. (Control vs. OIR, P = 0.003; OIR-C vs. OIR-T, P = 0.02; Fig. 1B).
Figure 1.
Expression levels of Tug1 and miRNA-299-3p in the OIR mouse model with and without Tug1 knockdown. (A) Tug1 expression level (mean ± SD, n = 6). *P < 0.05 control versus OIR; **P < 0.01, OIR-C versus OIR-T (Tug1 knockdown). (B) MiR-299-3p expression level (mean ± SD; n = 8). **P < 0.01 control versus OIR; **P < 0.01, OIR-C versus OIR-T.
Knockdown of Tug1 can Reduce Pathological Retinal Alterations
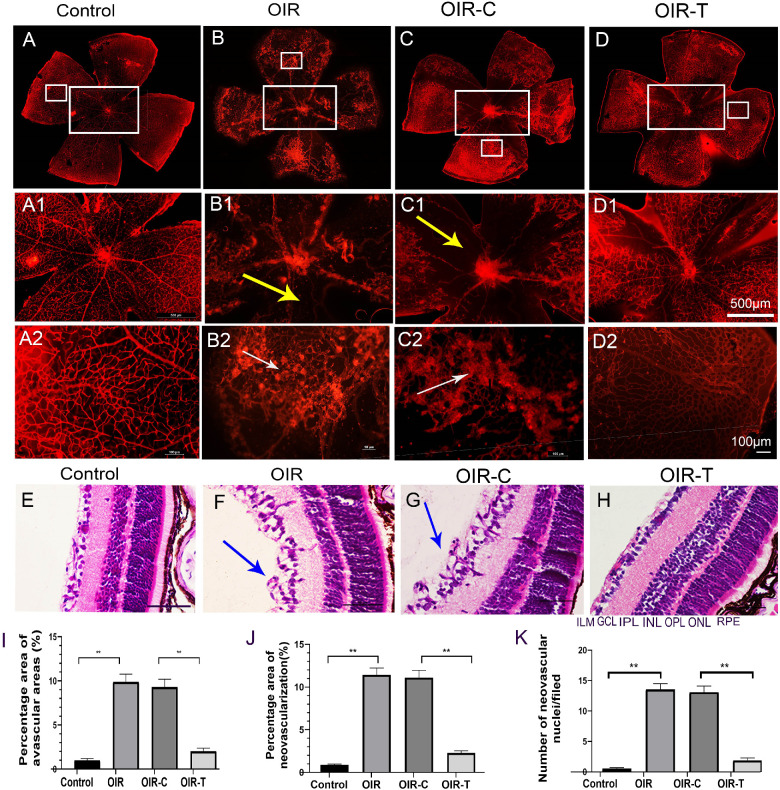
The retinal images of 17-day-old mice in each group are shown in Figures 2A to 2D. The retina of OIR mice were with widespread bleeding points and large avascular areas compared with the control group (Fig. 2B). The avascular area in the OIR group was higher than that in the Control group (P < 0.0001; Fig. 2I), and the avascular area in the OIR-T group was lower than that in the OIR-C group (P < 0.0001; Fig. 2I). Retinal neovascularization in the control group was lower than that in the OIR group (P < 0.0001; Fig. 2J), and neovascularization in the OIR-T group was lower than that in the OIR-C group (P < 0.0001; Fig. 2J).
Figure 2.
Pathological changes in the mouse retina. (A) Retinal vascular morphology of 17-day-old mice in the normal group. (B) Retinal vascular morphology of mice in the OIR group. (C) Retinal vascular morphology of mice in the OIR-C group. (D) Morphology of retinal vessels in the OIR-T group. (A1–D2) Partially enlarged view of A–D, respectively; magnification ×400. Scale bars: 10 µm (yellow arrows indicate avascular areas, and white arrows indicate neovascular clusters). (E) HE-stained image of the control group. (F) HE-stained image of the OIR group. (G) HE-stained image of the OIR-C group. (H) HE-stained image of the OIR-T group. (E–H) Magnification ×400; scale bars: 100 µm. Blue arrows indicate break-through of the retina cells in the boundary membrane. (I) Percentage of avascular areas of the retina. (J) Percentage of the area of retinal neovascularization (mean ± SD, n = 10). **P < 0.01 control versus OIR; **P < 0.01 OIR-C versus OIR-T. (K) Number of break-through nuclei in the inner limiting membrane of the retina. GCL, ganglion cell layer; ILM, inner limiting membrane; INL, inner nuclear layer; IPL, inner plexiform layer; ONL, outer nuclear layer; OPL, outer plexiform layer. Data are presented as the mean ± SD (n = 10). **P < 0.01 control versus OIR; **P < 0.01 OIR-C versus OIR-T.
HE staining demonstrated that retinal tissue cells in the OIR group were disorderly, with retinal endothelial cell nuclei breaking through the inner limiting membrane (ILM) to reach the vitreous cavity. In contrast, the retinal tissue cells in the control group were tightly arranged, whereas cells in the ILM of the retina were neatly arranged (Figs. 2E–2F). The number of endothelial cell nuclei breaking through the ILM in the OIR group was higher than that in the control group (P < 0.0001; Fig. 2K), and the number in the OIR-T group was significantly lower than that in the OIR-C group (P < 0.0001; Fig. 2K).
Knockdown of Tug1 can Reduce the Apoptosis Rate of Retinal Tissue Cells
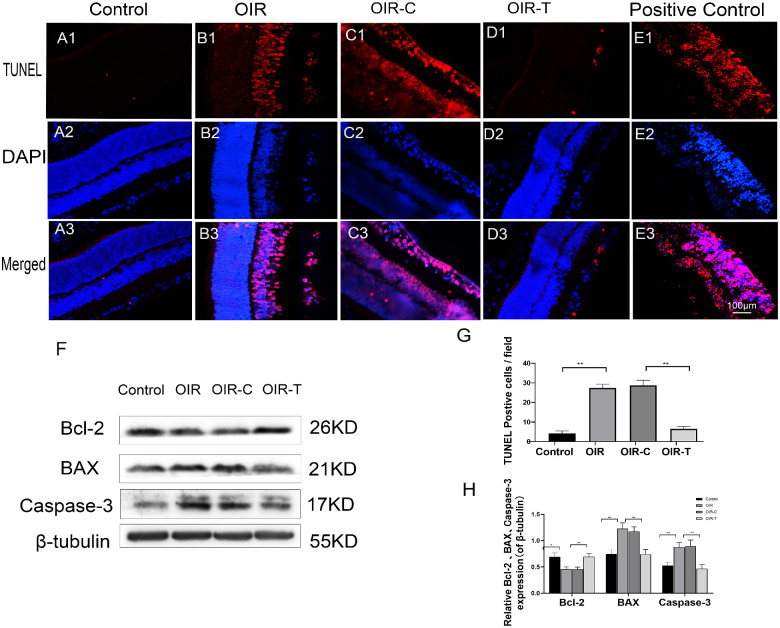
TUNEL staining indicated that the apoptosis rate in the control group was very low, with only a few cells undergoing apoptosis, whereas the apoptosis rate in the OIR group was significantly increased (P < 0.0001; Figs. 3A–E). The apoptosis-positive cells were mainly distributed in the nerve fiber layer, ganglion cell layer, and inner nuclear layer. Furthermore, the apoptosis rate in the OIR-T group was significantly decreased compared with that in the OIR-C group (P < 0.0001; Fig. 3G). Western blot results showed that the expression levels of BAX (P = 0.0033) and caspase-3 (P = 0.0067) in the retinal tissues of the OIR group mice were higher than those of the control group, whereas BCl-2 expression levels were significantly decreased in the OIR group (P = 0.0187, Figs. 3F, 3H). The expression levels of BAX (P = 0.0047) and caspase-3 (P = 0.0093) in the OIR-T group were significantly higher than those of the OIR-C group. The expression level of Bcl-2 was significantly increased in the OIR-T group compared with that of the OIR-C group (P = 0.0063; Figs. 3F, 3H)
Figure 3.
Apoptosis of the retinal tissue in 17-day-old OIR mice. (A1–E3) Purple fluorescence indicates apoptotic cells. (A1–A3) TUNEL staining in the Control group. (B1–B3) TUNEL staining in the OIR group. (C1–C3) TUNEL staining in the OIR-C group. (D1–D3) TUNEL staining in the OIR-T (with Tug1 knockdown) group. (E1–E3) TUNEL staining of positive control cells. (F) Expression of BAX, Caspase-3, and Bcl-2, as determined with Western blotting, in the retinal tissues of the control, OIR, OIR-C, and OIR-T groups. (G) Number of apoptotic cells in each group (mean ± SD, n = 6). **P < 0.01 control versus OIR; **P < 0.01 OIR-C versus OIR-T. H. Relative expression levels of Bcl-2, BAX, and Caspase-3, normalized to β-tubulin levels. (mean ± SD, n = 6). *P < 0.05, **P < 0.01 control versus OIR; *P < 0.05, **P < 0.01 OIR-C versus OIR-T.
Knockdown of Tug1-Reduced Inflammation
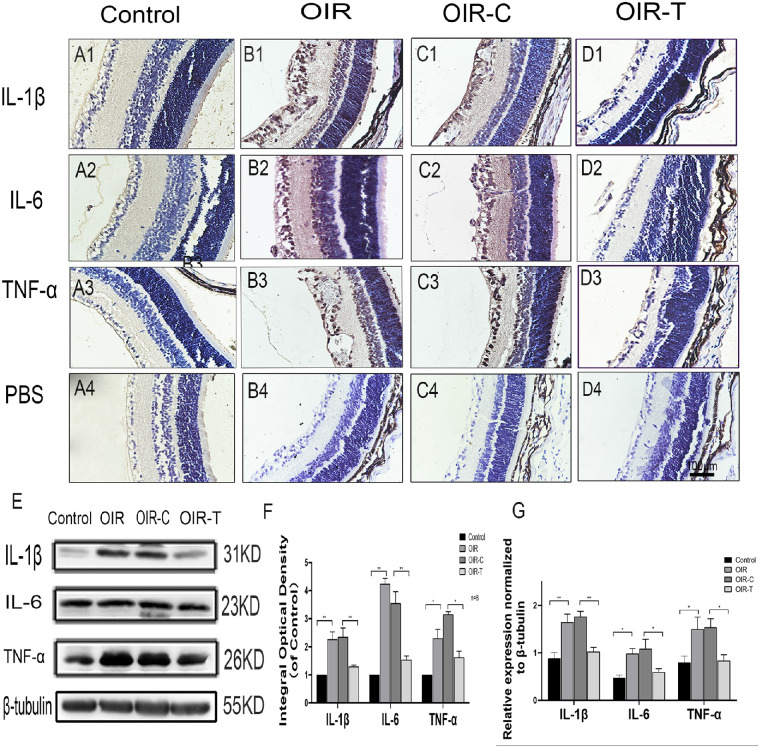
Immunohistochemistry indicated that expression position of the inflammatory factors IL-1β, IL-6, and TNF-α were ganglion cell layer, inner nuclear layer, and inner plexiform layer in the OIR group and OIR-T group. The cells breaking through the inner limiting membrane were positive. The expression levels of the inflammatory factors IL-1β, IL-6, and TNF-α in the retinas of the OIR group were significantly higher than those in the control group (P = 0.0008, <0.0001, and 0.0023, respectively; Figs. 4A1–4D4, 4F). The expression levels of the inflammatory factors IL-1β, IL-6, and TNF-α in the retinas of the OIR-T group were significantly lower than those in the OIR-C group (P = 0.0084, 0.0010, and <0.0001; Figs. 4A1–4D4, 4F). Western blot analysis showed that the expression levels of IL-1β, IL-6, and TNF-α in the OIR group were significantly increased (P = 0.0033, 0.0011, and 0.0277, respectively), whereas those in the sh-TUG1 group were significantly decreased (P = 0.0002, 0.0395, and 0.0070, respectively; Fig. 4E, 4G). This suggested that knocking down Tug1 expression alleviated the inflammatory response in the retina.
Figure 4.
Expression of the inflammatory factors IL-1β, IL-6, and TNF-α in retinal tissues of each group. (A1–C3) Immunohistochemical map of the inflammatory factors IL-1β, IL-6, and TNF-α in the retinal tissues of each group. (A4–D4) Immunohistochemical map of the PBS control. (E) Western blot results of IL-1β, IL-6, and TNF-α expression in control, OIR, OIR-C, and OIR-T groups. (F) Integral optical density, normalized to the control value (mean ± SD, n = 6). *P < 0.05, **P < 0.01, control versus OIR; *P < 0.05 **P < 0.01 TUG1 control versus sh-TUG1. (G) Relative expression of IL-1β, IL-6, and TNF-α, as determined with Western blotting. The values represent the mean ± SD (n = 6). *P < 0.05, **P < 0.01 control versus OIR; **P < 0.01 TUG1 control versus sh-TUG1.
Knockdown of Tug1 Reduced VEGF Expression
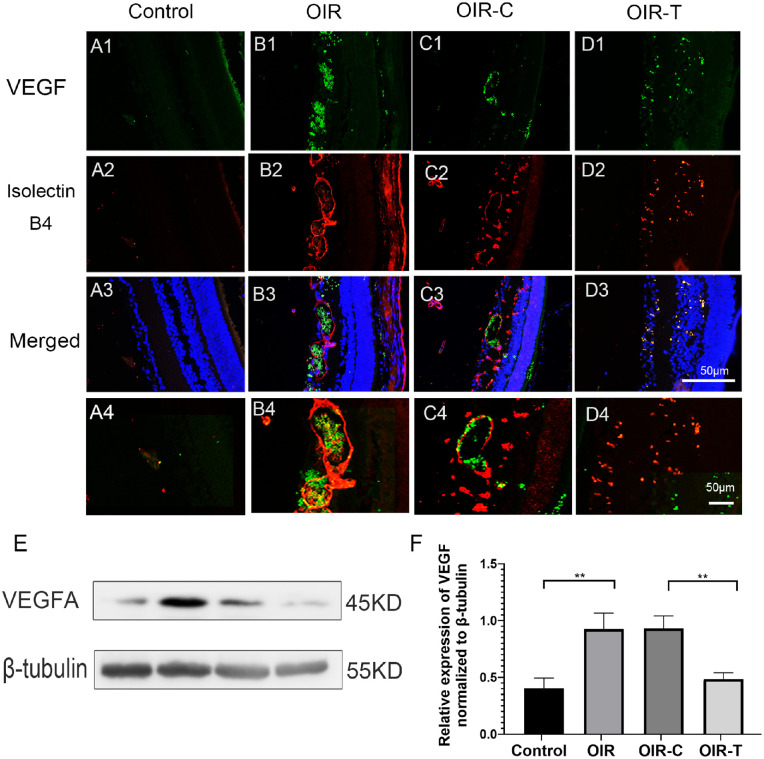
We labeled the blood vessels of retinal tissue with Isolectin IB4 and observed the expression of VEGF in retinal tissue of different groups of mice by immunofluorescence. Immunofluorescence experiments showed that VEGF expression in the OIR and OIR-C groups was significantly higher than that in the Control and OIR-T groups (Figs. 5A1–5D4).
Figure 5.
Expression of VEGF in the retinal tissues of each group. (A1–D3) Micrographs depicting immunohistochemistry results of VEGF in the retinal tissues of each group. Green fluorescence indicates VEGF, and the red fluorescence indicates IB4. (A4–D4) Locally enlarged image of A3–D3 (E) Western blotting results for VEGF. (F) Relative expression of VEGF, as determined with Western blotting. The values represent the mean ± SD (n = 6). Control versus OIR *P < 0.05, **P < 0.01; OIR-C vs OIR-T.
Western blot results suggested that the difference in VEGF expression was statistically significant (all P < 0.01; Figs. 5E, 5F). The expression level of VEGF in the control group was significantly lower than that in the OIR group (P = 0.0070), whereas the expression of VEGF in the OIR-T group was significantly lower than that in the OIR-C group (P = 0.0026).
TUG1 Regulates VEGF Expression via the Competitive Adsorption of miR-299
Under hypoxic conditions, the expression of has-miR-299-3p in HRECs decreased, thereby promoting the expression of VEGF. Overexpression with has-miR-299-3p mimics significantly reduced the expression of VEGF and TUG1 under hypoxic conditions (Figs. 6A–6C). The targeted binding relationship was further verified via dual luciferase reporter genes. Compared with that of the mutant TUG1, the has-miR-299-3p of wild-type TUG1 significantly reduced the luciferase activity (P = 0.0020). Compared with that of the mutant VEGFA, the has-miR-299-3p of wild-type VEGFA significantly reduced the luciferase activity (P = 0.0089; Figs. 6F, 6G). Overall, these results showed that TUG1 targets has-miR-299 to regulate the expression of VEGFA (Figs. 6D, 6E).
Overexpression of miR-299 Inhibited the Apoptosis and Migration of HRECs Under Hypoxia
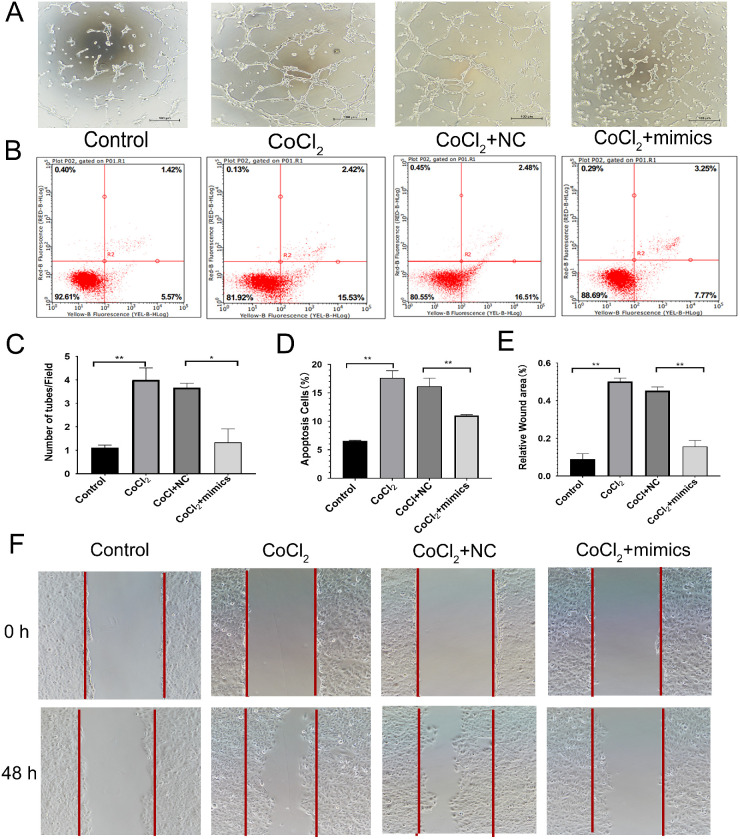
The tubule formation experiment indicated that the number of cells in the CoCl2 group was significantly higher than that in the Control group (P = 0.0052), whereas the number of tubules in the CoCl2+mimics group was significantly lower than that in the CoCl2+Control group (P = 0.0186; Figs. 7A, 7C). Flow cytometry indicated that the apoptotic rate of cells in the CoCl2+mimics group was significantly higher than that in the Control group (P < 0.0001). However, the apoptotic rate of the CoCl2+mimics group was significantly lower than that of the CoCl2+NC group (P = 0.0071; Figs. 7B, 7D). The scratch test demonstrated that the migration ability of the CoCl2 group was stronger than that in the control group (P = 0.0003), whereas the migration ability of the CoCl2+mimics group was weaker than that of the CoCl2+NC group (P = 0.0013; Figs. 7E–F).
Figure 7.
Effect of miR-299 overexpression on the function of human retinal endothelial cells. (A) Results of cell tube formation experiment. (B) Results of flow cytometry experiment. (C) Comparison of the number of tubules produced in different treatment groups. The values represent the mean ± SD (n = 3). **P < 0.01 control versus CoCl2; **P < 0.01 CoCl2+NC versus mimics+CoCl2. (D) Comparison of apoptosis rates in different treatment groups (mean ± SD, n = 3). **P < 0.01 control versus CoCl2; **P < 0.01 CoCl2+NC versus mimics+CoCl2. (E) Comparison of wound-healing area in different treatment groups. The values represent the mean ± SD (n = 3). **P < 0.01 control versus CoCl2; **P < 0.01 CoCl2+NC versus mimics+CoCl2. (F) Results of the cell scratch experiment.
Discussion
The pathophysiological process of ROP is generally considered to be related to the relative hypoxia of the retina. During the development of ROP, the expression of hypoxia-related factors increases abnormally.21,22 Studies with OIR mice have indicated that during retinal angiogenesis, hypoxia causes cells to undergo oxidative stress, leading to cell apoptosis, which affects inflammation and leads to pathological changes in the retinal blood vessels.23–26 The lncRNA TUG1 is widely expressed in normal mammalian tissues. Recent studies have indicated that TUG1 regulates endothelial cell apoptosis and autophagy,27 and TUG1 knockdown can effectively reduce cell damage. In tumor-related diseases, TUG1 promotes the proliferation and migration of tumor cells as well as the pathological formation of new blood vessels.28 In vascular cognitive impairment diseases, abnormal expression of TUG1 promotes the apoptosis of hippocampal nerve cells and aggravates oxidative stress.10,29
By knocking down Tug1 in vivo, we found that the apoptosis rate of retinal tissue cells was significantly decreased, indicating that high expression of Tug1 may promote apoptosis, and the apoptotic cells were mainly distributed in the nerve fiber layer, ganglion cell layer, and inner nuclear layer. Moreover, overexpression of miR-299 in HRECs effectively inhibited the apoptosis of endothelial cells under hypoxia. These results suggest that overexpression of miR-299 can inhibit the apoptosis of endothelial cells. TUG1 mainly exerts biological regulation by acting as an miRNA sponge, which affects the expression of its target proteins.30,31 TUG1 affects the heart by inhibiting the expression of different miRNAs, as well as by increasing the expression of its target proteins, thus leading to the occurrence and development of cerebrovascular diseases.32,33 Indeed, we found that the expression of inflammatory factors in the retinas of the OIR group increased, and the inflammatory reaction was expressed in ganglion cell layer, inner nuclear layer, and inner plexiform layer, and the cells breaking through the inner limiting membrane were positive. The inflammatory reaction was weakened after knockdown of Tug1. These findings suggest that knockdown of TUG1 can reduce the inflammatory reaction of retina, with a certain protective effect on retinal vascular disease.
Our previous studies indicated that Tug1 expression was significantly increased in mouse OIR models. We further predicted that miR-299-3p may participate in the regulation of VEGFA expression via TUG1. Indeed, OIR mice showed significantly decreased miR-299-3p expression and increased VEGF expression, and Tug1 knockdown reversed these effects. However, in the cell experiments, VEGF expression was increased to a greater extent than Tug1 under CoCl2 treatment, suggesting that the expression of VEGF may be regulated by multiple mechanisms. Therefore the detailed expression and regulation of VEGF in the context of retinopathy warrant further study. VEGF is an important target in retinal neovascular diseases and plays a vital role in angiogenesis. In turn, angiogenesis, an important mechanism associated with many physiological and pathological processes, affects the proliferation, migration, and survival of endothelial cells.34–36 In the pathology of retinal neovascularization, it is generally considered that hypoxic conditions activate hypoxia-inducible factor-1 alpha and increase VEGF expression, thereby promoting the apoptosis and migration of endothelial cells, as well as the formation of retinal neovascularization. The hypoxia of HREC cells induced by cobalt chloride is the same as this principle, and the model is more suitable for this study.37,38 This study further highlights the important roles of TUG1 and miR-299 in RNV generation in both in vivo and in vitro experiments, and further verified the relationship of miR-299 with TUG1 and VEGFA (Fig. 8).
Figure 8.
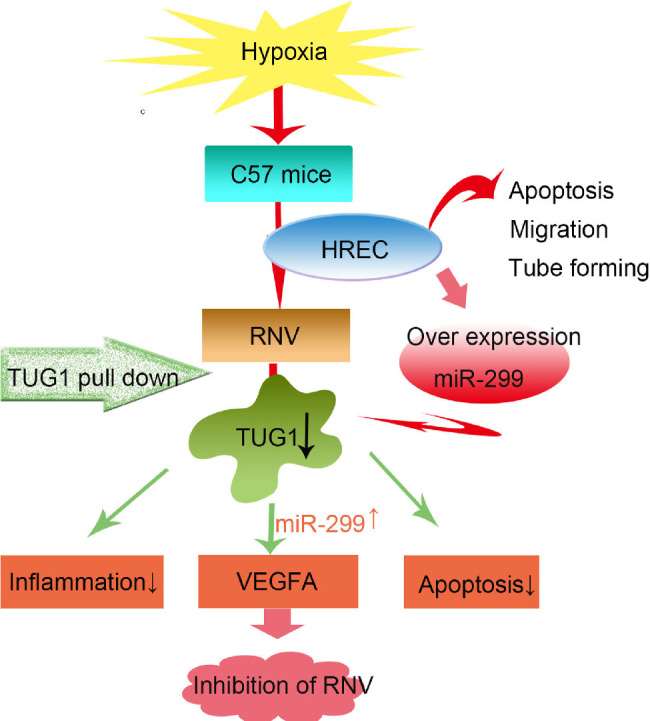
Proposed regulatory mechanism of TUG1 on retinal neovascularization (RNV). TUG1 regulates the expression of VEGFA through competitive adsorption of miR-299, in turn, ameliorating retinal neovascularization.
Currently, the most important method for treating RNV diseases involves the intravitreal injection of anti-VEGF drugs.39 Although this treatment method is effective, the drug is only active for a short time. Therefore most patients need multiple injections. The search for anti-VEGF drugs that show sustained activity is an important topic of current research. One alternative is shRNA-mediated gene therapy, which has been shown to effectively reduce the number of treatments and shorten the treatment cycle.40–44 In the current study, we suppressed VEGF expression using a single injection of shTUG1, resulting in significant reduction in pathological changes associated with retinal neovascularization in the OIR mouse model. This study therefore can provide a new concept regarding the treatment of ROP and also offers a potential treatment option for other retinal neovascular diseases. However, the safety of the drugs injected into the eye, dosage of the drugs used, and feasibility of this approach in clinical practice require further in-depth studies.
Acknowledgments
Supported by the National Natural Science Foundation of China (81600747), Foundation of Liaoning Province Education Administration (QNZR2020010), and the 345 Talent Project of Shengjing Hospital of China Medical University.
Disclosure: Y. Wang, None; X. Wang, None; Y.-X. Wang, None; Y. Ma, None; Y. Di, None
References
- 1. Filippi L, Dal Monte M.. A safety review of drugs used for the treatment of retinopathy of prematurity. Expert Opin Drug Saf. 2020; 19: 1409–1418. [DOI] [PubMed] [Google Scholar]
- 2. Ibuki M, Lee D, Shinojima A, et al.. Rice bran and vitamin B6 suppress pathological neovascularization in a murine model of age-related macular degeneration as novel HIF inhibitors. Int J Mol Sci. 2020; 21(23): 8940. [DOI] [PMC free article] [PubMed] [Google Scholar]
- 3. Vähätupa M, Järvinen T, Uusitalo-Järvinen H.. Exploration of oxygen-induced retinopathy model to discover new therapeutic drug targets in retinopathies. Front Pharmacol. 2020; 11: 873. [DOI] [PMC free article] [PubMed] [Google Scholar]
- 4. Jang J, Kim Y.. Retinal vascular development in an immature retina at 33-34 weeks postmenstrual age predicts retinopathy of prematurity. Sci Rep. 2020; 10(1): 18111. [DOI] [PMC free article] [PubMed] [Google Scholar]
- 5. Chen S, Shen X.. Long noncoding RNAs: functions and mechanisms in colon cancer. Mol Cancer. 2020; 19(1): 167. [DOI] [PMC free article] [PubMed] [Google Scholar]
- 6. Xie W, Chu M, Song G, et al.. Emerging roles of long noncoding RNAs in chemoresistance of pancreatic cancer [published online ahead of print November 4, 2020]. Semin Cancer Biol, doi: 10.1016/j.semcancer.2020.11.004. [DOI] [PubMed] [Google Scholar]
- 7. Young T, Matsuda T, Cepko C.. The noncoding RNA taurine upregulated gene 1 is required for differentiation of the murine retina. Curr Biol. 2005; 15: 501–512. [DOI] [PubMed] [Google Scholar]
- 8. Zhang W, Chen L, Wu J, et al.. Long noncoding RNA TUG1 inhibits osteogenesis of bone marrow mesenchymal stem cells via Smad5 after irradiation. Theranostics. 2019; 9: 2198–2208. [DOI] [PMC free article] [PubMed] [Google Scholar]
- 9. Liu S, Liu L, Hu W, Wang M.. Long noncoding RNA TUG1 regulates the development of oral squamous cell carcinoma through sponging miR-524-5p to mediate DLX1 expression as a competitive endogenous RNA. J Cell Physiol. 2019; 234: 20206–20216. [DOI] [PubMed] [Google Scholar]
- 10. Wang J, Niu Y, Tao H, Xue M, Wan C.. Knockdown of lncRNA TUG1 inhibits hippocampal neuronal apoptosis and participates in aerobic exercise-alleviated vascular cognitive impairment. Biol Res. 2020; 53: 53. [DOI] [PMC free article] [PubMed] [Google Scholar]
- 11. Li X, Wang S, Li X, Yu F, Cong H.. Knockdown of long non-coding RNA TUG1 depresses apoptosis of hippocampal neurons in Alzheimer's disease by elevating microRNA-15a and repressing ROCK1 expression. Inflamm Res. 2020; 69: 897–910. [DOI] [PubMed] [Google Scholar]
- 12. Yu G, Li S, Liu P, et al.. LncRNA TUG1 functions as a ceRNA for miR-6321 to promote endothelial progenitor cell migration and differentiation. Exp Cell Res. 2020; 388(1): 111839. [DOI] [PubMed] [Google Scholar]
- 13. Li Y, Zhi K, Han S, et al.. TUG1 enhances high glucose-impaired endothelial progenitor cell function via miR-29c-3p/PDGF-BB/Wnt signaling. Stem Cell Res Ther. 2020; 11: 441. [DOI] [PMC free article] [PubMed] [Google Scholar]
- 14. Bonnet S, Boucherat O, Provencher S, Paulin R.. Early evidence for the role of lncRNA TUG1 in vascular remodelling in pulmonary hypertension. Can J Cardiol. 2019; 35: 1433–1434. [DOI] [PubMed] [Google Scholar]
- 15. Yang D, Yu J, Liu HB, Yan XQ, Du ZM.. The long non-coding RNA TUG1-miR-9a-5p axis contributes to ischemic injuries by promoting cardiomyocyte apoptosis via targeting KLF5. Cell Death Dis. 2019; 10: 908. [DOI] [PMC free article] [PubMed] [Google Scholar]
- 16. Wu Z, Zhao S, Li C, Liu C.. LncRNA TUG1 serves an important role in hypoxia-induced myocardial cell injury by regulating the miR1455pBinp3 axis. Mol Med Rep. 2018; 17(2): 2422–2430. [DOI] [PMC free article] [PubMed] [Google Scholar] [Retracted]
- 17. Shan W, Chen W, Zhao X, Pei A, Zhu S.. Long noncoding RNA TUG1 contributes to cerebral ischaemia/reperfusion injury by sponging mir-145 to up-regulate AQP4 expression. J Cell Mol Med. 2020; 24: 250–259. [DOI] [PMC free article] [PubMed] [Google Scholar]
- 18. Smith L, Wesolowski E, McLellan A, et al.. Oxygen-induced retinopathy in the mouse. Invest Ophthalmol Vis Sci. 1994; 35: 101–111. [PubMed] [Google Scholar]
- 19. Cai H, Liu X, Zheng J, et al.. Long non-coding RNA taurine upregulated 1 enhances tumor-induced angiogenesis through inhibiting microRNA-299 in human glioblastoma. Oncogene. 2017; 36: 318–331. [DOI] [PubMed] [Google Scholar]
- 20. Liu W. MicroRNA-9 inhibits retinal neovascularization in rats with diabetic retinopathy by targeting vascular endothelial growth factor A [published online ahead of print November 28, 2018]. J Cell Biochem, doi: 10.1002/jcb.28081. [DOI] [PubMed] [Google Scholar]
- 21. Owen L, Shirer K, Collazo S, et al.. The serine protease HTRA-1 is a biomarker for ROP and mediates retinal neovascularization. Front Mol Neurosci. 2020; 13: 605918. [DOI] [PMC free article] [PubMed] [Google Scholar]
- 22. Hengartner T, Adams M, Pfister R, et al.. Associations between red blood cell and platelet transfusions and retinopathy of prematurity. Neonatology. 2020; 117(5): 1–7. [DOI] [PMC free article] [PubMed] [Google Scholar]
- 23. Sui A, Chen X, Shen J, et al.. Inhibiting the NLRP3 inflammasome with MCC950 ameliorates retinal neovascularization and leakage by reversing the IL-1β/IL-18 activation pattern in an oxygen-induced ischemic retinopathy mouse model. Cell Death Dis. 2020; 11: 901. [DOI] [PMC free article] [PubMed] [Google Scholar]
- 24. Yao Y, Cai Y, Sui A, et al.. Etanercept as a TNF-alpha inhibitor depresses experimental retinal neovascularization. Graefes Arch Clin Exp Ophthalmol. 2021; 259: 661–671. [DOI] [PubMed] [Google Scholar]
- 25. Kang Q, Yang C.. Oxidative stress and diabetic retinopathy: Molecular mechanisms, pathogenetic role and therapeutic implications. Redox Biol. 2020; 37: 101799. [DOI] [PMC free article] [PubMed] [Google Scholar]
- 26. Zhang X, Lu Y, He N, Wang F.. Downregulation of PHLPP1 ameliorates high glucose-evoked injury in retinal ganglion cells by attenuating apoptosis and oxidative stress through enhancement of Nrf2 activation. Exp Cell Res. 2020; 397(2): 112344. [DOI] [PubMed] [Google Scholar]
- 27. Sarropoulos I, Marin R, Cardoso-Moreira M, Kaessmann H.. Developmental dynamics of lncRNAs across mammalian organs and species. Nature. 2019; 571(7766): 1–5. [DOI] [PMC free article] [PubMed] [Google Scholar]
- 28. Iyengar BR, Choudhary A, Sarangdhar MA, Venkatesh KV, Gadgil CJ, Pillai B.. Non-coding RNA interact to regulate neuronal development and function. Front Cell Neurosci. 2014; 8(9): 47. [DOI] [PMC free article] [PubMed] [Google Scholar]
- 29. Yan Z, Siwei C, Yurong J, et al.. Decoding noncoding RNAs: Role of microRNAs and long noncoding RNAs in ocular neovascularization. Theranostics. 2017; 7: 3155–3167. [DOI] [PMC free article] [PubMed] [Google Scholar]
- 30. Cong Y, Lifu L, Fei X, et al.. LncRNA TUG1 sponges miR-204-5p to promote osteoblast differentiation through upregulating Runx2 in aortic valve calcification. Cardiovasc Res. 2018; 114: 168–179. [DOI] [PubMed] [Google Scholar]
- 31. Cai H, Xue Y, Hu Y, et al.. The long noncoding RNA TUG1 regulates blood-tumor barrier permeability by targeting miR-144. Oncotarget. 2015; 6: 19759–19779. [DOI] [PMC free article] [PubMed] [Google Scholar]
- 32. Cai H, Liu X, Zheng J, Xue Y, Ma J, Li Z, et al.. Long non-coding RNA taurine upregulated 1 enhances tumor-induced angiogenesis through inhibiting microRNA-299 in human glioblastoma. Oncogene. 2017; 36: 318–331. [DOI] [PubMed] [Google Scholar]
- 33. Zhang L, Cheng H, Yue Y, Li S, Zhang D, He R.. TUG1 knockdown ameliorates atherosclerosis via up-regulating the expression of miR-133a target gene FGF1. Cardiovasc Pathol. 2018; 33: 6. [DOI] [PubMed] [Google Scholar]
- 34. Li Y, Zheng D, Pan L, Dai Y, Zhu HP.. Knockdown of TUG1 by shRNA inhibited renal cell carcinoma formation by miR-299–3p/VEGF axis in vitro and in vivo. Eur J Pharmacol. 2019; 860: 172536. [DOI] [PubMed] [Google Scholar]
- 35. Wang X, Bove A, Simone G, Ma B.. Molecular bases of VEGFR-2-mediated physiological function and pathological role. Front Cell Dev Biol. 2020; 8: 599281. [DOI] [PMC free article] [PubMed] [Google Scholar]
- 36. Kasprzak A. Angiogenesis-related functions of Wnt signaling in colorectal carcinogenesis. Cancers. 2020; 12: 3601. [DOI] [PMC free article] [PubMed] [Google Scholar]
- 37. Xiao X, Chen M, Xu Y, et al.. Sodium butyrate inhibits neovascularization partially via TNXIP/VEGFR2 pathway. Oxid Med Cell Longev. 2020; 2020: 6415671. [DOI] [PMC free article] [PubMed] [Google Scholar]
- 38. Campochiaro P, Akhlaq A.. Sustained suppression of VEGF for treatment of retinal/choroidal vascular diseases. Progr Retin Eye Res. 2020; 83: 100921. [DOI] [PubMed] [Google Scholar]
- 39. Mettu P, Allingham M, Cousins S.. Incomplete response to Anti-VEGF therapy in neovascular AMD: Exploring disease mechanisms and therapeutic opportunities. Progr Retin Eye Res. 2020; 83: 100906. [DOI] [PMC free article] [PubMed] [Google Scholar]
- 40. Shi Y, Liu Z, Zhang Q, et al.. Phosphorylation of seryl-tRNA synthetase by ATM/ATR is essential for hypoxia-induced angiogenesis. PLoS Biol. 2020; 18(12): e3000991. [DOI] [PMC free article] [PubMed] [Google Scholar]
- 41. Zeng Y, Fu B.. Resistance Mechanisms of Anti-angiogenic Therapy and Exosomes-Mediated Revascularization in Cancer. Front Cell Dev Biol. 2020; 8: 610661. [DOI] [PMC free article] [PubMed] [Google Scholar]
- 42. Khurana R, Kunimoto D, Yoon Y, Wykoff C, Chang A, Maturi R, et al.. Two-year results of the phase 3 randomized controlled study of abicipar in neovascular age-related macular degeneration. Ophthalmology. 2021; 128: 1027–1038. [DOI] [PubMed] [Google Scholar]
- 43. Mei D, Tan W, Tay Y, Mukhopadhyay A, Wong W.. Therapeutic RNA Strategies for Chronic Obstructive Pulmonary Disease. Trends Pharmacol Sci. 2020; 41: 475–486. [DOI] [PubMed] [Google Scholar]
- 44. Araújo R, Bitoque D, Silva G.. Dual-acting antiangiogenic gene therapy reduces inflammation and regresses neovascularization in diabetic mouse retina. Mol Ther Nucleic Acids. 2020; 22: 329–339. [DOI] [PMC free article] [PubMed] [Google Scholar]


