

Abstract
Episodic memory requires associating items with temporal context, a process for which the medial temporal lobe (MTL) is critical. This study uses recordings from 27 human subjects who were undergoing surgical intervention for intractable epilepsy. These same data were also utilized in Umbach et al. (2020). We identify 103 memory-sensitive neurons in the hippocampus and entorhinal cortex, whose firing rates predicted successful episodic memory encoding as subjects performed a verbal free recall task. These neurons exhibit important properties. First, as predicted from the temporal context model, they demonstrate reinstatement of firing patterns observed during encoding at the time of retrieval. The magnitude of reinstatement predicted the tendency of subjects to cluster retrieved memory items according to input serial position. Also, we found that spiking activity of these neurons was locked to the phase of hippocampal theta oscillations, but that the mean phase of spiking shifted between memory encoding versus retrieval. This unique observation is consistent with predictions of the “Separate Phases at Encoding And Retrieval (SPEAR)” model. Together, the properties we identify for memory-sensitive neurons characterize direct electrophysiological mechanisms for the representation of contextual information in the human MTL.
Keywords: Episodic memory, MTL, Single unit, Local field potential, Temporal clustering, Phase offset
1. Introduction
Episodic memory requires the association of items with context, and extensive experimental evidence supports the role of the hippocampus and medial temporal lobe (MTL) structures for episodic processing (Kahana et al., 2008). However, single unit data recorded from the human MTL during episodic memory formation have been rare (Gelbard-Sagiv et al., 2008; Paz et al., 2010; Ison et al., 2015; Faraut et al., 2018; Folkerts et al., 2018; Vaz et al., 2020), partially owing to the fact that a large portion of existing datasets employ recognition or working memory paradigms (Rutishauser et al., 2006; Rutishauser et al., 2010; Howard et al., 2012; Wixted et al., 2014; Rutishauser et al., 2015; Kornblith et al., 2017; Mormann et al., 2017; Wixted et al., 2018; Kamiński et al., 2020) or spatial navigation tasks (Lee et al., 2018; Qasim et al., 2019; Tsitsiklis et al., 2020). Neurophysiological properties of both phase locking and firing rate changes have been linked with successful memory representations during spatial navigation (Watrous et al., 2018). The former indicates phase-coding, meaning that the timing of spiking activity aligns to a consistent phase for encoded information, and the latter indicates rate-coding in which the frequency of spiking activity is linked with successful memory formation. In data collected using associative memory tasks, authors report memory-relevant coding of information in both firing rate changes and phase convergence (Rutishauser et al., 2010). Reports of MTL single unit data during associative memory formation reveal population-level increases in firing rate for hippocampal neurons (Staresina et al., 2019). However, the properties of MTL neurons whose activity predicts successful encoding (rather than exhibiting sensitivity to memory task conditions more generally) have not been well-characterized. Such data are important for developing updated models of mnemonic processing especially in relation to subsequent memory effects (SME) and informing neuromodulation strategies (Rey et al., 2015; Watrous et al., 2018).
A key feature of episodic memory models including the temporal context model (TCM), is that the reinstatement of contextual information occurs when episodic memories are retrieved (Manning et al., 2011; Sederberg et al., 2011). The resulting predictions from these models are that activity patterns present during encoding should be reinstated at retrieval, and that reinstatement should be associated with behavioral features of episodic memory such as the temporal clustering effect, which is a tendency to preferably encode temporally adjacent information (Polyn et al., 2009). Studies using invasive neural recordings in humans support such predictions (Manning et al., 2011; Yaffe et al., 2014; Long and Kahana, 2015; Goyal et al., 2018; El-Kalliny et al., 2019). Evidence for contextual representation derived from single unit data has principally come from changes in autocorrelated population-level neural activity, or “drift.” Howard et al. (2012) and Folkerts et al. (2018) employed a visual recognition memory paradigm (that does not make behavioral demands on the representation of temporal contextual information) and measured single neuron activity in human MTL. They found that population vectors of the activity of whole populations of neurons change over the scale of seconds to minutes (drift) and exhibit reinstatement, which suggests such measures carry information regarding temporal context. However, (i) the functions of memory-sensitive MTL neurons in contextual representations, and (ii) how such neurons’ activity maps with the predictions of models of episodic memory, have not been explored in human microelectrode data using the free recall paradigm.
Reinstatement models including TCM must further address how the MTL can simultaneously reinstate the encoding-related context but also represent updated “context” at retrieval. The Separate Phases at Encoding And Retrieval (SPEAR) model offers a parsimonious solution (Hasselmo et al., 2002): in CA1, the theta phase at which input from the entorhinal cortex arrives shifts between encoding versus retrieval, creating a mechanism to distinguish past from present context. Studies using rodent data report distinct theta phases for spiking activity observed during encoding versus retrieval periods (Manns et al., 2007; Colgin et al., 2009), and evidence also exists in human intracranial (neocortical) recordings (Rizzuto et al., 2006) and scalp electroencephalography (Kerren et al., 2018). The original model predicts that theta phase observed at encoding flips (180°) at retrieval (Hasselmo et al., 2002; Kerren et al., 2018), but empirically observed phase offset may be smaller (Judge and Hasselmo, 2004; Manns et al., 2007). Studies examining phase offset between encoding and retrieval using human single cells in MTL are scarce, but some evidence from spatial navigation paradigms favors the reinstantiation of phase information rather than a phase shift (Watrous et al., 2018), contrary to the predictions of SPEAR.
The present study sought to identify memory-sensitive MTL neurons demonstrating a subsequent memory effect whose firing rate predicted successful contextually-dependent episodic encoding. In accordance to Faraut et al. (2018), we expected that the proportion of such neurons would be around 10% of sampled MTL units. We tested how their properties comport with key models of episodic processing including the temporal context and SPEAR models. We employed a verbal free recall task for testing episodic memory and used microelectrodes to record single neuron activity from the human MTL of 27 subjects performing the task. This task demands the direct representation of temporal contextual information, as the associative information for each item is uniquely drawn from the list on which the item was presented. Thus, microelectrode data collected during free recall complements previous findings related to neural contiguity and reinstatement of firing rate activity seen during encoding with high confidence in recognition memory paradigms (Folkerts et al., 2018).
2. Materials and methods
2.1. Subjects and microelectrode recording
Twenty-seven human subjects diagnosed with intractable epilepsy were included in the study after undergoing implantation with intracranial microelectrodes for seizure recording at Thomas Jefferson University Hospital (TJUH) or University of Texas Southwestern (UTSW). Mean ± standard deviation of age was 37.25 ± 12.85 years for TJUH (n = 20) and 25.43 ± 5.62 years for UTSW subjects (n = 7), and the age difference was not significant according to two-sided rank-sum test (p = 0.060). There were 12 males and 8 females in TJUH, and 4 males and 3 females in UTSW (a total of 22 right-handed out of 27). The subjects completed a total of 40 recording sessions which we treated independently for the purposes of behavioral analyses. Table 1 provides subjects’ information. These data also contributed to a previous publication (Umbach et al., 2020).
Table 1.
Subject characteristics (n = 27).
| Index | Sex | Age | Handedness | Epilepsy zone | Epilepsy duration (y) |
|---|---|---|---|---|---|
| 1 | M | 44 | R | L temporal | 26 |
| 2 | F | 34 | R | L temporal | 15 |
| 3 | F | 44 | R | L medial temporal and R temporal | 38 |
| 4 | F | 23 | R | R anterolateral temporal | 3 |
| 5 | M | 45 | R | B temporal | 15 |
| 6 | M | 23 | R | R multifocal (lateral and medial temporal, frontal) | 3 |
| 7 | M | 53 | R | L hippocampus | 1 |
| 8 | M | 20 | R | R posterior temporal | 10 |
| 9 | F | 52 | R | R anterior temporal | 11 |
| 10 | M | 31 | L | R multifocal (poorly localized) | 17 |
| 11 | M | 18 | R | R superior temporal | 1 |
| 12 | F | 44 | R | L anterior temporal and hippocampus | 3 |
| 13 | M | 51 | R | B temporal | 35 |
| 14 | M | 56 | R | L temporal | 6 |
| 15 | M | 47 | R | R frontal | 31 |
| 16 | F | 21 | R | L temporal | 5 |
| 17 | M | 43 | N/A | L anterior/middle temporal | 7 |
| 18 | M | 47 | R | L frontal and temporal | 15 |
| 19 | F | 24 | L | L temporal | 12 |
| 20 | F | 25 | R | N/A | N/A |
| 21 | M | 29 | A | R amygdala and hippocampus | 10 |
| 22 | F | 27 | R | L hippocampus | 12 |
| 23 | M | 22 | R | R temporal, L hippocampus | 3 |
| 24 | F | 20 | R | B hippocampus | 3 |
| 25 | F | 35 | R | L hippocampus, lingual gyrus, precuneus | 5 |
| 26 | M | 26 | L | L amygdala, hippocampus, entorhinal cortex | 7 |
| 27 | M | 19 | R | R superior temporal | 11 |
Abbreviations: A = ambidextrous, B = bilateral, N/A = Not available.
We extracted both local field potential (LFP) activity and the spike trains of single neurons via Behnke-Fried style microelectrodes (AdTech, Oak Creek, WI). The electrodes had macroelectrode contacts along their longitudinal axes and 9 × 40-μm platinum-iridium microwires extruding from their tips. Microelectrode sampling rates were 32552 Hz with Cheetah (Neuralynx, Bozeman, MT) at TJUH and 30000 Hz with NeuroPort (Blackrock Microsystems, Salt Lake City, UT) at UTSW. Electrodes adjacent to regions of frequent interictal activity or those with excessive noise were excluded from analyses (Qasim et al., 2019). For the analysis of oscillations, we utilized LFP recordings from microelectrodes only (rather than adjacent macroelectrodes). A microelectrode channel identified during initial recording as being the quietest (no spikes) or noise-free was selected as the common local reference for the adjacent microwires on the bundle to maximize the signal clarity. In further processing, the LFP was not additionally re-referenced.
The implantation location for all intracranial electrodes, including those in the MTL, were based on consensus conference of the surgical epilepsy team for the purpose of monitoring and treating epilepsy. The anatomical locations of electrodes were identified by trained neuroradiologists based on post-implantation computed tomography images coregistered with pre-implantation magnetic resonance images. Coregistration was performed using FSL FLIRT (Jenkinson and Smith, 2001; Jenkinson et al., 2002), and the localization FreeSurfer Freeview (https://surfer.nmr.mgh.harvard.edu).
2.2. Experimental design and procedure
We employed a verbal free recall task for testing episodic memory, which probes memory performance by sequentially presenting lists of nouns before asking subjects to retrieve words from the most recently presented list without any memory cues. Following a practice item list, an experimental session included a maximum of 25 lists (trials) consisting of an encoding period during which items were presented, an arithmetic distractor task, and a 30- or 45-second retrieval period during which subjects freely recalled as many items as possible from the immediately preceding list (Fig. 1a). Subjects were instructed not to include items from previous lists. After each list, subjects were given a 10 s countdown preceding the next list’s encoding period, but they were able to pause between each list for a break. A session with 25 trials took around 34 min. We asked all subjects to sit upright in a bed and placed a laptop on a bedside Table 25 to 30 cm away from them, so that the screen was at their eye level and the keyboard was positioned at a right angle in relation to the screen.
Fig. 1.
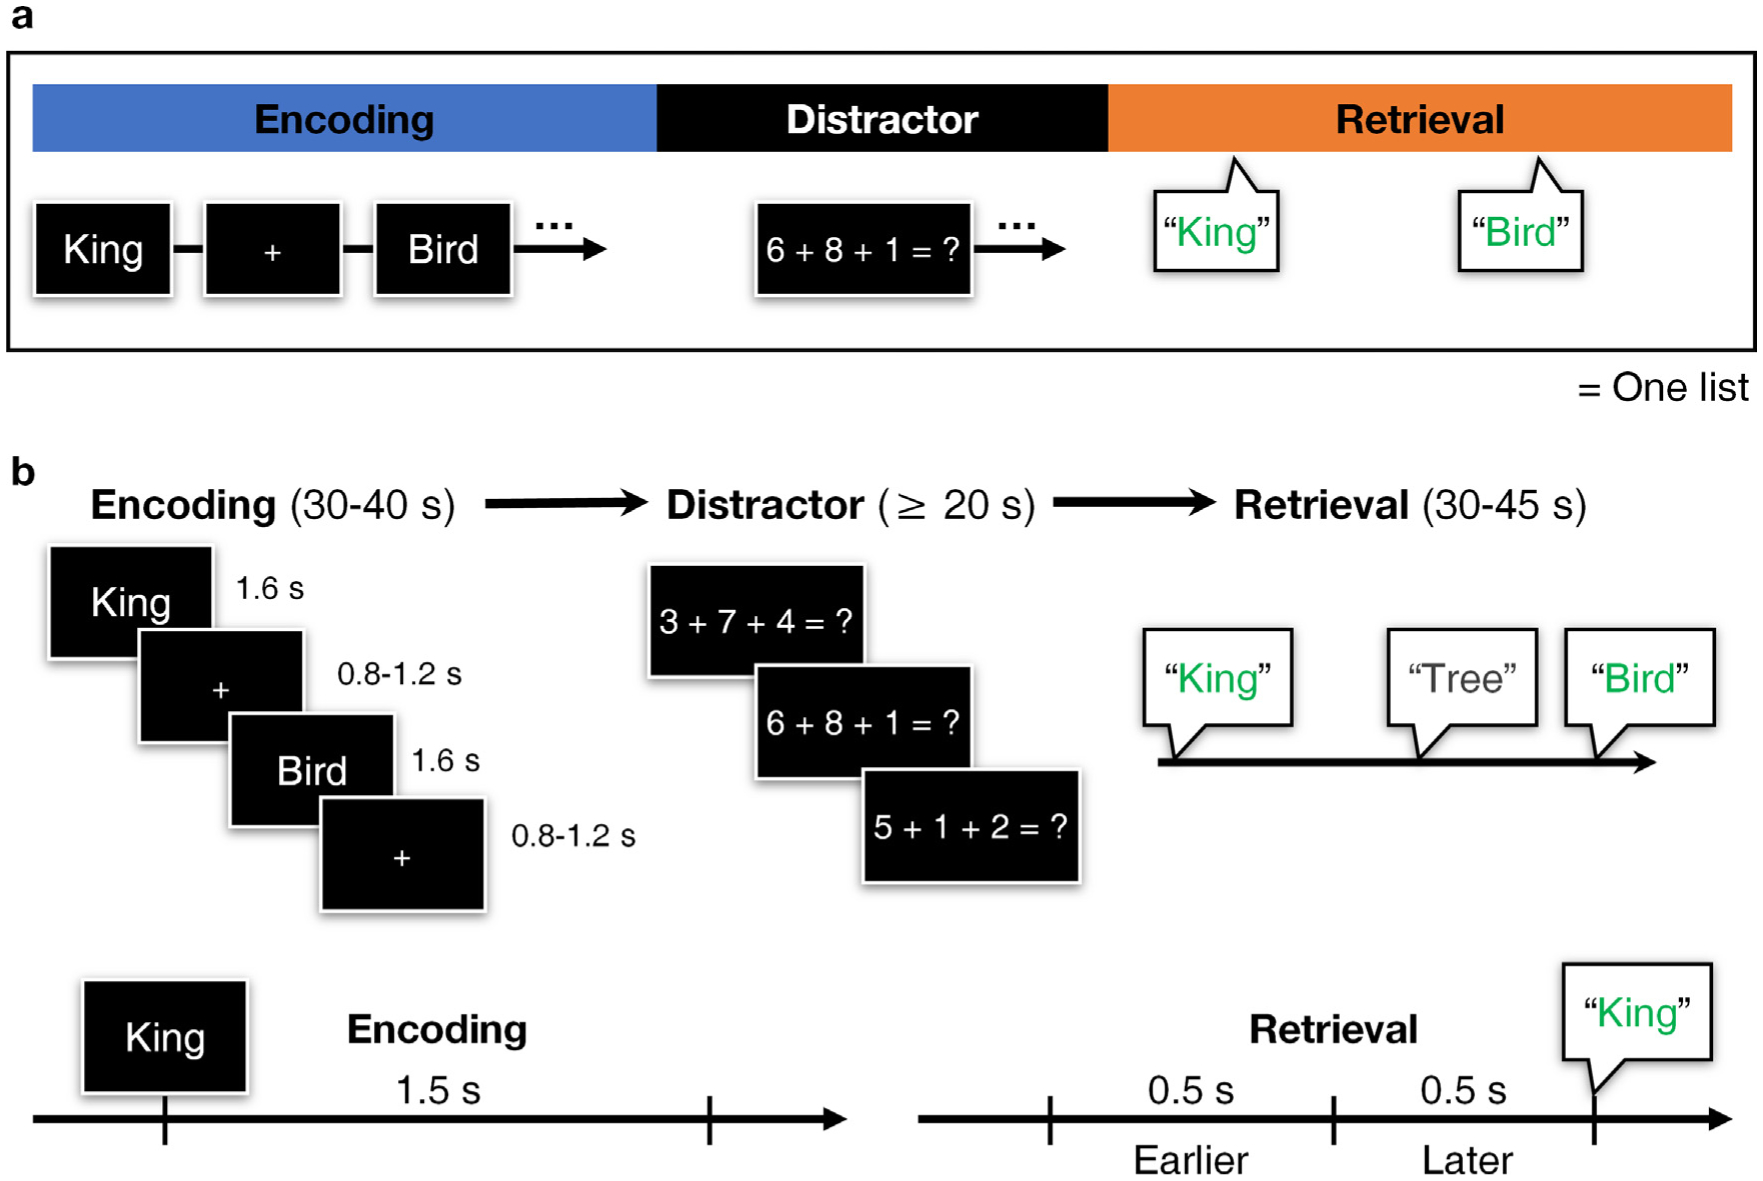
Experimental design illustrated. a, Schematic of the verbal free recall task for each list. Every session in the study included at least four lists with one practice list before the actual session begins. b, Structure of each period, with timelines of an encoding and a recall event. A recall event counts 1 s of silence preceding a recollection. We analyze two windows spanning −1000 to −501 ms and −500 to −1 ms from recollection separately as earlier and later retrieval periods.
During each encoding period, subjects were given a sequence of words out of a total of 308 unique English nouns (3–6 letters, median 4). Each word appeared only once during the entire session and lasted on screen for 1.6 s in arial font. Inter-stimulus interval was jittered ranging from 0.8 to 1.2 s, during which subjects viewed a fixation crosshair (Fig. 1b). Subjects at TJUH studied 15 words across a 40 s encoding period, whereas those at UTSW studied 12 words per list for 30 s. We adjusted the number of encoded words at UTSW to improve performance. In the distractor period, subjects typed in answers to simple arithmetic problems (A + B + C = ?) for 20 s or longer to minimize any rehearsal effects. A, B, and C were random nonzero one-digit integers. During the retrieval period, subjects were told to vocalize as many words from the immediately preceding encoding list as possible within the 30 (UTSW) or 45 (TJUH) s retrieval period (free recall). Subjects at TJUH were given longer retrieval period to compensate for the additional encoded words and to facilitate recall.
2.3. Extraction of behavioral data
For the analysis of behavior-related data, we examined 1.5 s window following item presentation during encoding, and 1 s preceding a recall event during the retrieval period. For valid recall events for further analyses, we selected those were temporally separated from adjacent vocalizations by 1 s to avoid including vocalization-related activity (Tan et al., 2020). This method of filtering the “temporally isolated” recall events was adopted from previous studies (Burke et al., 2014b; Lin et al., 2017). Within 1 s of a recall event, the initial 0.5 s epoch (−1000 to −501 ms from vocalization of recollected items) was defined as earlier, and the subsequent 0.5 s (−500 to −1 ms from vocalization) was termed later retrieval (Fig. 1b). Encoded items that were recollected correctly and temporally isolated by at least 1 s were “paired” to their recall events and were defined as “paired items.” The distribution of all recalled and paired items of all sessions is shown in Fig. S1. List intrusions were excluded from analyses.
To test for the presence of primacy and recency effects (Murdock, 1962), we calculated the success rate for each normalized serial position (Fig. 2a). Normalized serial position is defined by first discretizing each position into a linearly spaced range (0, 1] depending on each serial position’s relative location within the encoding list, where 0.1 equals to the closest-to-primacy and 1 the closest-to-recency position. This was done to combine data across subjects with different lengths of item lists. One normalized serial position may refer to two words because of the discretized range we used to combine data across subjects.
Fig. 2.
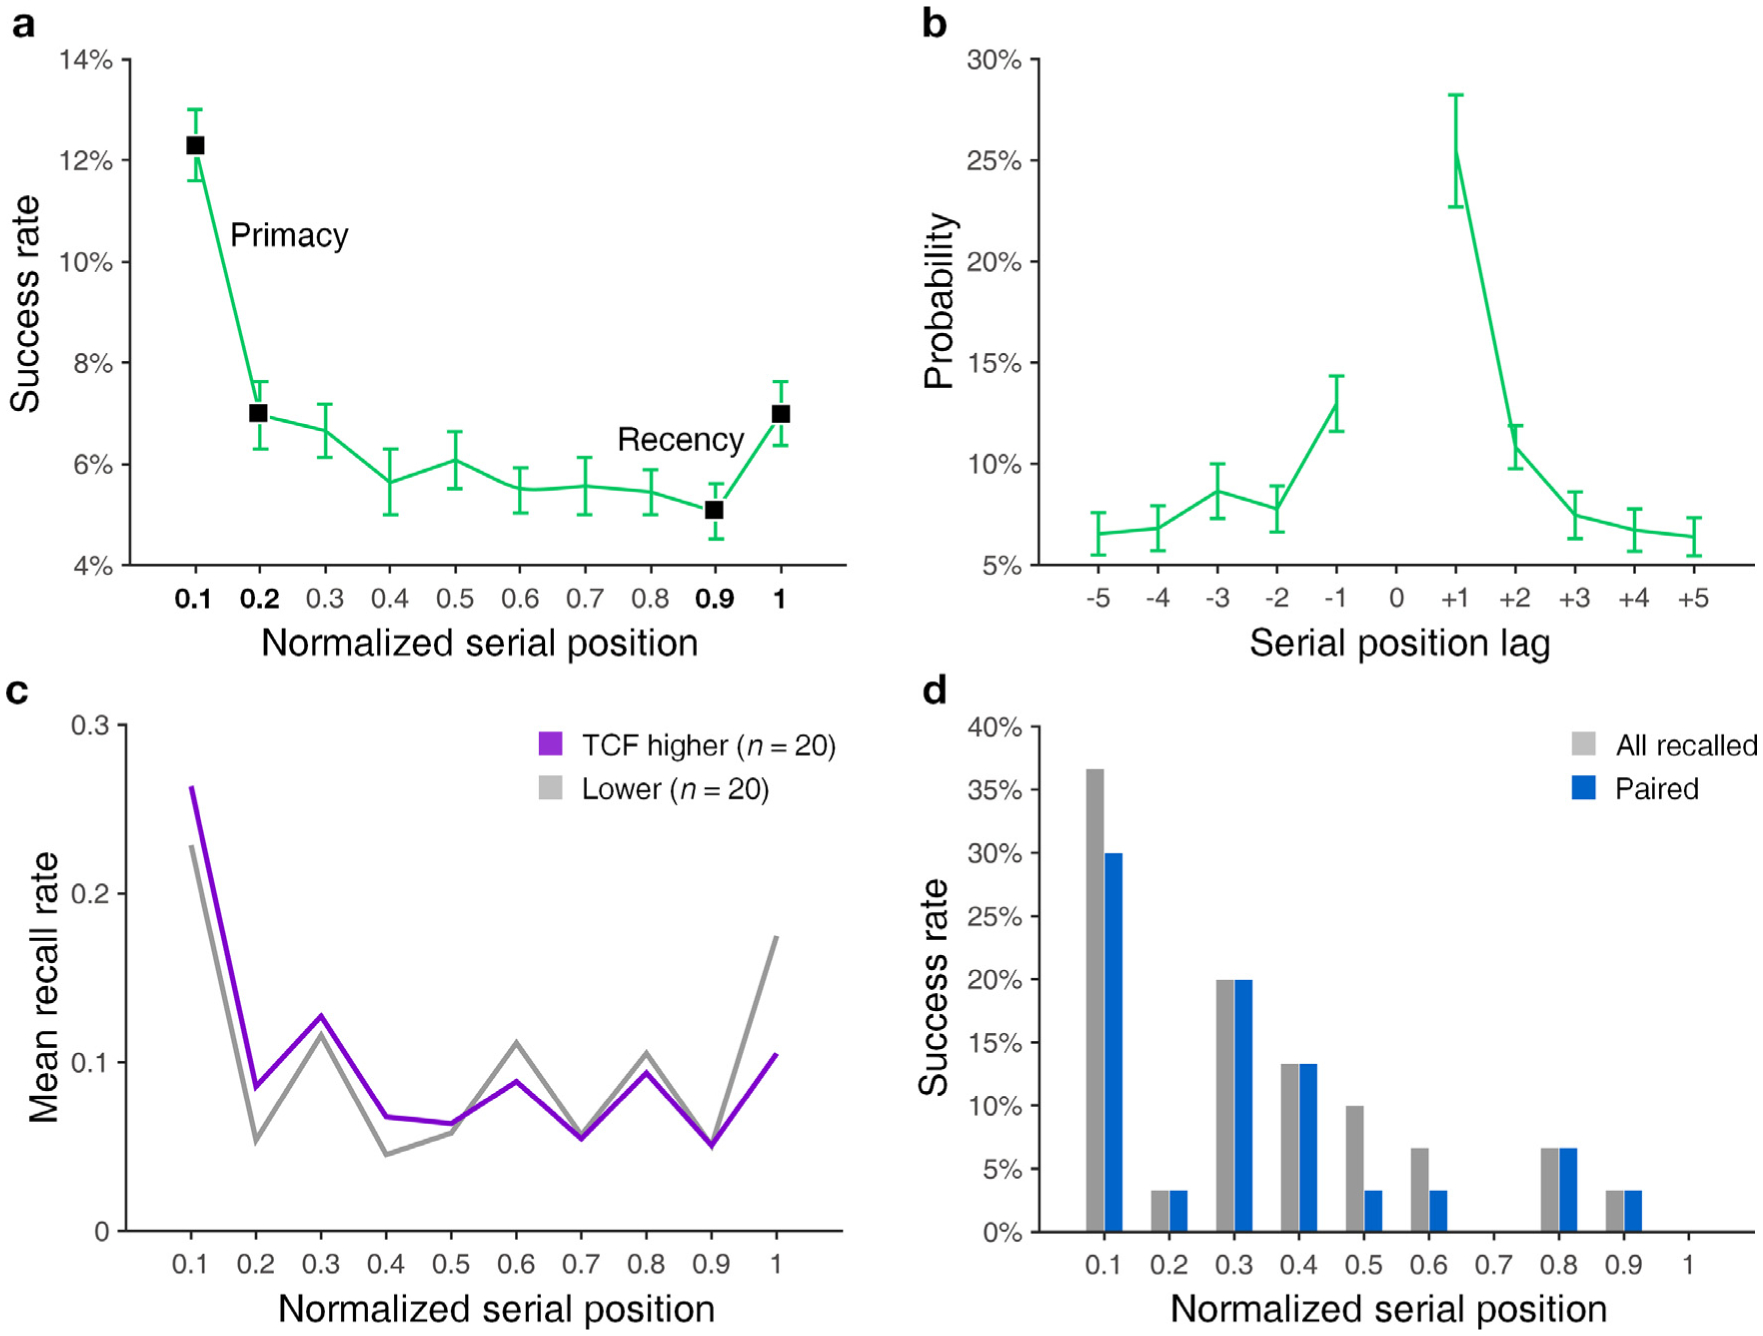
Behavioral outcomes of subjects. a, Successful recall rate for each normalized serial position. All error bars equal to standard error (SEM). Items encoded at the first 20% and last 20% of 15 or 12 serial positions are considered primacy and recency items and labeled in black markers. One normalized serial position refers to a proportionally discretized position and may correspond up to two words. b, Conditional response probability curves. Represents the probability of transition in retrieval to an item encoded in an adjacent position. Serial position lag represents the relative difference in serial position of the item recalled after the current one. The curve shape is consistent with the expected temporal clustering behavior. c, Serial position curves for individuals exhibiting both high (purple) and low (gray) temporal clustering behavior. d, An example of recall probability at each serial position for a single session from one subject demonstrating the results of our methodology for isolating retrieval events. Gray bars denote all items recalled, and blue bars the ones paired to corresponding retrieval for reinstatement analyses.
2.4. Contextual memory performance
Calculation of temporal clustering utilized the temporal clustering factor (TCF) following previous methods (Howard and Kahana, 2002; Polyn et al., 2009; Manning et al., 2011). A distribution of temporal distances in serial position is calculated per retrieval transition (first to second retrieval). The factor counts the proportion of possible temporal distances the actual transition is smaller than, so that the higher value indicates a higher tendency to retrieve a temporally closer word.
Calculation of semantic clustering factor (SCF) utilized latent semantic analysis to generate a similarity metric between words, following the methods of Umbach et al. (2020). We collected 100,000 documents from Wikipedia articles in English as of April 2010 (Shaoul, 2010) to construct a distribution of word count for latent semantic analysis (Landauer et al., 1998). Singular vector decomposition using MATLAB 2018b (The Math-Works Inc, Natick, MA) was applied to the word count matrix to quantify each word’s semantic information. This resulted in each word having a single value for each of the generated semantic dimensions. Semantic similarity between two words was calculated by the cosine similarity between their respective word vectors comprised of their value per semantic dimension. Each recall transition was scored by calculating the semantic similarity between the two words comprising the transition. The semantic clustering score was based on the average rank of the actual transitions made among all possible recall transitions. This generated a single value for each session. For calculating behavioral metrics including performance, TCF and SCF, we incorporated all recalled events prior to filtering paired events for electrophysiological analysis.
2.5. Preprocessing of local field potentials
This study followed the order of preprocessing implemented in Umbach et al. (2020) and Rutishauser et al. (2010). We used two types of zero-phase filters on the raw LFP (filtfilt in MATLAB): an equiripple lowpass finite impulse response filter with a cutoff frequency of 300 Hz, then two bandstop infinite impulse response filters with 4th order Butterworth design and a cutoff range of [58, 62] and [118, 122] Hz. The filtered time series was resampled down to 1000 Hz. Phase information was obtained using wavelet convolution with complex Morlet wavelets with a width of 6 cycles to account for both slow and fast frequency bands while minimizing loss of frequency or temporal resolution (Tallon-Baudry and Bertrand, 1999). We used a total of 21 log-spaced frequencies ranging from 2 to 64 Hz (Rutishauser et al., 2010). We subdivided slower (2–5 Hz) versus faster theta (5–9 Hz) ranges a priori because of their distinct roles in memory function reported by previous studies (Lega et al., 2012, 2016; Goyal et al., 2020). We did not employ signal interpolations in any steps (Rutishauser et al., 2010). We applied filters before resampling to avoid aliasing.
2.6. Single neuron identification
This study utilized the same dataset and methods as Umbach et al. (2020) for identifying single neurons. Before the spike detection and sorting, LFP was cleaned for broadband noise with volume conduction subtraction (Kota et al., 2016). We implemented the Combinato platform for spike identification, feature extraction, and single unit separation following published methods (Niediek et al., 2016). The second author (Gray Umbach) manually inspected: (i) the shape of the mean spike waveform; (ii) the fraction of inter-spike intervals shorter than 3 ms; (iii) the shape of the distribution of inter-spike intervals; (iv) the stationarity of unit spiking; and (v) similarity to other mean spike waveforms (Faraut et al., 2018). Potential single neurons were alternatively merged or discarded based on these five criteria. Due to small numbers of neurons outside of the hippocampus and entorhinal cortex, we excluded 23 neurons located in amygdala and parahippocampal regions. As a result, 713 single neurons from the hippocampus and EC were included in the analysis.
Spike trains of all neurons were aligned with LFP time series data and downsampled to 1000 Hz (1 kHz) for further processing. The LFP corresponding to a single neuron was obtained from the same microwire as the spiking activity, following Rutishauser et al. (2010). We tested the possibility of artificial introductions of single unit due to referencing by confirming that there are no trains of spikes that are common within a margin of error in ± 1 ms across all separated units in one session.
2.7. Identification of biological neuron types
Out of 713 identified units (putative neurons), there were 509 pyramidal neurons (71.4%). They were identified based on two criteria: (i) baseline FR less than or equal to 5 Hz (Skaggs et al., 1996; Davidson et al., 2009; Ison et al., 2011); and (ii) mean spike width equal to or longer than 0.40 milliseconds. We defined spike width as the trough-to-peak time and used Hartigan’s Dip test of unimodality (significantly multimodal, p < 0.001) with HartigansDipSignifTest in MATLAB (code by Ferenc Mechler (2002), original link: http://www.nicprice.net/diptest/, retrieved: https://gist.github.com/schluppeck/) (Hartigan and Hartigan, 1985). We determined the threshold value of mean spike width by fitting a 4th order polynomial curve to the histogram of spike width values and found the spike width at the local minimum of this fit to divide between narrow and wide modes. The distribution of spike width values of all 713 neurons is shown in Fig. S2. Those categorized as non-pyramidal neurons (n = 204, 28.6%) include interneurons, or those with narrower spike widths or slower firing rates than predicated by rodent data. Table 2 provides physiological details of single units.
Table 2. Physiological properties of all single neurons (n = 713).
Firing rate refers to the baseline firing rate, which is defined as the number of spikes over the length of spike train recorded in one session. Spike width and burst index are defined per Faraut et al. (2018). Spike width (trough-to-peak time) refers to the time a spike takes to reach the maximum (peak) from the minimum (trough) of the mean waveform averaged across all spikes in the designated cluster. Burst index indicates the proportion of spikes that occur in less than 10 ms after the previous ones. All in means (standard deviations).
| Types | Firing rate (Hz) | Spike width (ms) | Burst index | N |
|---|---|---|---|---|
| Pyramidal | 0.7680 (0.9894) | 0.5839 (0.0620) | 0.0483 (0.0461) | 509 |
| Non-pyramidal | 2.8122 (4.5164) | 0.3508 (0.1384) | 0.0495 (0.0646) | 204 |
2.8. Identification of neuron groups by subsequent memory effect
Subsequent memory effect (SME) neurons were statistically defined by comparing the distributions of firing rates (FR) observed during successfully recalled (SR) events compared to unsuccessfully recalled (UR) events with a one-sided Wilcoxon’s rank-sum test (p < 0.05). We compared 1.5 s epochs following item presentation to identify neurons whose FR was sensitive to encoding success. We labeled neurons with higher FR in SR relative to UR “SME cells,” and neurons with higher FR in UR relative to SR “AntiSME cells.” Those termed “NonSME” neurons exhibited FR not significantly sensitive to recall success. Example neurons in Fig. 3 come from each cell group. Fig. 4 includes further descriptions on cell populations of each group.
Fig. 3.
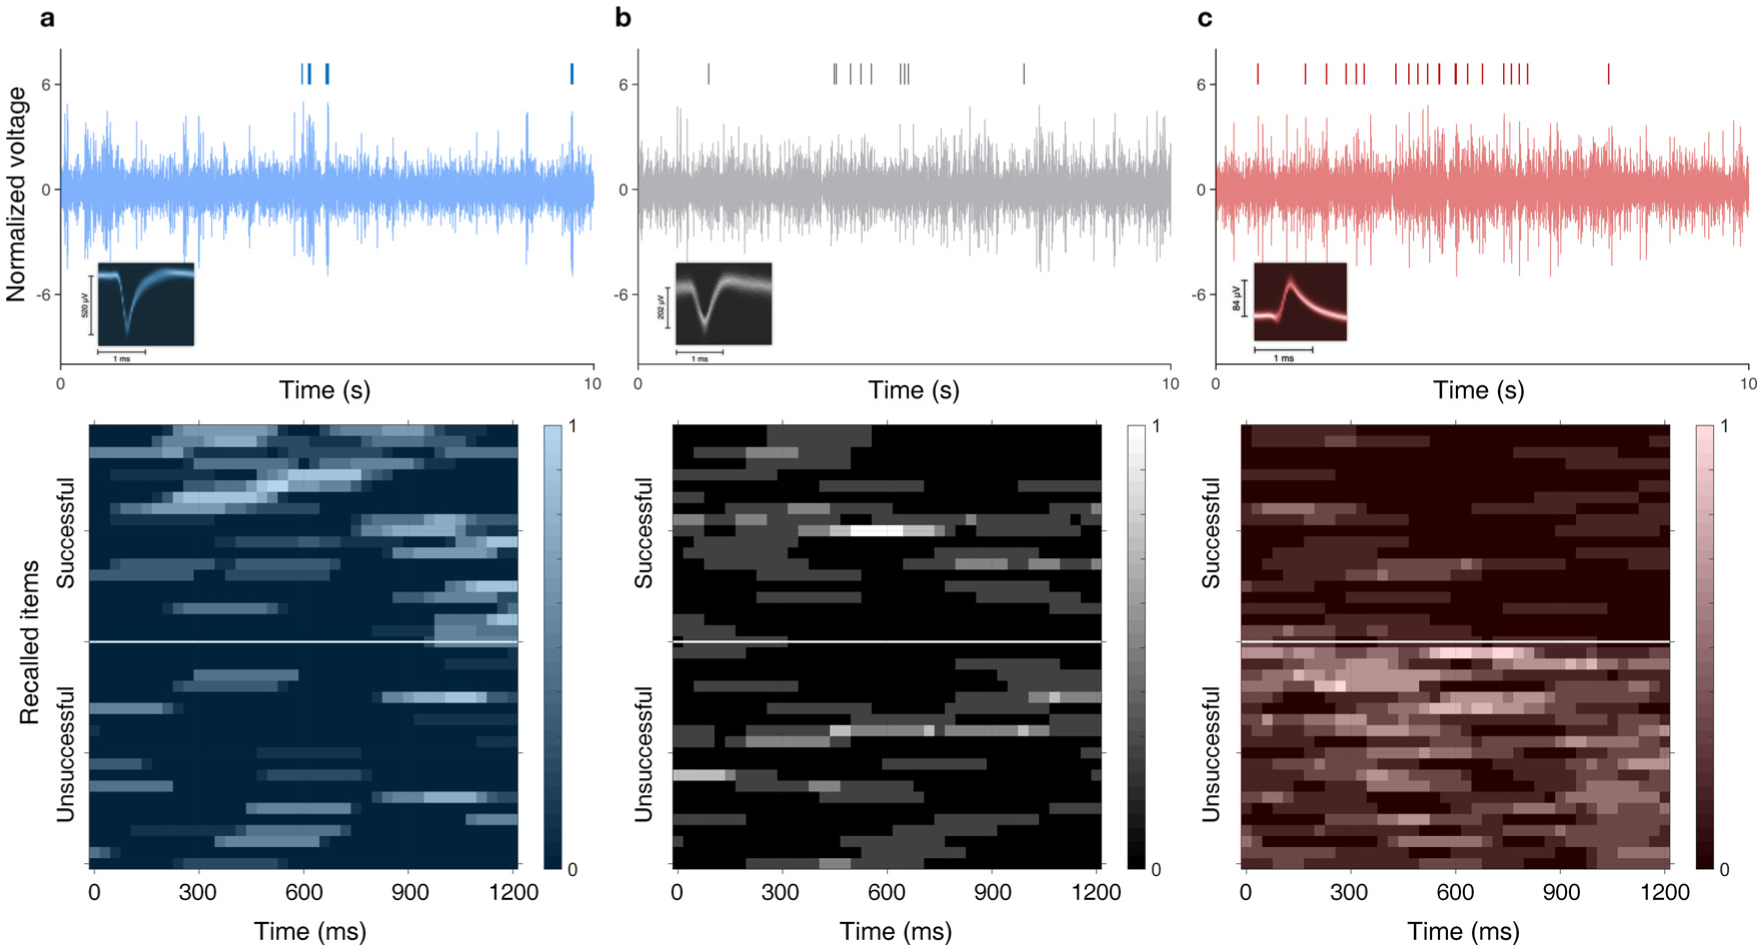
Selected examples of single unit activities. a, Behavior of an example SME cell. Top: neuronal spike train above 10 s of high-passed filtered local field potential (LFP, > 300 Hz) of the channel from which the neuron was isolated. The LFP signal is normalized by its mean and standard deviation. The density plot of the spike waveform is inset in the top left corner. Bottom: raster plot of sample encoding events’ firing rate during 20 successfully and unsuccessfully recalled random items. b, An example NonSME cell. c, An example AntiSME cell (greater firing rate during non-recalled items).
Fig. 4.
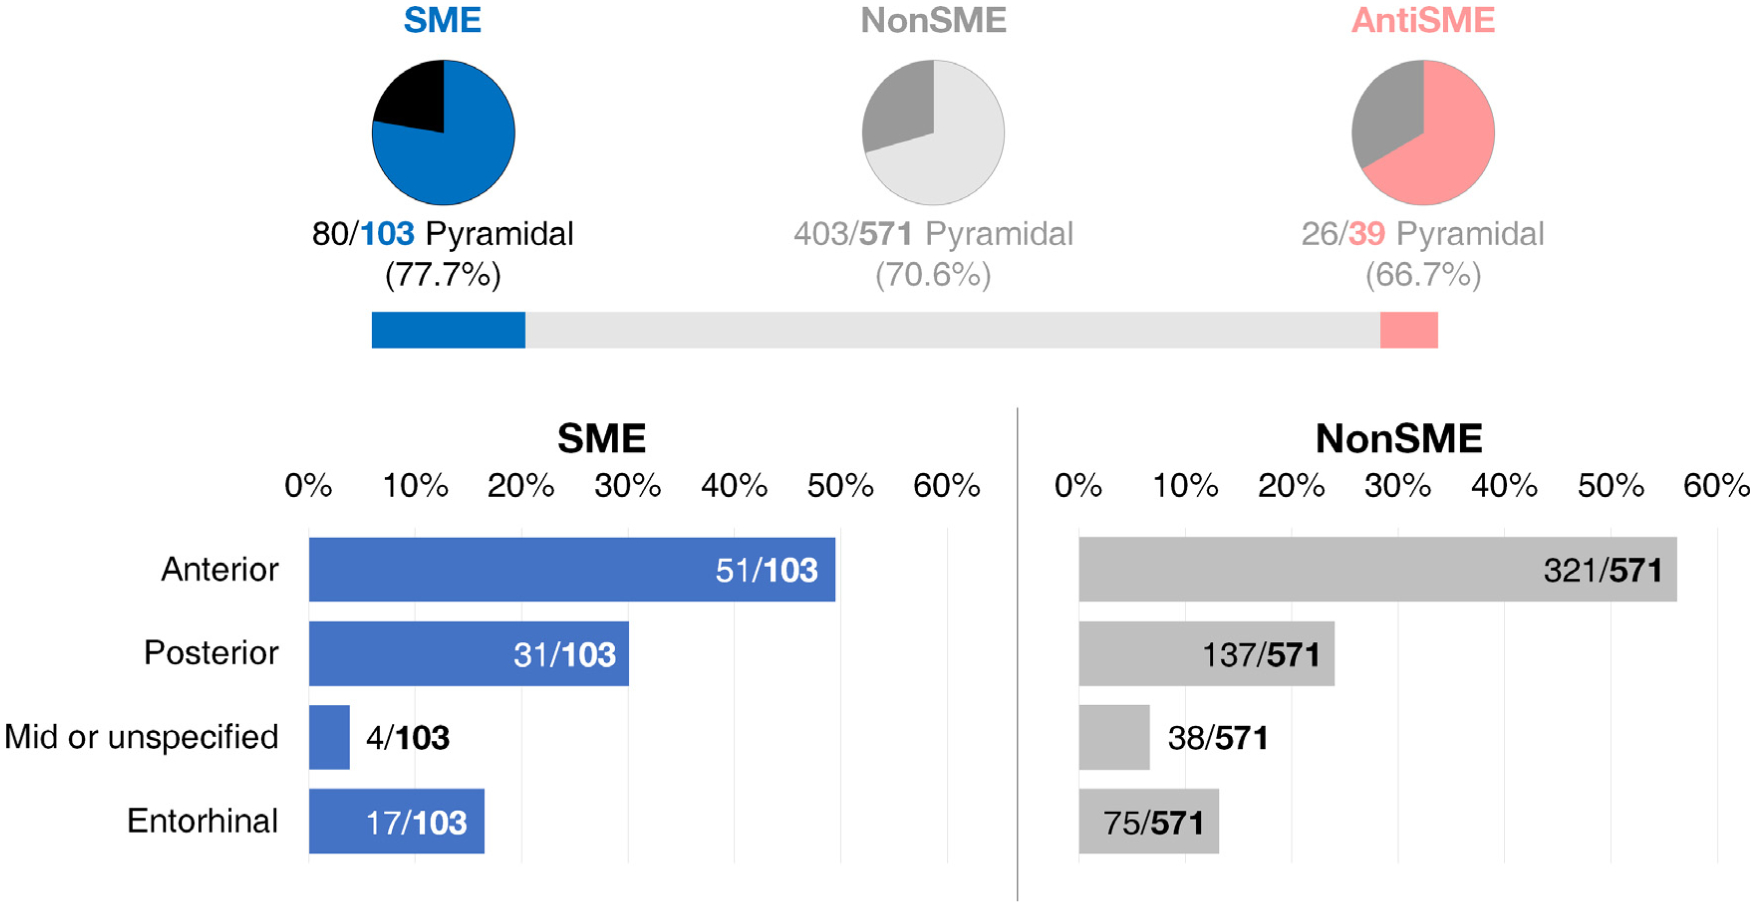
Behavioral classification of neurons and their regional proportion. Proportions of each type of functionally defined neurons are shown at top. The lengths of blue and red bars reflect the actual proportions of SME and AntiSME cell groups, respectively. The lower panels show the regional proportion of single cells identified for SME and NonSME groups.
When comparing FR across neurons, each neuron’s FR was normalized to its baseline via dividing by the average across recording, making a value of 1.0 equal to the baseline. For analysis of FR in continuous time, we used 300-ms-long sliding windows with 270-ms overlap. We applied Cramér’s V test (provided by http://vassarstats.net) of intercorrelation between discrete variables to verify if the three behavior-specific neuron types (SME, NonSME, AntiSME) and two biological neuron types (pyramidal and non-pyramidal) were related (Cramér, 1999). Table 3 provides information on how many SME neurons each session contributed.
Table 3.
Proportion of neurons identified by sessions and regions.
| Subject | Site | Lists | Regions (Number of neurons) | Neurons (SME) |
|---|---|---|---|---|
| TJ010 | TJUH | 13 | AntHp (8), PosHp (9), EC (0), Mid/Unspecified (0) | 19 (0) |
| TJ020 | TJUH | 6 | AntHp (0), PosHp (5), EC (6), Mid/Unspecified (2) | 13 (1) |
| TJ024 | TJUH | 7 | AntHp (44), PosHp (6), EC (11), Mid/Unspecified (0) | 61 (30) |
| TJ024 | TJUH | 8 | AntHp (20), PosHp (12), EC (7), Mid/Unspecified (0) | 39 (12) |
| TJ027 | TJUH | 6 | AntHp (0), PosHp (5), EC (0), Mid/Unspecified (0) | 5 (1) |
| TJ027 | TJUH | 4 | AntHp (0), PosHp (12), EC (0), Mid/Unspecified (0) | 12 (1) |
| TJ027 | TJUH | 8 | AntHp (0), PosHp (10), EC (0), Mid/Unspecified (0) | 10 (0) |
| TJ030 | TJUH | 16 | AntHp (34), PosHp (0), EC (51), Mid/Unspecified (0) | 85 (14) |
| TJ030 | TJUH | 16 | AntHp (10), PosHp (0), EC (17), Mid/Unspecified (0) | 27 (1) |
| TJ032 | TJUH | 9 | AntHp (0), PosHp (9), EC (3), Mid/Unspecified (0) | 12 (0) |
| TJ034 | TJUH | 15 | AntHp (9), PosHp (7), EC (0), Mid/Unspecified (0) | 16 (5) |
| TJ041 | TJUH | 16 | AntHp (14), PosHp (0), EC (0), Mid/Unspecified (0) | 14 (0) |
| TJ041 | TJUH | 16 | AntHp (18), PosHp (0), EC (0), Mid/Unspecified (0) | 18 (1) |
| TJ041 | TJUH | 16 | AntHp (7), PosHp (0), EC (0), Mid/Unspecified (0) | 7 (0) |
| TJ041 | TJUH | 16 | AntHp (23), PosHp (0), EC (0), Mid/Unspecified (0) | 23 (1) |
| TJ042 | TJUH | 9 | AntHp (3), PosHp (0), EC (0), Mid/Unspecified (13) | 22 (1) |
| TJ045 | TJUH | 16 | AntHp (11), PosHp (5), EC (0), Mid/Unspecified (0) | 16 (0) |
| TJ045 | TJUH | 9 | AntHp (4), PosHp (1), EC (0), Mid/Unspecified (0) | 5 (0) |
| TJ048 | TJUH | 16 | AntHp (3), PosHp (7), EC (0), Mid/Unspecified (0) | 10 (3) |
| TJ048 | TJUH | 16 | AntHp (2), PosHp (3), EC (0), Mid/Unspecified (0) | 5 (0) |
| TJ049 | TJUH | 12 | AntHp (30), PosHp (18), EC (0), Mid/Unspecified (0) | 48 (3) |
| TJ051 | TJUH | 16 | AntHp (15), PosHp (0), EC (0), Mid/Unspecified (0) | 15 (0) |
| TJ055 | TJUH | 16 | AntHp (6), PosHp (0), EC (0), Mid/Unspecified (2) | 8 (0) |
| TJ055 | TJUH | 16 | AntHp (4), PosHp (0), EC (0), Mid/Unspecified (1) | 5 (0) |
| TJ056 | TJUH | 7 | AntHp (13), PosHp (25), EC (0), Mid/Unspecified (0) | 38 (7) |
| TJ060 | TJUH | 16 | AntHp (0), PosHp (0), EC (0), Mid/Unspecified (0) | 13 (0) |
| TJ060 | TJUH | 16 | AntHp (0), PosHp (0), EC (0), Mid/Unspecified (0) | 19 (0) |
| TJ069 | TJUH | 16 | AntHp (0), PosHp (1), EC (0), Mid/Unspecified (0) | 1 (0) |
| TJ069 | TJUH | 16 | AntHp (0), PosHp (4), EC (0), Mid/Unspecified (0) | 4 (1) |
| TJ071 | TJUH | 16 | AntHp (3), PosHp (3), EC (0), Mid/Unspecified (0) | 6 (0) |
| TJ080 | TJUH | 16 | AntHp (6), PosHp (9), EC (0), Mid/Unspecified (0) | 15 (4) |
| TJ080 | TJUH | 16 | AntHp (11), PosHp (6), EC (0), Mid/Unspecified (0) | 17 (1) |
| TJ081 | TJUH | 11 | AntHp (22), PosHp (0), EC (0), Mid/Unspecified (24) | 61 (5) |
| UT084 | UTSW | 25 | AntHp (19), PosHp (0), EC (0), Mid/Unspecified (0) | 19 (3) |
| UT086 | UTSW | 25 | AntHp (13), PosHp (0), EC (0), Mid/Unspecified (0) | 13 (0) |
| UT113 | UTSW | 25 | AntHp (4), PosHp (7), EC (0), Mid/Unspecified (0) | 11 (1) |
| UT122 | UTSW | 25 | AntHp (17), PosHp (12), EC (0), Mid/Unspecified (0) | 29 (5) |
| UT128 | UTSW | 25 | AntHp (3), PosHp (2), EC (0), Mid/Unspecified (0) | 5 (0) |
| UT133 | UTSW | 25 | AntHp (10), PosHp (5), EC (0), Mid/Unspecified (0) | 15 (1) |
| UT142 | UTSW | 25 | AntHp (5), PosHp (2), EC (0), Mid/Unspecified (0) | 7 (1) |
Abbreviations: AntHp = anterior hippocampus, PosHp = posterior hippocampus, EC = entorhinal cortex.
2.9. Reinstatement of memory contexts in firing rate
We defined neural reinstatement as the degree of similarity between activity at encoding and retrieval represented in a series of FR values across events. Two FR vectors from each context were constructed per neuron by gathering raw FR values for all paired events (Burke et al., 2014b; Lin et al., 2017). Paired events refer to the same memory item at encoding and its earliest retrieval. We then calculated the Euclidean distance (Manns and Eichenbaum, 2009; Jacob and Nieder, 2014; Spaak et al., 2017) between paired FR vectors, so that the timing of spikes and FR per item are matched between encoding and retrieval for each encoded item. We defined the magnitude of neural reinstatement as 1/(Distance + 1) accounting for cases Distance = 0, where a higher value represents a greater reinstatement. All the statistical analyses in this study refer to the magnitude of reinstatement. We performed a shuffle analysis (1,000 shuffles) to show that a group of neurons is reinstating over chance. For each cell, we randomly selected SR events to comprise the encoding FR vector and matched it to a shuffled retrieval vector (as compared to the real reinstatement). The median of reinstatement values across all neurons in the real case was compared to the distribution of 1,000 medians from randomized data.
We subdivided the entire encoding and retrieval periods into time-resolved windows using 300-ms-long sliding windows (270-ms overlap) and performed a shuffle analysis for each pair of windows to contrast real over 1,000 randomized reinstatement values. A two-dimensional cluster correction (Maris and Oostenveld, 2007) was performed using p-values lower than 0.1 as the threshold, and minimum cluster size of a 5 × 5 window to identify significant time windows in retrieval where activity at encoding is reinstated. Note that the retrieval period is 1020 ms long instead of 1000 ms, because the 300-ms-long sliding windows terminate 20 ms past the recollection.
We note there are multiple alternatives for quantifying neural reinstatement, including cosine similarity (Manning et al., 2011; Folkerts et al., 2018; El-Kalliny et al., 2019) and linear regression coefficients (Howard et al., 2012). Had our analysis incorporated multiple neurons’ activity patterns or spectral patterns of intracranial electroencephalography for the similarity, such scale-invariant measures would be more appropriate. Since our paired FR vectors originated from one neuron, and we were interested in estimating the similarity of functional states, we chose Euclidean distance that directly accounts for changes in baseline activity, following the methods of Manns and Eichenbaum (2009), Spaak et al. (2017) and Jacob and Nieder (2014).
We correlated the magnitude of reinstatement with TCF and SCF by splitting neurons into two groups based on the median reinstatement score across all neurons. We then compared behavioral scores between the two groups using a one-sided rank-sum test. We also analyzed correlation with behavior using a one-sided Spearman’s correlation, and confirmed the robustness of the result with a partial Spearman’s correlation with overall recall performance as a controlling variable.
2.10. Spike-field coherence
Spike-field coherence (SFC) was used as the representative measure (Rutishauser et al., 2010) of phase locking. SFC, introduced by Fries et al. (1997), measures the periodic timing relationship between spikes and the local field oscillation as a function of frequency, via a percentage of oscillation power triggered by spikes compared to the average power spectrum of the local field around spikes. A higher SFC indicates higher tendency of phase locking of spikes at specific frequency (Fries et al., 2001). In the definition of SFC, the numerator is the frequency spectrum of spike-triggered average (STA), and the denominator is the spike-triggered power (STP). SFC is therefore the percentage of power spectrum of STA over STP. We took 500-ms-long windows of LFP before and after each spike, downsampled the signal by four times reducing the sampling frequency to 250 Hz (frequency resolution = 4 Hz) and obtained the STA by averaging the time series across all spikes. We quantified STP by taking the mean of power spectra of the downsampled time series using a multitaper method within the Chronux toolbox (Mitra, 2007). Parameters used in the process followed existing publications (Rutishauser et al., 2010). We calculated the SFC from neurons that had at least 10 spikes in both SR and UR conditions (75 out of 103 SME neurons). We avoided biases in sampling spikes by randomly selecting 10 spikes from each condition equally, repeating sampling 1,000 times and averaging the resultant 1,000 SFC values across sampling trials for each SME neuron. For the statistical comparison, we employed a permutation test using Cohen’s d of paired differences for the SFC between SR and UR conditions for SME neurons.
2.11. Phase shift between encoding and retrieval
We first identified the predominant oscillation frequency within the range highlighted in SFC analyses. We selected the log-spaced frequency bins in the range of interest by fitting the power spectra of the encoding period (starting at the first encoded item, ending at 1.5 s post the last encoded item) averaged across all lists to a function A * fα, based on Milstein et al. (2009). The power spectra were calculated using Welch’s method (Welch, 1967) with a 1 kHz sampling rate at each frequency bin (2–64 Hz) for the encoding periods of all lists. After fitting the model to the average power spectrum, we selected the dominant oscillation frequency within each band as that showing the maximum elevation of actual power above the fitted power estimate with the band selected from the SFC analysis. Spike phase values were extracted using Morlet wavelets at the dominant oscillation frequency bin. We used the CircStat toolbox for MATLAB (Berens, 2009) for analyzing all phase metrics.
We calculated the difference in phases from all paired items using encoding and retrieval events with at least one spike. For multiple spikes within each window, we selected the first spike plus all other spikes that were temporally isolated from the previous spike by at least 25 ms (Lisman, 1997) to prevent inclusion of bursting events occurring in close temporal proximity. We obtained the circular mean of all spikes’ phases selected, then subtracted the mean value observed at retrieval from that at encoding. All phase values were wrapped to [−π, π] for representation. This analysis was performed on all SME neurons. We assessed for significant phase offset by testing (1) the consistency of phase offsets in SME neurons using a Rayleigh Z test, (2) if the phase offset was significantly different from a mean of 0 deg (circ_mtest in CircStat), and (3) if the consistency (estimated using the Rayleigh statistic) was significantly higher in SME than NonSME neurons. These analyses were also performed with shuffle controls first by permuting the spike times (1,000 shuffles) while maintaining the temporal gap between spikes. To compare the magnitudes of phase offset consistency between SME and NonSME classes, we permuted the group labels 10,000 times.
3. Results
3.1. Behavioral results in free recall task
Subjects exhibited a median recall fraction of 25.0%. Recalled fraction of TJUH subjects (n = 33, 23.5 ± 9.2%) was lower than UTSW (n = 7, 37.6 ± 18.6%) according to two-sided rank-sum test (p = 0.033), although performance at both sites was similar to that reported in previous studies of human neurosurgical subjects performing free recall (Burke et al., 2013; Ezzyat et al., 2017). Fig. 2a demonstrates that primacy and recency effects are present in our data in line with Polyn et al. (2009). Fig. 2b shows a conditional response probability curve consistent with temporal clustering behavior (Howard and Kahana, 2002). We measured this directly using temporal clustering factor (TCF, see Polyn et al. (2009)). Subjects exhibited a median TCF of 0.610 – significantly higher than a chance value of 0.5 (one-sided sign test against median of 0.5, n = 40, p < 0.001). Primacy and recency recall effects were similar for subjects exhibiting both high (greater or equal to 0.610) and low (less than 0.610) TCF scores (Fig. 2c). List intrusion rate was low compared to the number of encoded words (median of 5.4% for all 40 subjects). For analyzing retrieval-related activity, we excluded any list intrusions and only included items isolated from previous and subsequent recall events to avoid noise from adjacent vocalizations. As with previous studies, however (Tan et al., 2020), this requirement did not significantly alter the response probability relationships on the subject level (see Fig. 2d for an example, Fig. S1 for all subjects).
3.2. Firing rate of MTL neuronal subpopulation predicts encoding success
We isolated 713 single neurons in hippocampus and entorhinal cortex. Characteristics of these single neurons matched published metrics for quality (Faraut et al., 2018; Umbach et al., 2020). Pyramidal cells were classified using published criteria (Skaggs et al., 1996; Davidson et al., 2009; Ison et al., 2011). We identified 103 neurons that exhibited significantly elevated FR during encoding of successfully remembered (SR) compared to unsuccessfully remembered (UR) items (p < 0.05, one-sided rank-sum test), representing a significant fraction out of the total population (14.4%, p < 0.001, one-sided binomial test). There were 39 neurons that showed a significantly decreased FR that predicted encoding success (AntiSME neurons), although the fraction was not significant (p = 0.305, one-sided binomial test). The remainder (571 neurons) did not exhibit significant FR changes related to encoding success (NonSME). NonSME neurons were used as a control group relative to SME neurons where appropriate. The fraction of pyramidal neurons comprising each subset were not significantly different (Cramér’s V stat = 0.060 (df = 2, n = 713) with p = 0.273). Of 103 SME neurons, 51 were identified in the anterior hippocampus (49.5%), 31 posterior hippocampus (30.1%), 4 in middle or unspecified hippocampus (3.9%), and 17 in entorhinal cortex (16.5%). The regional proportion of each cell type is visualized in Fig. 4.
3.3. Dynamic firing rate changes in SME neurons
In aggregate, SME neurons exhibited significantly greater FR for successfully recalled items (Fig. 5a, * p < 0.001, two-sided sign test). In a time-resolved comparison (Fig. 5b), SME neurons showed a higher FR during SR across encoding as compared to both (1) UR of SME neurons (two-sided sign test) and (2) all recalled and non-recalled events of NonSME neurons (two-sided rank-sum test, p < 0.01, cluster level corrected with the minimum cluster size of five windows).
Fig. 5.
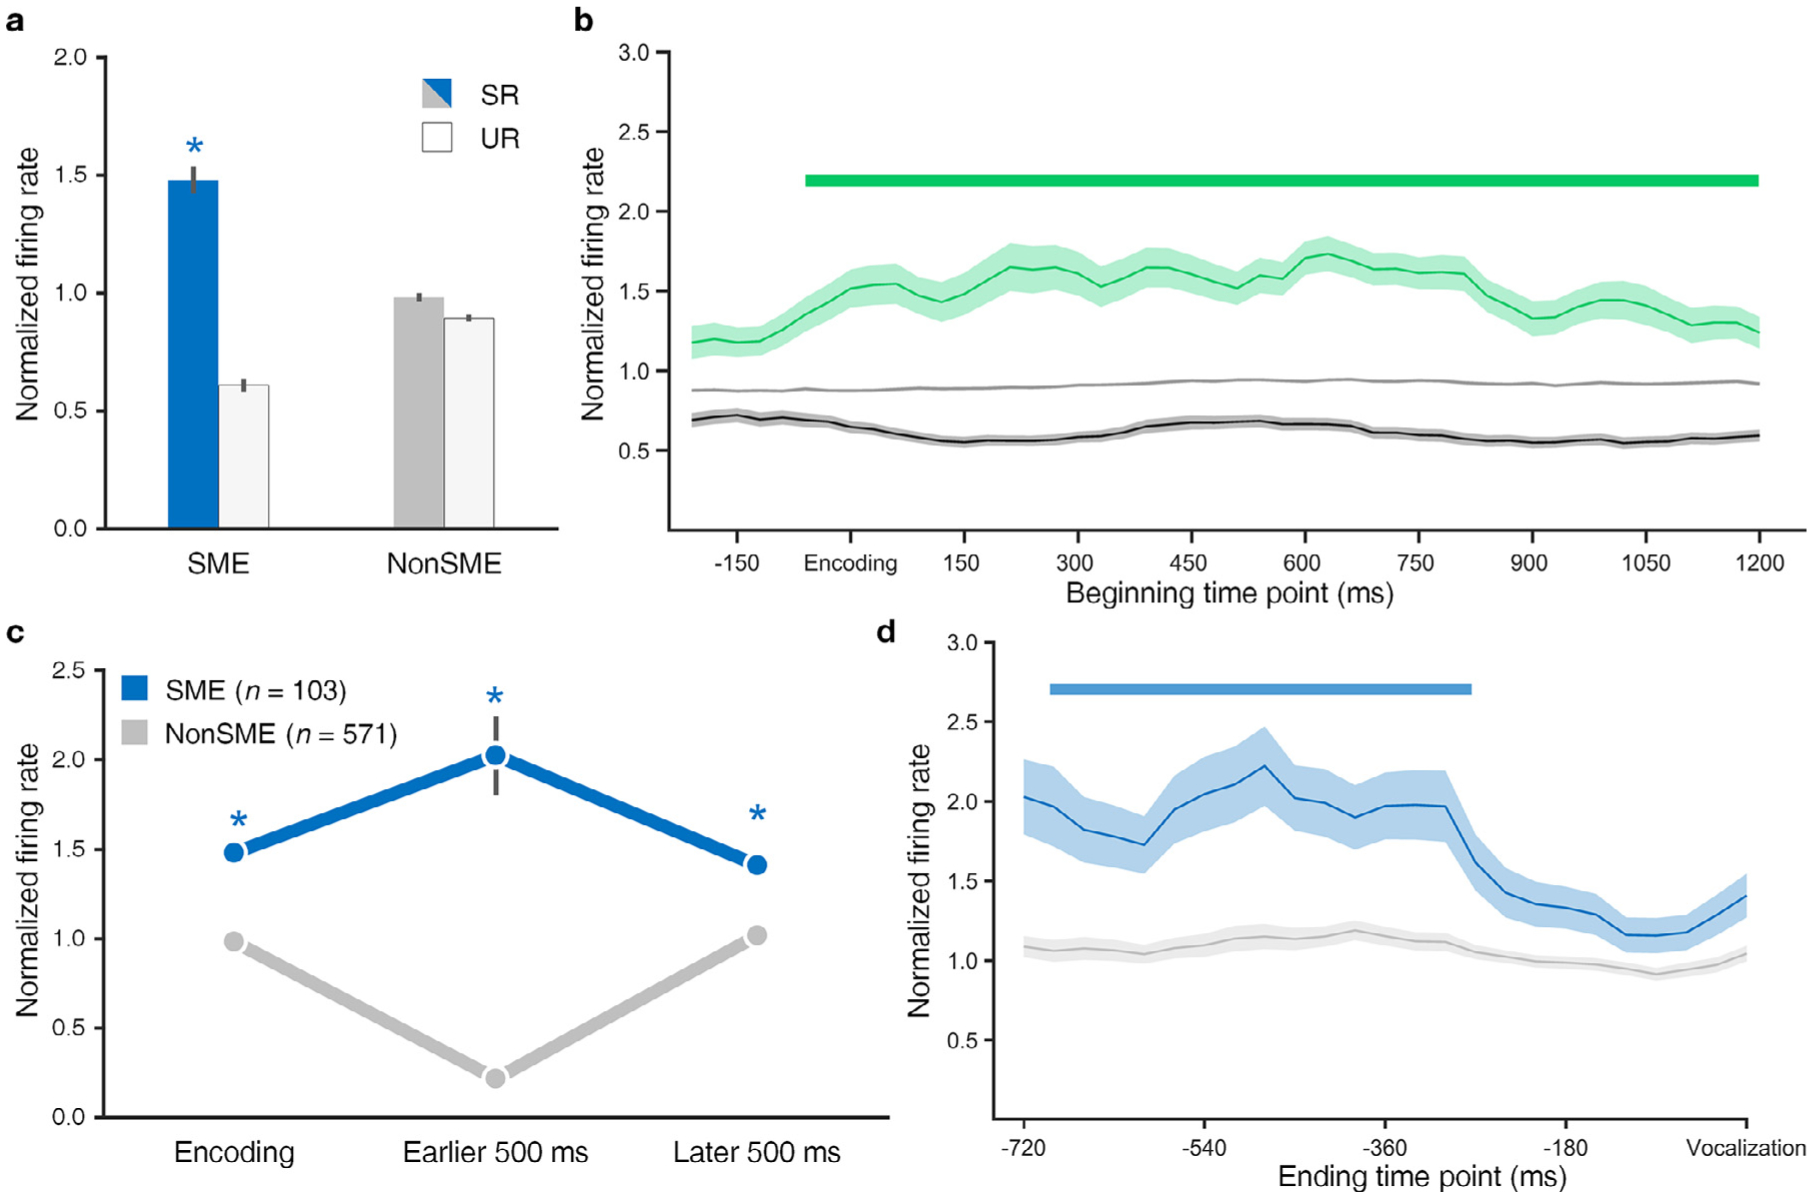
Firing rate differences in SME and NonSME neurons during memory encoding and retrieval. a, Average normalized FR across SME vs NonSME neurons for recalled and non-recalled events. Error bars represent the SEM. Stars indicate significantly higher firing rate (FR) in successfully recalled (SR) compared to unsuccessfully recalled (UR) (p < 0.001). b, Average normalized FR of SME cells for successfully recalled (shaded green) and successfully recalled items (shaded black) events. Gray line in the middle shows average firing rate of NonSME neurons during all encoding events as a contrast. Green bar highlights when FR of SME meets two conditions: (i) it is significantly higher in SR (shaded green line) than UR (shaded dark gray line) events (p < 0.01, sign test, cluster level corrected), (ii) it is significantly higher in SR than the average FR of NonSME (non-shaded light gray line) in all encoding events (p < 0.01, rank-sum test, cluster level corrected). Note that the x-axis indicates the beginning time point of each sliding window, and 0 ms corresponds to encoding. For example, the first beginning time point in encoding corresponds to 210 ms prior to stimulus. c, Average normalized FR of SME (blue) and NonSME (gray) cells for successfully recalled items (left), the first half of the 1000 ms retrieval window preceding vocalization (middle) and the latter half (right) of paired recalled items. SME cells demonstrate significantly higher normalized FR in all periods (p < 0.05, rank-sum test). d, Normalized FR of SME (blue) and NonSME (gray) cells preceding recall vocalization (analogous to c with more temporal detail). Blue bar highlights when FR of SME is significantly higher than that of NonSME during retrieval (p < 0.01, rank-sum test, cluster level corrected). Note that the x-axis indicates the ending time point of each sliding window, and 0 ms corresponds to vocalization.
In our free recall paradigm, memory retrieval occurred within a 30 or 45 s period when no stimuli appeared on the screen and subjects vocalized items remembered from the immediately preceding list. We analyzed 1000-ms time windows preceding the vocalization of retrieved memory items, limiting our analysis to retrieval events that were sufficiently temporally isolated from others to avoid effects of vocalization (Manning et al., 2011; Burke et al., 2014a; Tan et al., 2020). As a result, between 5 and 112 (median 27) paired items were used for reinstatement analyses among SME and NonSME neurons. Compared to NonSME, SME neurons showed greater FR during retrieval for the entire 1000 ms period (Fig. 5c, * p < 0.05, two-sided rank-sum test). A time-resolved examination of the temporal dynamics of SME neurons’ activity (Fig. 5d) found that FR of SME neurons is highest around 500 ms prior to vocalization (two-sided rank-sum test, p < 0.01, cluster level corrected with the minimum cluster size of five windows), when it is significantly greater than the FR of NonSME neurons. The difference in FR during retrieval is noteworthy because SME neurons are defined entirely based on properties observed during item encoding, so the greater FR during retrieval is somewhat expected but not a trivial result of how the neurons are assigned to SME versus NonSME groups.
3.4. SME neurons reinstate encoding at retrieval in firing rate
We measured reinstatement of FR patterns between encoding and retrieval via Euclidean distance (Manns and Eichenbaum, 2009; Jacob and Nieder, 2014; Spaak et al., 2017). Fig. 6f provides an example SME neuron demonstrating similarity in FR between encoding and retrieval across 17 successfully recalled and paired memory items. Reinstatement in SME neurons was greater than expected by chance (Fig. 6a, shuffled p = 0.026, 1,000 shuffles, comparison of true reinstatement values for paired events with similarity from shuffled encoding and retrieval events). This result remains significant when downsampling retrieval events to an equal number for all neurons (Fig. S3). We investigated the temporal dynamics of reinstatement by separating the 1000 ms retrieval window into earlier and later halves. This analysis showed significant reinstatement (over chance) occurs not in the earlier 500 ms (Fig. 6b, shuffled p = 0.424, 1,000 shuffles), but specifically in the later 500 ms time window (Fig. 6c, shuffled p = 0.030, 1,000 shuffles). We repeated this analysis with greater temporal detail using a sliding windows approach incorporating 300-ms-long windows with 270 ms overlap (illustrated in Fig. 6d). Within each window, we compared real versus random reinstatement values in SME neurons and identified time points with significant differences using a two-dimensional cluster correction (Fig. 6e). We found the significant (largest) cluster during the final 510 ms preceding vocalization of recalled items, a box highlighted in white shadow in Fig. 6e.
Fig. 6.
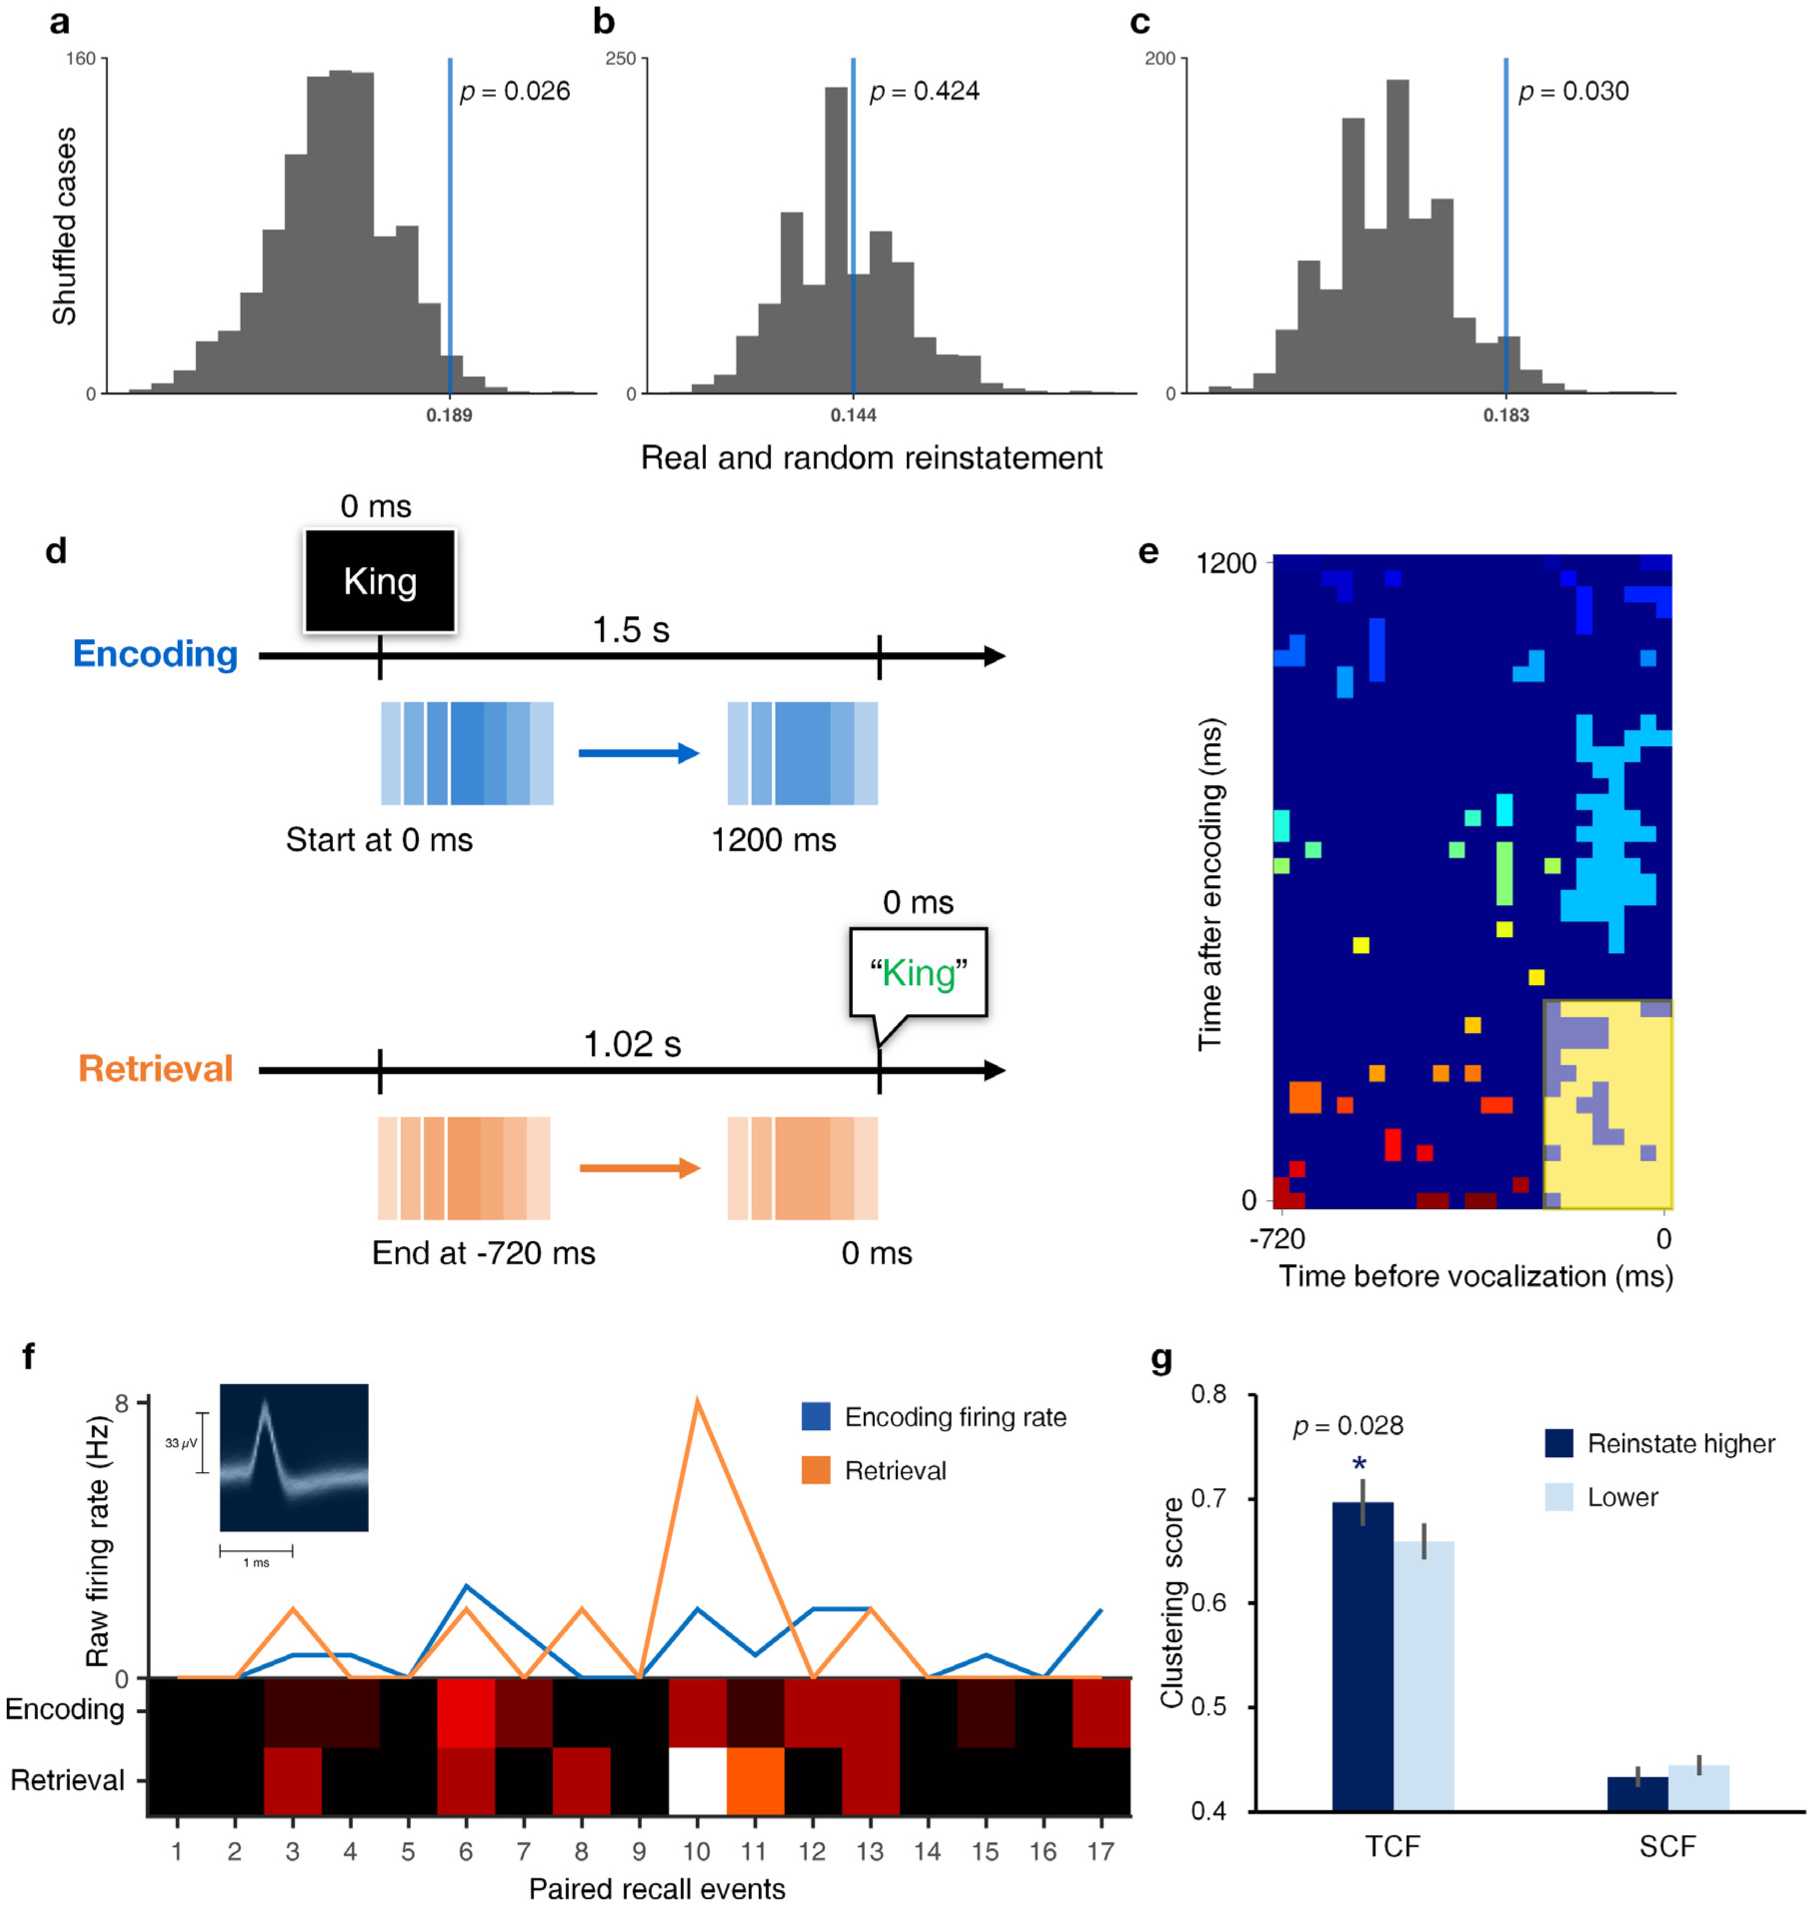
SME cell activity reinstatement is significant and correlates with temporal clustering of memories. a, True reinstatement magnitude of SME neurons versus shuffled distribution using entire 1000 ms period prior to vocalization of recalled items (shuffled p = 0.026). b and c reflect the same analysis for the earlier and later 500 ms windows (shuffled p = 0.424, p = 0.030 respectively). d, Illustration of sliding windows approach for calculation of reinstatement magnitude. The 0 ms means when a word is present in encoding, and when an encoded word was vocalized in retrieval. e, Two-dimensional cluster correction for reinstatement over chance (shuffled p < 0.1, minimum cluster size = 5 × 5). Highlighted window spans from 510 ms prior to recollection (vocalization) where ticks denote ending points on x-axis and beginning points on y-axis of sliding windows. Colors represent the different clusters with p-values lower than 0.1 after comparing the real reinstatement value in SME to 1,000 randomized. Squares are highlighted if they were part of the largest cluster after cluster level correction with the threshold value of p < 0.1 out of all (41 × 25 = 1025 reinstatement values). f, An example SME neuron (inset provides its mean spike waveform) that shows the reinstatement between encoding and later 500 ms of retrieval (“Retrieval”) across 17 paired recalled events. g, Comparison of temporal and semantic clustering behavior associated with SME cells demonstrating high (dark blue) and low (light blue) reinstatement during later retrieval. Bar height represents the mean and error bars the SEM. Star indicates a significant difference (rank-sum test, one-sided p < 0.05) in temporal clustering between high (n = 53) and low (n = 50) reinstating neurons during later retrieval.
3.5. Reinstatement magnitude is correlated with temporal clustering in SME neurons
We hypothesized that magnitudes of reinstatement between encoding and later retrieval (500 ms preceding vocalization) would predict temporal clustering behavior based on previous findings in humans within Manning et al. (2011). Both temporal and semantic clustering scores were calculated using all recalled items prior to filtering retrieval events according to temporal isolation (see Methods 2.3). We compared the temporal clustering values (TCF) between high versus low reinstatement groups using a median split approach as described in Methods (n = 50 for lower TCF, n = 53 for TCF greater than or equal to the median of 0.183). Results show that greater reinstatement of encoding-related activity is associated with increased temporal clustering behavior, as shown in Fig. 6g (rank-sum test, one-sided p = 0.028). This result was also significant using Spearman’s correlation (r = 0.169, one-sided p = 0.044, df = 101), and remained significant when we applied a partial correlation controlling for overall subject performance (r = 0.246, one-sided p = 0.006, df = 100) and the ratio of paired primacy items used for reinstatement calculations (r = 0.219, one-sided p = 0.013, df = 100). By contrast, we did not find that semantic clustering behavior (SCF) is associated with reinstatement magnitudes (Fig. 6g, rank-sum test, one-sided p = 0.927), supporting a link between reinstatement and temporal contextual information specifically.
3.6. SME neurons exhibit spike-field coherence in the slow theta band
We calculated spike-field coherence (SFC) across the 0–70 Hz frequency spectrum to measure phase locking and compared the resulting values between SR and UR events. We found that phase locking in SME neurons was significantly higher (shuffled p < 0.05, 10,000 shuffles) in SR than UR below 5 Hz, after cluster level correction using threshold of Cohen’s d = 0.2 and the minimum cluster size of five bins (Fig. 7). We also confirmed that the magnitude of phase locking in this frequency range is greater for SR items than chance, comparing SFC from spikes in SR versus SFC calculated from random time segments (shuffled p < 0.0001, 10,000 shuffles). This frequency range is consistent with “slow theta” (2–5 Hz) oscillations that exhibit properties such as power increases, phase amplitude coupling, and intra-hippocampal coherence during free recall (Lega et al., 2016), as well as other human investigations of single unit activity (Rutishauser et al., 2010; Foster et al., 2013; Watrous et al., 2018). Based on this finding, we tested whether phase locking occurs at consistent theta phase values across SME neurons. However, when we aggregated the mean phases from all SME neurons (for successfully recalled items), we did not observe consistent clustering of phase values (Rayleigh Z test, p = 0.48, Fig. 7 inset), indicating phase locking occurs at different phases across SME neurons.
Fig. 7.
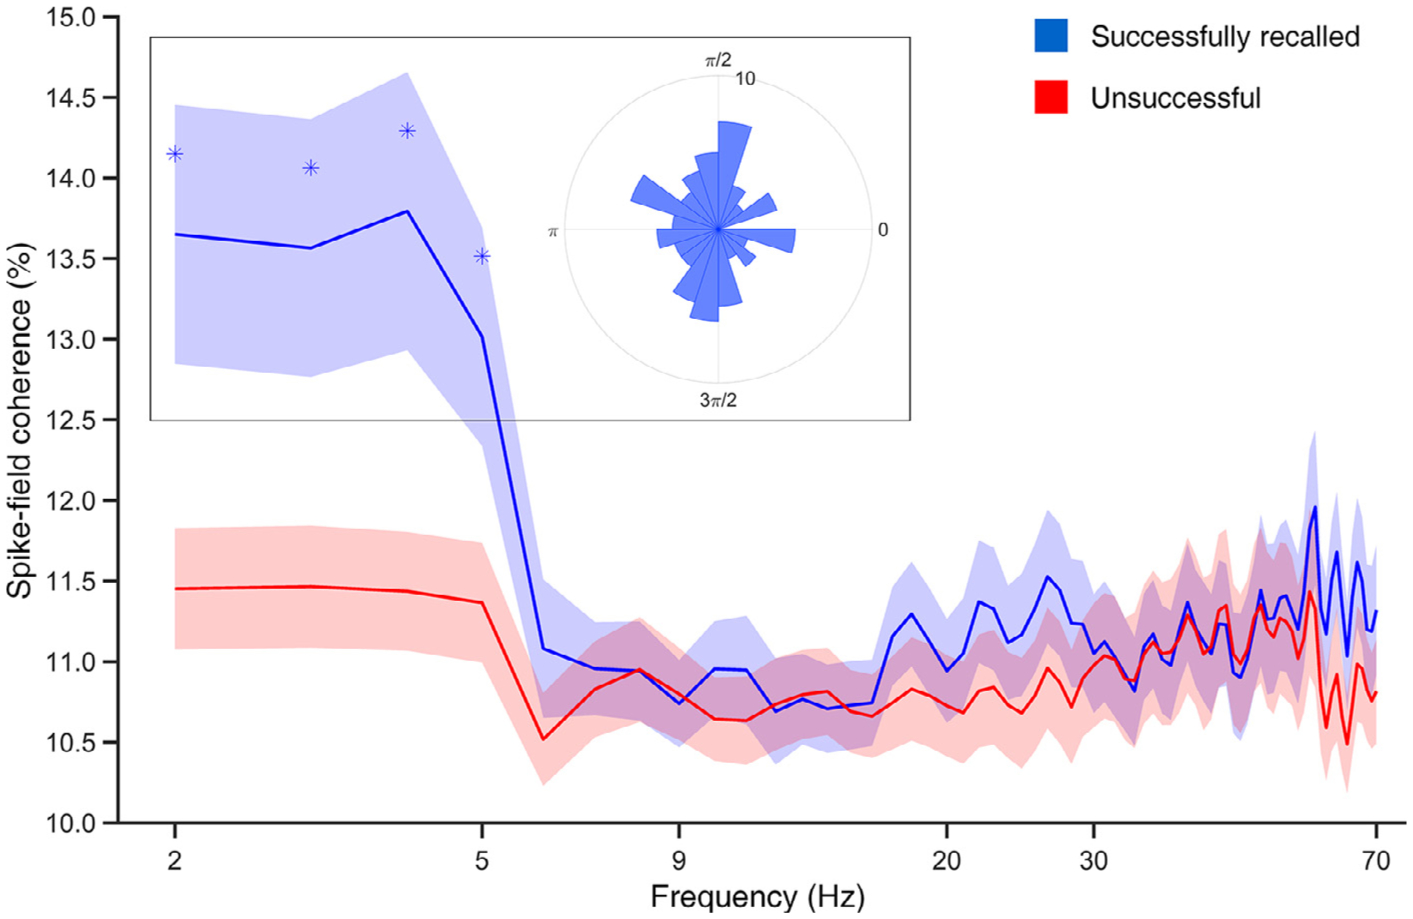
Spike-field coherence is higher for successfully than unsuccessfully recalled items in SME neurons at < 5 Hz. SFC curves describing phase locking of spikes observed in SME neurons during successful (blue) and unsuccessful (red) encoding (Cohen’s d = 0.2, minimum cluster size = 5). The x-axis demonstrates log-spaced frequency in 2–70 Hz. The inset demonstrates the aggregate of all SME neurons’ SR phases averaged per neuron at 2–5 Hz.
3.7. Phase of SME neuron spiking distinguishes memory encoding versus retrieval
We sought to test a prediction of a key computational model of episodic memory processing, the “Separate Phases at Encoding And Retrieval (SPEAR)” model articulated by Hasselmo et al. (2002). Given the memory-related phase locking we observed in SME neurons in the slow theta (2–5 Hz) frequency range, we compared the phase at which spiking occurred during item encoding versus retrieval in this band. Based on SPEAR, we hypothesized that these phases would be significantly different. To avoid the effect of bursting activity, we averaged phase values (within each neurons) for spikes separated from others by at least 25 ms (Lisman, 1997), and to limit the number of comparisons we used phase information for the predominant frequency within the slow theta (2–5 Hz) range using an oscillation detection routine (see Methods 2.11). As shown in Fig. 8a, the mean phase offset between encoding and retrieval was 98° (Rayleigh Z test, p = 0.013), and the mean was significantly different from 0° (circ_mtest against 0) in SME group. We verified this result using a permutation procedure in which we circularly rotated the spike times while preserving the inter-spike intervals (Fig. 8b left, p = 0.016, 1,000 shuffles). This encoding versus retrieval distinction via phase offset was specific to SME neurons, as the phase offset was not significantly consistent for NonSME neurons (Rayleigh Z test, p = 0.947). We compared the consistency of phase offset directly between SME and NonSME neurons using a shuffle procedure, which confirmed this finding (Fig. 8b right, p = 0.005, 10,000 shuffles). These results remained significant when we restricted our analysis to spikes from SME neurons occurring during the later 500 ms of the retrieval period during which we observed significant reinstatement effects (Fig. 8c,d), as well as when we restricted our analysis to only hippocampal neurons (excluding non-hippocampal MTL neurons, see Fig. S4).
Fig. 8.
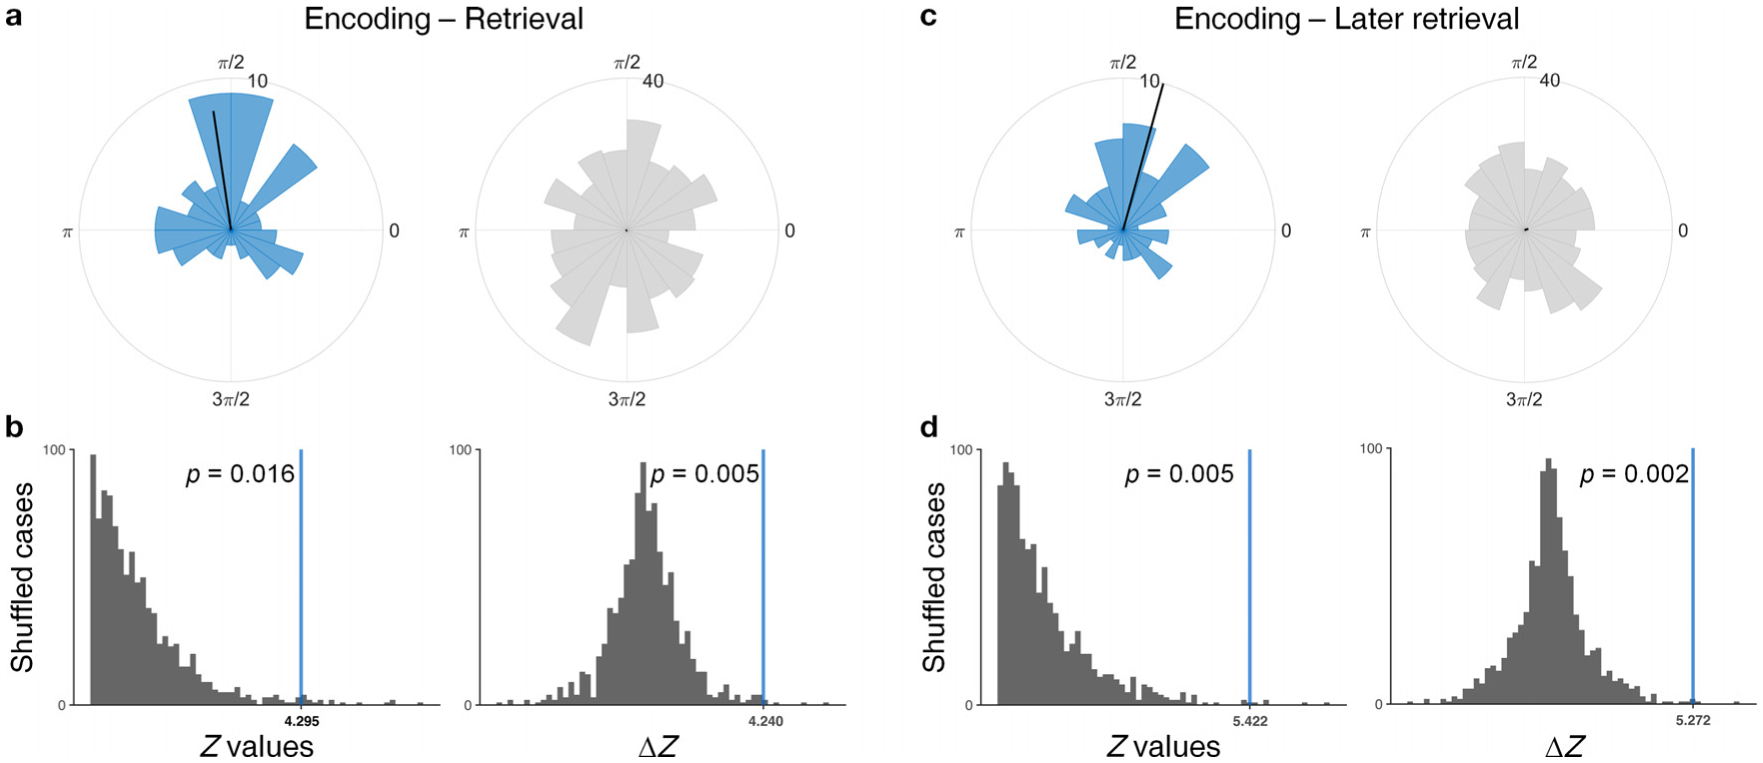
SME cell spike phase distinguishes between encoding and retrieval in the slow theta (2–5 Hz) band. a, Polar histogram highlighting the consistency of phase differences between encoding and retrieval at slow theta (2–5 Hz) for SME (left, blue) and NonSME (right, gray) cells. Note that the bar scale is four times larger in NonSME. Black solid lines on the polar histogram indicate the mean phase and their lengths correspond to the relative Rayleigh Z value, which reflects the magnitude of phase difference consistency compared to that of c. The histogram for SME group (blue) contains 75 neurons, and NonSME group (gray) contains 420 neurons. b, Shuffle test verifying that the consistency of condition-dependent phase differences is significantly above chance in SME (left), and that the level of consistency in SME is significantly higher than NonSME (right). c, Polar histogram highlighting the consistency of phase differences between encoding and spikes occurring during the 500 ms immediately before vocalization. The histogram for SME group (blue) contains 61 neurons, and NonSME group (gray) contains 364 neurons. d, Shuffle test as in b, but for the latter time window prior to vocalization.
3.8. AntiSME neurons
AntiSME neurons exhibiting reduced FR for successfully recalled items were a smaller proportion out of those identified in the MTL (n = 39 out of 713). This population of neurons did not exhibit reinstatement of FR activity over chance at later retrieval (shuffled p = 0.648, 1,000 shuffles). Nor did they demonstrate consistent phase offset between encoding and retrieval when we circularly rotated the spike times and quantified Rayleigh Z scores with the later retrieval time window (p = 0.113, 1,000 shuffles). While these findings corroborate the unique characteristics of SME neurons, we acknowledge that a conclusion in this regard is limited by the small number of AntiSME neurons identified and that future investigations may be needed to fully characterize their properties.
4. Discussion
Using single neuron recordings from 27 human subjects performing the free recall task, we identified 103 SME neurons in the hippocampus and entorhinal cortex with firing rate properties sensitive to encoding success. We found that the spiking activity pattern of SME neurons reinstates at the time of memory retrieval, and that the magnitude of reinstatement predicted temporal clustering behavior. SME neurons also exhibited significant phase locking relative to the 2–5 Hz theta oscillation during item encoding, consistent with previous findings in humans. Finally, spike phases of these neurons at 2–5 Hz theta shifted between periods of item encoding versus retrieval, consistent with predictions of the SPEAR model.
A centerpiece of the temporal context model (TCM) is that reinstatement of neural activity allows the brain to “jump back in time” to facilitate the recall of specific memory items (Howard and Kahana, 2002; Howard et al., 2012). Our results showed that the reinstatement in SME neuron activity especially occurred during the later temporal window of the retrieval period (immediately preceding item vocalization). The timing of reinstatement is in line with previous studies that used oscillatory activity recorded from macroelectrodes, which reported neurophysiological evidence of reinstatement beginning around 600 ± 100 ms prior to recollection (Manning et al., 2011; Lega et al., 2012; Solomon et al., 2019). It is also noteworthy that retrieval-related firing rate was significantly higher in SME than NonSME neurons during the earlier temporal window within retrieval (Fig. 5d). Together the results are consistent with previous studies showed that there are multiple temporally-delineated processes that interact to support recollection (Lega et al., 2012; Solomon et al., 2019), potentially including memory search (indicated by FR elevation) prior to representation of a recollected item (indicated by reinstatement).
The link between the magnitude of reinstatement and temporal clustering behavior (Fig. 6g) suggests a neuron-level mechanism for the representation of temporal contextual information in memory-sensitive neurons (Howard and Kahana, 2002; Kahana et al., 2008). Previous microelectrode data supporting TCM utilized population-level neural dynamics or task-sensitive neurons to show reinstatement of activity patterns (Howard et al., 2012; Folkerts et al., 2018). Similarly using intracranial macroelectrodes, Manning et al. (2011) and El-Kalliny et al. (2019) found that spectrum-wide LFP patterns predict temporal clustering. These analyses modeled “drift,” or changes in aggregate patterns of activity over the scale of seconds to minutes. On the other hand, we identify single neurons (SME neurons) that rate-code successful recall and show that these functionally defined neurons (but not other groups) demonstrate properties consistent with TCM. Explicating the relative contribution of specific classes of memory-sensitive neurons versus aggregate autocorrelated activity towards the representation of contextual information requires further investigation. To note, Staresina et al. (2019) reported the reinstatement of population activity during source memory, although a subsequent analysis using a modified paradigm failed to identify memory-sensitive neurons that additionally code for associated source memory (Derner et al., 2020). This is at odds with our data, although the number of possible associations in the source task may have overwhelmed any ability to test for association-sensitive units in a study with only five subjects.
Reinstatement magnitudes of SME neurons predicted temporal but not semantic associative behavior. This may be in part due to the nature of free recall, which makes specific demands on temporal contextual information. Neuronal activity may show a more consistent relationship with semantic clustering in a task such as categorized free recall (Long and Kahana, 2017; Weidemann et al., 2019). Alternatively, this finding may entail that semantic associations require activity outside of the MTL, potentially in temporal and prefrontal cortices (Long et al., 2010; Manning et al., 2012). The incorporation of joint lateral and medial temporal microelectrode recordings may help explicate such issues. Finally, Long and Kahana (2017) reported that neural activity linked with semantic clustering interferes with creating new episodic associations, which may be consistent with our reported findings.
Another question raised by our findings is related to the timing of reinstatement in SME neurons. While a connection between reinstatement and temporal context is broadly consistent with the predictions of TCM, one important caveat is that a strict interpretation of the model would predict that temporal context should act as a retrieval cue, which seems to suggest that reinstatement of physiological activity linked with context should occur relatively earlier compared to item-related information (and vocalization). Nevertheless, we found that activity in the later retrieval period rather than earlier is correlated with temporal contextual representation. One possible explanation is that temporal context representations acting as retrieval cues occur initially in the cortex, and such activity is then reflected in hippocampal spiking (sparsely) when pattern completion occurs (Horner et al., 2015). However, we note that Vaz et al. (2020) showed that single neuron activity in the MTL precedes that in the lateral temporal cortex prior to successful associative recall. Other regions, such as medial parietal areas, may ultimately be more favorable candidates for such “cue” representations of contextual information, analogous to “schema” information in scene construction (Ritchey and Cooper, 2020). We also note that the FR of SME neurons is higher earlier in time (Fig. 5d), prior to the period when reinstatement of activity patterns seen at encoding occurs. We speculate that this may be consistent with earlier “memory search” followed by pattern completion, an idea supported by the correlation between reinstatement during this period and temporal clustering behavior.
Our data suggest an electrophysiological mechanism (phase shift) for differentiating the temporal context being reinstated (associated with the recalled items) from the immediate context experienced by the brain at the time of retrieval. The SPEAR model articulated by Hasselmo et al. (2002) suggests that the theta phase at which spiking occurs in retrieval shifts away from phases more propitious for long-term potentiation in encoding. Experimental evidence in rodents supports this model by showing changes of the slope of long-term potentiation between different theta phases in CA1 (Hyman et al., 2003), phase offsets between encoding and retrieval in CA1 (Manns et al., 2007), and differences in the peak timing of gamma power coinciding with transitions between encoding and retrieval periods and theta phases (Colgin and Moser, 2009). Our human data seem to support SPEAR. We first observed significant spike-field coherence at the 2–5 Hz “slow theta” frequency band that predicts encoding success in SME neurons. The same band is also highlighted in Rutishauser et al. (2010) and Hyman et al. (2010) as well as publications identifying mnemonically-relevant activity specifically in this frequency range (Lin et al., 2017). We provide additional evidence for the importance of this oscillation relative to the SPEAR model. However, we note that SPEAR predicts that encoding versus retrieval phase differences should converge around 180° (Hasselmo et al., 2002; Kunec et al., 2005) due to the opposite preferred theta phases for long-term potentiation versus depression (Pavlides et al., 1988; Wyble et al., 2000; Orr et al., 2001; Hyman et al., 2003). Our data are not entirely consistent with this prediction, as the mean phase offset we observed was approximately 90°. Such a phase offset value is however consistent with Manns et al. (2007) who reported phase offset (12.3–91.7°) smaller than model-predicted values of 180°. An updated version of the SPEAR model (Judge and Hasselmo, 2004) posits that the optimal long-term potentiation at Schaffer collateral (projecting from CA3 to CA1) synapses occurs slightly out of phase relative to the input phase of information arriving from the entorhinal cortex (rather than a lag of precisely 0°). This suggests that the magnitude of long-term potentiation maximizes across a range of phases instead so that the observed phase offset may be less than 180°.
We utilized a verbal free recall task because compared to item-level associations incorporated in previous human single unit electrophysiology studies, the data represented by SME neurons during free recall provide information more specifically pertaining to temporal contextual representations. Future investigations employing alternative paradigms, such as categorized free recall or repeated free recall (in which items are repeated across lists), can provide data capable of dissociating item-level (semantic) information versus contextual information. Likewise, the establishment of larger datasets, with subjects that provide a larger number of list intrusions, would allow us to address important questions such as how the representation of temporal context in SME neurons changes when the retrieval of appropriate temporal context fails but a retrieval attempt is made (for a discussion of the interpretation of list intrusions, please see Tan et al. (2020)). We also note that a limitation of free recall is the lack of control over the precise timing of retrieval-related activity, and therefore identifying common patterns of SME neurons across both associative recognition (Kota et al., 2020) and free recall paradigms would provide important additional information regarding the behavior of SME neurons.
Another drawback of a verbal free recall task is that due to the uncontrolled pace of vocalizations, it is necessary to eliminate some events from analysis. However, in our data this did not change the overall distribution of events across serial positions (see Fig. S1). We also acknowledge that the likelihood of individuals to preferentially recall the first item in a list (primacy recall) can impact measures of temporal clustering behavior (Hogan, 1975), although in our data this did not affect the association with reinstatement magnitude. Additional experimentation using longer and variable item lists may be needed to overcome this potential issue.
This study shares the underlying microelectrode recordings used in Umbach et al. (2020) but with a different focus on memory-sensitive cells instead of time-sensitive ones examined in the previous study. SME neurons (current study) and time cells (Umbach et al., 2020) represent two independent types of information. There were some overlaps in these neuron groups because of the behavioral tendency to encode the earlier serial positions more preferably (primacy effect). However, the SME neurons primarily showed selective rate-coding for successful over unsuccessful memory regardless of serial positions (subjective time). Neurons that predicted sensitivity for encoding success significantly better than time flow were excluded from the definition of time cells in our previous work.
Supplementary Material
Acknowledgments
We sincerely appreciate the subjects volunteered for this study. We are grateful to Dr. Michael Sperling and Dr. Ash Sharan of Thomas Jefferson University Hospital for their work in data collection. This study was supported by grants R01NS125250 and R01NS106611 from NIH.
Abbreviation:
- MTL
Medial Temporal Lobe
Footnotes
Ethics statement
The IRBs from both Thomas Jefferson University Hospital and University of Texas Southwestern approved this study. Each subject provided written consent at their respective institution.
Declaration of Competing Interest
The authors report no conflict of interest.
Credit authorship contribution statement
Hye Bin Yoo: Conceptualization, Methodology, Formal analysis, Writing – original draft, Writing – review & editing. Gray Umbach: Conceptualization, Methodology, Writing – review & editing. Bradley Lega: Conceptualization, Supervision, Project administration, Funding acquisition, Writing – review & editing.
Supplementary materials
Supplementary material associated with this article can be found, in the online version, at doi:10.1016/j.neuroimage.2021.118689.
Data and code availability statement
The analysis was performed using Python and MATLAB codes provided in Combinato (https://github.com/jniediek/combinato), EEG Toolbox written in the University of Pennsylvania (http://memory.psych.upenn.edu/Software), CircStat (https://github.com/circstat/circstat-matlab) and Chronux (http://chronux.org), which are freely available. The data are not publicly available due to privacy or ethical restrictions. The corresponding author, Bradley Lega (Bradley.Lega@utsouthwestern.edu) will approve for sharing the data and custom-made codes implemented for this study upon request, after completion of a data sharing agreement.
References
- Berens P, 2009. CircStat: aMATLABToolbox for Circular Statistics. J. Stat. Softw 31 (10), 1–21. [Google Scholar]
- Burke JF, Long NM, Zaghloul KA, Sharan AD, Sperling MR, Kahana MJ, 2014a. Human intracranial high-frequency activity maps episodic memory formation in space and time. Neuroimage 85 Pt 2, 834–843. [DOI] [PMC free article] [PubMed] [Google Scholar]
- Burke JF, Sharan AD, Sperling MR, Ramayya AG, Evans JJ, Healey MK, Beck EN, Davis KA, Lucas TH, Kahana MJ, 2014b. Theta and high-frequency activity mark spontaneous recall of episodic memories. J. Neurosci 34 (34), 11355–11365. [DOI] [PMC free article] [PubMed] [Google Scholar]
- Burke JF, Zaghloul KA, Jacobs J, Williams RB, Sperling MR, Sharan AD, Kahana MJ, 2013. Synchronous and asynchronous theta and gamma activity during episodic memory formation. J. Neurosci 33 (1), 292–304. [DOI] [PMC free article] [PubMed] [Google Scholar]
- Colgin LL, Denninger T, Fyhn M, Hafting T, Bonnevie T, Jensen O, Moser MB, Moser EI, 2009. Frequency of gamma oscillations routes flow of information in the hippocampus. Nature 462 (7271), 353–357. [DOI] [PubMed] [Google Scholar]
- Colgin LL, Moser EI, 2009. Hippocampal theta rhythms follow the beat of their own drum. Nat. Neurosci 12 (12), 1483–1484. [DOI] [PubMed] [Google Scholar]
- Cramér H, 1999. Mathematical Methods of Statistics. Princeton University Press. [Google Scholar]
- Davidson TJ, Kloosterman F, Wilson MA, 2009. Hippocampal replay of extended experience. Neuron 63 (4), 497–507. [DOI] [PMC free article] [PubMed] [Google Scholar]
- Derner M, Dehnen G, Chaieb L, Reber TP, Borger V, Surges R, Staresina BP, Mormann F, Fell J, 2020. Patterns of single-neuron activity during associative recognition memory in the human medial temporal lobe. Neuroimage 221, 117214. [DOI] [PubMed] [Google Scholar]
- El-Kalliny MM, Wittig JH, Sheehan TC, Sreekumar V, Inati SK, Zaghloul KA, 2019. Changing temporal context in human temporal lobe promotes memory of distinct episodes. Nat. Commun 10 (1), 203. [DOI] [PMC free article] [PubMed] [Google Scholar]
- Ezzyat Y, Kragel JE, Burke JF, Levy DF, Lyalenko A, Wanda P, O’Sullivan L, Hurley KB, Busygin S, Pedisich I, Sperling MR, Worrell GA, Kucewicz MT, Davis KA, Lucas TH, Inman CS, Lega BC, Jobst BC, Sheth SA, Zaghloul K, Jutras MJ, Stein JM, Das SR, Gorniak R, Rizzuto DS, Kahana MJ, 2017. Direct brain stimulation modulates encoding states and memory performance in humans. Curr. Biol 27 (9), 1251–1258. [DOI] [PMC free article] [PubMed] [Google Scholar]
- Faraut MCM, Carlson AA, Sullivan S, Tudusciuc O, Ross I, Reed CM, Chung JM, Mamelak AN, Rutishauser U, 2018. Dataset of human medial temporal lobe single neuron activity during declarative memory encoding and recognition. Sci. Data 5, 180010. [DOI] [PMC free article] [PubMed] [Google Scholar]
- Folkerts S, Rutishauser U, Howard MW, 2018. Human episodic memory retrieval is accompanied by a neural contiguity effect. J. Neurosci 38 (17), 4200–4211. [DOI] [PMC free article] [PubMed] [Google Scholar]
- Foster BL, Kaveh A, Dastjerdi M, Miller KJ, Parvizi J, 2013. Human retrosplenial cortex displays transient theta phase locking with medial temporal cortex prior to activation during autobiographical memory retrieval. J. Neurosci 33 (25), 10439–10446. [DOI] [PMC free article] [PubMed] [Google Scholar]
- Fries P, Reynolds JH, Rorie AE, Desimone R, 2001. Modulation of oscillatory neuronal synchronization by selective visual attention. Science 291 (5508), 1560–1563. [DOI] [PubMed] [Google Scholar]
- Fries P, Roelfsema PR, Engel AK, Konig P, Singer W, 1997. Synchronization of oscillatory responses in visual cortex correlates with perception in interocular rivalry. Proc. Natl. Acad. Sci. U. S. A 94 (23), 12699–12704. [DOI] [PMC free article] [PubMed] [Google Scholar]
- Gelbard-Sagiv H, Mukamel R, Harel M, Malach R, Fried I, 2008. Internally generated reactivation of single neurons in human hippocampus during free recall. Science 322 (5898), 96–101. [DOI] [PMC free article] [PubMed] [Google Scholar]
- Goyal A, Miller J, Qasim SE, Watrous AJ, Zhang H, Stein JM, Inman CS, Gross RE, Willie JT, Lega B, Lin JJ, Sharan A, Wu C, Sperling MR, Sheth SA, McKhann GM, Smith EH, Schevon C, Jacobs J, 2020. Functionally distinct high and low theta oscillations in the human hippocampus. Nat. Commun 11 (1), 2469. [DOI] [PMC free article] [PubMed] [Google Scholar]
- Goyal A, Miller J, Watrous AJ, Lee SA, Coffey T, Sperling MR, Sharan A, Worrell G, Berry B, Lega B, Jobst BC, Davis KA, Inman C, Sheth SA, Wanda PA, Ezzyat Y, Das SR, Stein J, Gorniak R, Jacobs J, 2018. Electrical stimulation in hippocampus and entorhinal cortex impairs spatial and temporal memory. J. Neurosci 38 (19), 4471–4481. [DOI] [PMC free article] [PubMed] [Google Scholar]
- Hartigan JA, Hartigan PM, 1985. The dip test of unimodality. Ann. Stat 13 (1), 70–84. [Google Scholar]
- Hasselmo ME, Bodelon C, Wyble BP, 2002. A proposed function for hippocampal theta rhythm: separate phases of encoding and retrieval enhance reversal of prior learning. Neural Comput. 14 (4), 793–817. [DOI] [PubMed] [Google Scholar]
- Hogan RM, 1975. Interitem encoding and directed search in free recall. Mem. Cogn 3 (2), 197–209. [DOI] [PubMed] [Google Scholar]
- Horner AJ, Bisby JA, Bush D, Lin WJ, Burgess N, 2015. Evidence for holistic episodic recollection via hippocampal pattern completion. Nat. Commun 6 (1), 7462. [DOI] [PMC free article] [PubMed] [Google Scholar]
- Howard MW, Kahana MJ, 2002. A distributed representation of temporal context. J. Math. Psychol 46 (3), 269–299. [Google Scholar]
- Howard MW, Viskontas IV, Shankar KH, Fried I, 2012. Ensembles of human MTL neurons “jump back in time” in response to a repeated stimulus. Hippocampus 22 (9), 1833–1847. [DOI] [PMC free article] [PubMed] [Google Scholar]
- Hyman JM, Wyble BP, Goyal V, Rossi CA, Hasselmo ME, 2003. Stimulation in hippocampal region CA1 in behaving rats yields long-term potentiation when delivered to the peak of theta and long-term depression when delivered to the trough. J. Neurosci 23 (37), 11725–11731. [DOI] [PMC free article] [PubMed] [Google Scholar]
- Hyman JM, Zilli EA, Paley AM, Hasselmo ME, 2010. Working memory performance correlates with prefrontal-hippocampal theta interactions but not with prefrontal neuron firing rates. Front. Integr. Neurosci 4, 2. [DOI] [PMC free article] [PubMed] [Google Scholar]
- Ison MJ, Mormann F, Cerf M, Koch C, Fried I, Quiroga RQ, 2011. Selectivity of pyramidal cells and interneurons in the human medial temporal lobe. J. Neurophysiol 106 (4), 1713–1721. [DOI] [PMC free article] [PubMed] [Google Scholar]
- Ison MJ, Quian Quiroga R, Fried I, 2015. Rapid encoding of new memories by individual neurons in the human brain. Neuron 87 (1), 220–230. [DOI] [PMC free article] [PubMed] [Google Scholar]
- Jacob SN, Nieder A, 2014. Complementary roles for primate frontal and parietal cortex in guarding working memory from distractor stimuli. Neuron 83 (1), 226–237. [DOI] [PubMed] [Google Scholar]
- Jenkinson M, Bannister P, Brady M, Smith S, 2002. Improved optimization for the robust and accurate linear registration and motion correction of brain images. Neuroimage 17 (2), 825–841. [DOI] [PubMed] [Google Scholar]
- Jenkinson M, Smith S, 2001. A global optimisation method for robust affine registration of brain images. Med. Image Anal 5 (2), 143–156. [DOI] [PubMed] [Google Scholar]
- Judge SJ, Hasselmo ME, 2004. Theta rhythmic stimulation of stratum lacunosum–moleculare in rat hippocampus contributes to associative LTP at a phase offset in stratum radiatum. J. Neurophysiol 92 (3), 1615–1624. [DOI] [PubMed] [Google Scholar]
- Kahana MJ, Howard MW, Polyn SM, 2008. Associative retrieval processes in episodic memory. Psychology 3. [Google Scholar]
- Kamiński J, Brzezicka A, Mamelak AN, Rutishauser U, 2020. Combined phaserate coding by persistently active neurons as a mechanism for maintaining multiple items in working memory in humans. Neuron 106 (2), 256–264.e3. doi: 10.1016/j.neuron.2020.01.032. [DOI] [PMC free article] [PubMed] [Google Scholar]
- Kerren C, Linde-Domingo J, Hanslmayr S, Wimber M, 2018. An optimal oscillatory phase for pattern reactivation during memory retrieval. Curr. Biol 28 (21) 3383–3392 e3386. [DOI] [PubMed] [Google Scholar]
- Kornblith S, Quian Quiroga R, Koch C, Fried I, Mormann F, 2017. Persistent single-neuron activity during working memory in the human medial temporal lobe. Curr. Biol 27 (7), 1026–1032. [DOI] [PMC free article] [PubMed] [Google Scholar]
- Kota S, du Plessis A, Massaro AN, Chang T, Al-Shargabi T, Govindan RB, 2016. A frequency based spatial filter to mitigate volume conduction in electroencephalogram signals. In: Proceedings of the 38th Annual International Conference of the IEEE Engineering in Medicine and Biology Society (EMBC). IEEE. [DOI] [PubMed] [Google Scholar]
- Kota S, Rugg MD, Lega BC, 2020. Hippocampal theta oscillations support successful associative memory formation. J. Neurosci 40 (49), 9507–9518. [DOI] [PMC free article] [PubMed] [Google Scholar]
- Kunec S, Hasselmo ME, Kopell N, 2005. Encoding and retrieval in the CA3 region of the hippocampus: a model of theta-phase separation. J. Neurophysiol 94 (1), 70–82. [DOI] [PubMed] [Google Scholar]
- Landauer TK, Foltz PW, Laham D, 1998. An introduction to latent semantic analysis. Discourse Process. 25 (2–3), 259–284. [Google Scholar]
- Lee SA, Miller JF, Watrous AJ, Sperling MR, Sharan A, Worrell GA, Berry BM, Aronson JP, Davis KA, Gross RE, Lega B, Sheth S, Das SR, Stein JM, Gorniak R, Rizzuto DS, Jacobs J, 2018. Electrophysiological signatures of spatial boundaries in the human subiculum. J. Neurosci 38 (13), 3265–3272. [DOI] [PMC free article] [PubMed] [Google Scholar]
- Lega B, Burke J, Jacobs J, Kahana MJ, 2016. Slow-theta-to-gamma phase-amplitude coupling in human hippocampus supports the formation of new episodic memories. Cereb. Cortex 26 (1), 268–278. [DOI] [PMC free article] [PubMed] [Google Scholar]
- Lega BC, Jacobs J, Kahana M, 2012. Human hippocampal theta oscillations and the formation of episodic memories. Hippocampus 22 (4), 748–761. [DOI] [PubMed] [Google Scholar]
- Lin JJ, Rugg MD, Das S, Stein J, Rizzuto DS, Kahana MJ, Lega BC, 2017. Theta band power increases in the posterior hippocampus predict successful episodic memory encoding in humans. Hippocampus 27 (10), 1040–1053. [DOI] [PMC free article] [PubMed] [Google Scholar]
- Lisman J, 1997. Bursts as a unit of neural information: making unreliable synapses reliable. Trends Neurosci. 20 (1), 38–43. [DOI] [PubMed] [Google Scholar]
- Long NM, Kahana MJ, 2015. Successful memory formation is driven by contextual encoding in the core memory network. Neuroimage 119, 332–337. [DOI] [PubMed] [Google Scholar]
- Long NM, Kahana MJ, 2017. Modulation of task demands suggests that semantic processing interferes with the formation of episodic associations. J. Exp. Psychol. Learn. Mem. Cognit 43 (2), 167. [DOI] [PMC free article] [PubMed] [Google Scholar]
- Long NM, Oztekin I, Badre D, 2010. Separable prefrontal cortex contributions to free recall. J. Neurosci 30 (33), 10967–10976. [DOI] [PMC free article] [PubMed] [Google Scholar]
- Manning JR, Polyn SM, Baltuch GH, Litt B, Kahana MJ, 2011. Oscillatory patterns in temporal lobe reveal context reinstatement during memory search. Proc. Natl. Acad. Sci. U. S. A 108 (31), 12893–12897. [DOI] [PMC free article] [PubMed] [Google Scholar]
- Manning JR, Sperling MR, Sharan A, Rosenberg EA, Kahana MJ, 2012. Spontaneously reactivated patterns in frontal and temporal lobe predict semantic clustering during memory search. J. Neurosci 32 (26), 8871–8878. [DOI] [PMC free article] [PubMed] [Google Scholar]
- Manns JR, Eichenbaum H, 2009. A cognitive map for object memory in the hippocampus. Learn. Mem 16 (10), 616–624. [DOI] [PMC free article] [PubMed] [Google Scholar]
- Manns JR, Zilli EA, Ong KC, Hasselmo ME, Eichenbaum H, 2007. Hippocampal CA1 spiking during encoding and retrieval: relation to theta phase. Neurobiol. Learn. Mem 87 (1), 9–20. [DOI] [PubMed] [Google Scholar]
- Maris E, Oostenveld R, 2007. Nonparametric statistical testing of EEG-and MEG-data. J. Neurosci. Methods 164 (1), 177–190. [DOI] [PubMed] [Google Scholar]
- Milstein J, Mormann F, Fried I, Koch C, 2009. Neuronal shot noise and Brownian 1/f2 behavior in the local field potential. PLoS One 4 (2), e4338. [DOI] [PMC free article] [PubMed] [Google Scholar]
- Mitra P, 2007. Observed Brain Dynamics Oxford University Press. [Google Scholar]
- Mormann F, Kornblith S, Cerf M, Ison MJ, Kraskov A, Tran M, Knieling S, Quian Quiroga R, Koch C, Fried I, 2017. Scene-selective coding by single neurons in the human parahippocampal cortex. Proc. Natl. Acad. Sci. U. S. A 114 (5), 1153–1158. [DOI] [PMC free article] [PubMed] [Google Scholar]
- Murdock BB, 1962. The serial position effect of free recall. J. Exp. Psychol 64 (5), 482. [Google Scholar]
- Niediek J, Bostrom J, Elger CE, Mormann F, 2016. Reliable analysis of single-unit recordings from the human brain under noisy conditions: tracking neurons over hours. PLoS One 11 (12), e0166598. [DOI] [PMC free article] [PubMed] [Google Scholar]
- Orr G, Rao G, Houston F, McNaughton B, Barnes CA, 2001. Hippocampal synaptic plasticity is modulated by theta rhythm in the fascia dentata of adult and aged freely behaving rats. Hippocampus 11 (6), 647–654. [DOI] [PubMed] [Google Scholar]
- Pavlides C, Greenstein YJ, Grudman M, Winson J, 1988. Long-term potentiation in the dentate gyrus is induced preferentially on the positive phase of θ-rhythm. Brain Res 439 (1–2), 383–387. [DOI] [PubMed] [Google Scholar]
- Paz R, Gelbard-Sagiv H, Mukamel R, Harel M, Malach R, Fried I, 2010. A neural substrate in the human hippocampus for linking successive events. Proc. Natl. Acad. Sci. U. S. A 107 (13), 6046–6051. [DOI] [PMC free article] [PubMed] [Google Scholar]
- Polyn SM, Norman KA, Kahana MJ, 2009. A context maintenance and retrieval model of organizational processes in free recall. Psychol. Rev 116 (1), 129–156. [DOI] [PMC free article] [PubMed] [Google Scholar]
- Qasim SE, Miller J, Inman CS, Gross RE, Willie JT, Lega B, Lin JJ, Sharan A, Wu C, Sperling MR, Sheth SA, McKhann GM, Smith EH, Schevon C, Stein JM, Jacobs J, 2019. Memory retrieval modulates spatial tuning of single neurons in the human entorhinal cortex. Nat. Neurosci 22 (12), 2078–2086. [DOI] [PMC free article] [PubMed] [Google Scholar]
- Rey HG, Ison MJ, Pedreira C, Valentin A, Alarcon G, Selway R, Richardson MP, Quiroga RQ, 2015. Single-cell recordings in the human medial temporal lobe. J. Anat 227 (4), 394–408. [DOI] [PMC free article] [PubMed] [Google Scholar]
- Ritchey M, Cooper RA, 2020. Deconstructing the posterior medial episodic network. Trends Cogn. Sci 24 (6), 451–465. [DOI] [PubMed] [Google Scholar]
- Rizzuto DS, Madsen JR, Bromfield EB, Schulze-Bonhage A, Kahana MJ, 2006. Human neocortical oscillations exhibit theta phase differences between encoding and retrieval. Neuroimage 31 (3), 1352–1358. [DOI] [PubMed] [Google Scholar]
- Rutishauser U, Mamelak AN, Schuman EM, 2006. Single-trial learning of novel stimuli by individual neurons of the human hippocampus-amygdala complex. Neuron 49 (6), 805–813. [DOI] [PubMed] [Google Scholar]
- Rutishauser U, Ross IB, Mamelak AN, Schuman EM, 2010. Human memory strength is predicted by theta-frequency phase-locking of single neurons. Nature 464 (7290), 903–907. [DOI] [PubMed] [Google Scholar]
- Rutishauser U, Ye S, Koroma M, Tudusciuc O, Ross IB, Chung JM, Mamelak AN, 2015. Representation of retrieval confidence by single neurons in the human medial temporal lobe. Nat. Neurosci 18 (7), 1041–1050. [DOI] [PMC free article] [PubMed] [Google Scholar]
- Sederberg PB, Gershman SJ, Polyn SM, Norman KA, 2011. Human memory reconsolidation can be explained using the temporal context model. Psychon. Bull. Rev 18 (3), 455–468. [DOI] [PMC free article] [PubMed] [Google Scholar]
- Shaoul C, 2010. The Westbury Lab Wikipedia Corpus. University of Alberta, Edmonton, AB, p. 131. [Google Scholar]
- Skaggs WE, McNaughton BL, Wilson MA, Barnes CA, 1996. Theta phase precession in hippocampal neuronal populations and the compression of temporal sequences. Hippocampus 6 (2), 149–172. [DOI] [PubMed] [Google Scholar]
- Solomon EA, Stein JM, Das S, Gorniak R, Sperling MR, Worrell G, Inman CS, Tan RJ, Jobst BC, Rizzuto DS, Kahana MJ, 2019. Dynamic theta networks in the human medial temporal lobe support episodic memory. Curr. Biol 29 (7) 1100–1111 e1104. [DOI] [PMC free article] [PubMed] [Google Scholar]
- Spaak E, Watanabe K, Funahashi S, Stokes MG, 2017. Stable and dynamic coding for working memory in primate prefrontal cortex. J. Neurosci 37 (27), 6503–6516. [DOI] [PMC free article] [PubMed] [Google Scholar]
- Staresina BP, Reber TP, Niediek J, Bostrom J, Elger CE, Mormann F, 2019. Recollection in the human hippocampal-entorhinal cell circuitry. Nat. Commun 10 (1), 1503. [DOI] [PMC free article] [PubMed] [Google Scholar]
- Tallon-Baudry C, Bertrand O, 1999. Oscillatory gamma activity in humans and its role in object representation. Trends Cogn. Sci 3 (4), 151–162. [DOI] [PubMed] [Google Scholar]
- Tan RJ, Rugg MD, Lega BC, 2020. Direct brain recordings identify hippocampal and cortical networks that distinguish successful versus failed episodic memory retrieval. Neuropsychologia 147, 107595. [DOI] [PMC free article] [PubMed] [Google Scholar]
- Tsitsiklis M, Miller J, Qasim SE, Inman CS, Gross RE, Willie JT, Smith EH, Sheth SA, Schevon CA, Sperling MR, Sharan A, Stein JM, Jacobs J, 2020. Single-neuron representations of spatial targets in humans. Curr. Biol 30 (2) 245–253 e244. [DOI] [PMC free article] [PubMed] [Google Scholar]
- Umbach G, Kantak P, Jacobs J, Kahana M, Pfeiffer BE, Sperling M, Lega B, 2020. Time cells in the human hippocampus and entorhinal cortex support episodic memory. Proc. Natl. Acad. Sci. U. S. A 117 (45), 28463–28474. [DOI] [PMC free article] [PubMed] [Google Scholar]
- Vaz AP, Wittig JH, Inati SK, Zaghloul KA, 2020. Replay of cortical spiking sequences during human memory retrieval. Science 367 (6482), 1131–1134. [DOI] [PMC free article] [PubMed] [Google Scholar]
- Watrous AJ, Miller J, Qasim SE, Fried I, Jacobs J, 2018. Phase-tuned neuronal firing encodes human contextual representations for navigational goals. Elife 7, e32554. [DOI] [PMC free article] [PubMed] [Google Scholar]
- Weidemann CT, Kragel JE, Lega BC, Worrell GA, Sperling MR, Sharan AD, Jobst BC, Khadjevand F, Davis KA, Wanda PA, 2019. Neural activity reveals interactions between episodic and semantic memory systems during retrieval. J. Exp. Psychol. Gen 148 (1), 1. [DOI] [PMC free article] [PubMed] [Google Scholar]
- Welch PD, 1967. The use of fast Fourier transform for the estimation of power spectra: a method based on time averaging over short, modified periodograms. IEEE Trans. Audio Electroacoust 15 (2), 70–73. [Google Scholar]
- Wixted JT, Goldinger SD, Squire LR, Kuhn JR, Papesh MH, Smith KA, Treiman DM, Steinmetz PN, 2018. Coding of episodic memory in the human hippocampus. Proc. Natl. Acad. Sci. U. S. A 115 (5), 1093–1098. [DOI] [PMC free article] [PubMed] [Google Scholar]
- Wixted JT, Squire LR, Jang Y, Papesh MH, Goldinger SD, Kuhn JR, Smith KA, Treiman DM, Steinmetz PN, 2014. Sparse and distributed coding of episodic memory in neurons of the human hippocampus. Proc. Natl. Acad. Sci. U. S. A 111 (26), 9621–9626. [DOI] [PMC free article] [PubMed] [Google Scholar]
- Wyble BP, Linster C, Hasselmo ME, 2000. Size of CA1-evoked synaptic potentials is related to theta rhythm phase in rat hippocampus. J. Neurophysiol 83 (4), 2138–2144. [DOI] [PubMed] [Google Scholar]
- Yaffe RB, Kerr MS, Damera S, Sarma SV, Inati SK, Zaghloul KA, 2014. Reinstatement of distributed cortical oscillations occurs with precise spatiotemporal dynamics during successful memory retrieval. Proc. Natl. Acad. Sci. U. S. A 111 (52), 18727–18732. [DOI] [PMC free article] [PubMed] [Google Scholar]
Associated Data
This section collects any data citations, data availability statements, or supplementary materials included in this article.
Supplementary Materials
Data Availability Statement
The analysis was performed using Python and MATLAB codes provided in Combinato (https://github.com/jniediek/combinato), EEG Toolbox written in the University of Pennsylvania (http://memory.psych.upenn.edu/Software), CircStat (https://github.com/circstat/circstat-matlab) and Chronux (http://chronux.org), which are freely available. The data are not publicly available due to privacy or ethical restrictions. The corresponding author, Bradley Lega (Bradley.Lega@utsouthwestern.edu) will approve for sharing the data and custom-made codes implemented for this study upon request, after completion of a data sharing agreement.