

Abstract
Hepatocellular carcinoma (HCC) is the second leading cause of cancer deaths globally, and the incidence rate in the US is increasing. Studies have identified inter- and intra-tumor heterogeneity as histological and/or molecular subtypes/variants associated with response to certain molecular targeted therapies. Spatial HCC tissue profiling of N-linked glycosylation by matrix-assisted laser desorption ionization imaging mass spectrometry (MALDI-IMS) may serve as a new method to evaluate the tumor heterogeneity. Previous work has identified significant changes in the N-linked glycosylation of HCC tumors but has not accounted for the heterogeneous genetic and molecular nature of HCC. To determine the correlation between HCC-specific N-glycosylation changes and genetic/molecular tumor features, we profiled HCC tissue samples with MALDI-IMS and correlated the spatial N-glycosylation with a widely used HCC molecular classification (Hoshida subtypes). MALDI-IMS data displayed trends that could approximately distinguish between subtypes, with subtype 1 demonstrating significantly dysregulated N-glycosylation versus adjacent non-tumor tissue. While there were no individual N-glycan structures that could identify specific subtypes, trends emerged regarding the correlation of branched glycan expression to HCC as a whole and fucosylated glycan expression to subtype 1 tumors specifically.
Implication:
Correlating N-glycosylation to specific subtypes offers the specific detection of subtypes of HCC, which could both enhance early HCC sensitivity and guide targeted clinical therapies.
Keywords: MALDI-IMS, N-glycosylation, HCC, Biomarker, Tumor subtype
Introduction
N-linked glycans (N-glycans), which are responsible for a wide range of physiological and cellular functions, have been demonstrated to be dysregulated in a variety of cancer types. 1–10 Aberrant glycosylation has been demonstrated to contribute to tumor progression and metastasis, which has enabled research into the usage of glycan expression and glycoprotein expression as clinical biomarkers of cancer.11 Glycoproteins that serve as cancer biomarkers clinically include carbohydrate antigen 19–9 (CA 19–9) for pancreatic cancer and α-fetoprotein (AFP) for hepatocellular carcinoma (HCC). 12,13 While AFP is the major tumor marker for HCC, its clinical impact in HCC screening programs is mitigated due to tumor heterogeneity, with many tumors not producing AFP. AFP alone is not recommended for surveillance given insufficient sensitivity, and the combination of abdominal ultrasound and AFP still misses over one-third of HCC cases at an early stage.14 Indeed, studies have identified substantial histological and molecular heterogeneity across and within HCC tumors as distinct subtypes/variants, which includes heterogeneity in AFP expression.15,16 In addition, a recent clinical trial showed that a subset of HCC tumors characterized by high AFP are more sensitive to a VEGFR2 antibody, ramucirumab, compared to the rest of the tumors, suggesting that biomarkers that specifically detect HCC subtypes can guide therapeutic decision making.17 Therefore, given its central importance to increasing curative treatment eligibility and reducing HCC-related mortality, there is a clear need for better or complimentary biomarkers to improve early HCC detection.18
Our lab’s previous work has identified structural trends of N-glycans that are common to HCC tumors when compared to cirrhotic and healthy liver tissue.19 This work was done utilizing matrix-assisted laser desorption ionization imaging mass spectrometry (MALDI-IMS) to analyze N-glycan structures found on the cell surface directly on HCC tissues localized to tumor regions. Two major structural trends of glycans emerged that were correlated to HCC tumors: increased expression of fucosylated structures and increased expression of tri- and tetra-antennary branched structures. The fucosylation trends in particular support what has previously been observed in HCC serum towards biomarker discovery.20–24 Although it was clear that HCC tumors generally have aberrant N-linked glycosylation, there was significant inter-tumor heterogeneity of N-glycan expression, particularly in regards to the branched and fucosylated structures that were correlated to HCC regions.19 This heterogeneity is further supported by work that shows N-glycan heterogeneity between tumors with high AFP expression and low AFP expression.25 Therefore, we hypothesized that heterogeneity of N-glycosylation in HCC is correlated with specific histological, molecular, and clinical features of HCC tumors. HCC is well known to be a genetically and molecular heterogeneous disease, and recent work by a number of groups have classified HCC into specific subtypes to reduce this overall heterogeneity.26–30 These subtypes have been determined largely based on genome-based groupings, which have never before been linked with study of cancer N-glycomics.
In this study, we employed the latest spatial glycan profiling technology to analyze formalin-fixed paraffin-embedded (FFPE) HCC tissues from a cohort of HCC patients with the information of the Hoshida HCC molecular classification, which has been widely used as a reference system in various human HCC omics profiling consortiums, rodent models, and in vitro experimental systems.26,27,31–36 This classification is based on genomic features and associated with histological variants, biochemical features such as AFP, and clinical prognosis.15 Hoshida subtype 1 is characterized by fibrogenic molecular features such as TGFβ pathway activation and accompanied with immune cell infiltrates (S1; stromal subtype). Subtype 2 is characterized by classical HCC-like features, including AFP positivity, hyper vascularity, and stemness-related cell surface markers (S2; stemness-angiogenic subtype). Subtype 3 is characterized by well differentiated histology, somatic DNA mutations in CTNNB1 gene in half of the subtype, and less aggressive clinical tumor progression compared to S1 and S2 tumors (S3; differentiated subtype). Clinical detection of these subtypes will significantly improve prognostic prediction and enable tailored and rational treatment strategy.
Materials and Methods
Patient Tissues and Tissue Microarrays.
The tissue microarray (TMA) slide was purchased from US Biomax (Rockville, MD, Catalog Number: LV481) as unstained formalin fixed paraffin embedded (FFPE) tissue cores (5 μm thickness). The TMA contained 23 cases and 48 cores. This includes 12 HCC cases and 12 tumor-adjacent non-tumor hepatic tissue cases in duplicate. There was one matched pair between HCC cores and tumor-adjacent cores, the remainder of the HCC and tumor-adjacent samples were taken from unique patients.
FFPE tissue sections (5 μm thick) were made from 28 HCC tissue blocks from surgical resection of HCC in the background of liver cirrhosis Samples were provided from the Icahn School of Medicine at Mount Sinai under IRB HS 13–00456 and HS 15–00888 to Dr. Yujin Hoshida and from the UT Southwestern Medical Center under IRB 102010–051 to Dr. Amit Singal. The glycan imaging work at MUSC was performed under IRB Pro00079936. Patient characteristics of these samples including sex, age, AFP levels, and etiology can be found in Table S1. HCC tissues were subtyped according to the Hoshida classification system as done previously.15,26 All tissues were H&E stained following MALDI-IMS analysis and tumor regions were annotated by a liver pathologist.
FFPE Tissue Preparation for MALDI-IMS.
HPLC grade methanol (Catalog No. A452SK-4), ethanol (Catalog No. 22–032-601), acetonitrile (Catalog No. A998–1), xylene (Catalog No. X3S-4), and water (Catalog No. W5–1) were obtained from Fisher Scientific (Pittsburgh, PA). Trifluoroacetic acid (Catalog No. W302031) and α-cyano-4- hydroxycinnamic acid (Catalog No. C89892) were obtained from Sigma-Aldrich (St. Louis, MO). Peptide-N-glycosidase F (PNGase F) Prime was cloned, expressed, and purified in-house as previously described. 37
FFPE tissues and the TMA were prepared according to a previously published protocol.37–39 Tissue Tack microscope slides were purchased from Polysciences Inc (Warrington, PA, Catalog No. 24216), and indium tin oxide glass slides were purchased from Delta Technologies (Loveland, CO, Catalog No. CB-40IN-S111). Briefly, slides were heated to 60°C for 1 hour, washed with xylenes, and rehydrated with a series of ethanol and water washes. Slides were then processed by antigen retrieval, heating to 95° C for 30 minutes in a Decloaking Chamber in a 10 mM citraconic anhydride buffer, pH 3. Slides were cooled to room temperature and buffer exchange was done to replace buffer with 100% water. PNGase F Prime™ was applied using a M5 TM-Sprayer Tissue MALDI Sample Preparation System (HTX Technologies, LLC). After a two-hour incubation at 37°C, MALDI matrix α-cyano-4-hydroxycinnamic acid (0.042 g CHCA in 6 mL 50% acetonitrile/49.9% water/0.1% TFA) was sprayed by the M5 TM-Sprayer.
MALDI-IMS of N-Glycans.
Slides were imaged on a MALDI FT-ICR (SolariX Legacy 7T, Bruker Daltonics) mass spectrometer in positive ion, broadband mode (m/z 500–5000) and a MALDI TOF (RapifleX TissueTyper, Bruker Daltonics) in positive ion mode (m/z 600–3500). Images were collected on the FT-ICR at a 150 μM raster with 200 laser shots per pixel. Images were collected on the MALDI-TOF at a 50 μM raster with 200 laser shots per pixel. Data was visualized and analyzed using FlexImaging 5.0 and SCiLS Lab 2019c (Bruker). Peaks were assigned to N-glycan structures based upon mass using a database of N-glycan structures built with consideration to biosynthetic pathways.40 Putative structures are shown based on previous databases through use of databases built with use of GlycoWorkBench (RRID:SCR_000782).37,39,41 Glycan structures, m/z values, and mass error can be found in Supplementary Table 2 for FT-ICR data and Supplementary Table 3 for MALDI-TOF data.
Statistical Analysis.
After MALDI-IMS analysis, statistical analyses were done in order to evaluate differences between HCC tissue and adjacent non-HCC tissue in both the TMA and whole tissue analyses. For the TMA, area under the peak (AUP) was determined using SCiLS for each m/z value in each tissue core, and the average AUP was determined for each m/z of both HCC cores and non-HCC cores. Unpaired student’s t tests were used to determine glycan structures that were significantly increased in either HCC or non-HCC cores, with a cutoff of p < 0.05. For the whole tissues, HCC and adjacent liver tissue regions were annotated by a pathologist. For the cohort analyzed via FT-ICR, AUP was determined for each m/z value for both the tumor region and adjacent non-tumor (primarily cirrhotic) region. An AUP fold change of >3 signified a tumor-associated increase to glycan expression. Significant differences between groups was determined using a Wilcoxon Rank-Sum Test, with a cutoff of p < 0.05. For the cohort analyzed via MALDI TOF, SCiLS spatial co-localization feature was utilized, which identifies m/z peaks with resultant images that demonstrate a spatial correlation in signal intensity to the tumor region, with a threshold of a >0.4 Pearson coefficient to determine positive correlation. A top-hat baseline correction through SCiLS was utilized for the MALDI-TOF mass spectrometry imaging runs.
Results
Inter-tumor heterogeneity of N-Glycan expression in HCC tissues.
Previous work has suggested that there are distinguishable differences in N-glycan expression in both HCC serum and HCC tissues when compared to both cirrhotic and healthy liver tissue.19,42,43 To validate these results, we analyzed the N-glycome of an independent HCC tissue microarray (TMA) through MALDI-IMS FT-ICR (Figure 1). The TMA was H&E stained to compare to MALDI images, which is shown in Figure 1A. Tissue preparation for N-glycan analysis through MALDI-IMS involves the usage of the enzyme PNGase F Prime™, which cleaves N-glycans from arginine residues of glycoproteins while retaining spatial localization of the glycan (Figure S1). In this analysis, 88 unique glycan structures were observed, with the area under the curve (AUP) of each m/z peak analyzed for each core (Table S2). Peaks were selected based on the known theoretical m/z values from a database of N-glycan structures. Twenty-three of these structures were significantly increased in the HCC cores, and seven of the structures were significantly increased in the tumor-adjacent non-tumor cores (Tables 1 and S4). Of the 23 structures that were significantly increased in HCC samples, 19 were fucosylated and 16 structures were complex glycans that were either bisecting, tri-antennary, and tetra-antennary structures (Figure 1B and 1C). Additionally, none of the seven glycans that are increased in tumor-adjacent cores were fucosylated and instead are primarily high mannose or non-fucosylated biantennary structures. A representative image of one of these glycans increased in non-tumor cores is shown in Figure 1D. Fucosylated and/or branched glycans made up the majority of glycans that were increased in HCC cores, but there were a few structures that did not fit this pattern. Some of the glycans increased in HCC cores were relatively simple structures that were non-fucosylated and/or simple structures with only two antennae, an example of which is seen in Figure 1E.
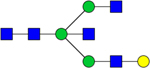
Figure 1:

(A): H&E staining of the TMA. The organization of the TMA includes 2 cores each from 12 unique HCC tumors, and 2 cores each from 12 unique tumor-adjacent non-tumor liver tissue adjacent to HCC cases. The columns indicated with a “+” include horizontally paired HCC cores, and the columns indicated with a “-” include horizontally paired non-tumor tumor-adjacent cores. (B-F): MALDI-IMS images of representative glycan structures. (B-C): Structures that are significantly enriched in HCC cores. m/z= 2685.9551 (B); m/z= 2539.9045 (C); (D): A structure that is more abundant in non-tumor tumor-adjacent cores than HCC cores. m/z= 1743.5816 (E): A structure that is significantly enriched in HCC tumors but is observed at relatively low levels. m/z= 1704.6180 (F): A structure that is not significantly enriched in HCC cores as a whole, but clearly over-abundant in select tumors. m/z= 2393.8436
Table 1:
The 12 glycan structures that are most significantly associated with HCC cores in the TMA. There are 23 glycan structures total that are enriched in HCC cores over tumor-adjacent cores.
| Observed m/z | Proposed Glycan Structure | Composition | P value |
|---|---|---|---|
| 1704.5736 |
|
Hex4HexNAc5 | 1.0874E-06 |
| 2377.8183 |
|
Hex6dHex1HexNAc6 | 4.3991E-06 |
| 1850.6241 |
|
Hex4dHex1HexNAc5 | 6.7922E-06 |
| 2685.9074 |
|
Hex7dHex2HexNAc6 | 8.4026E-05 |
| 2012.6801 |
|
Hex5dHex1HexNAc5 | 0.0001119 |
| 1688.5748 |
|
Hex3dHex1HexNAc5 | 0.0002022 |
| 2831.9725 |
|
Hex7dHex3HexNAc6 | 0.0002513 |
| 2539.8637 |
|
Hex7dHex1HexNAc6 | 0.0005301 |
| 1647.5597 |
|
Hex4dHex1HexNAc4 | 0.0005561 |
| 2174.7385 |
|
Hex6dHex1HexNAc5 | 0.001602 |
| 2320.7831 |
|
Hex6dHex2HexNAc5 | 0.002175 |
| 2830.9227 |
|
Hex7dHex1HexNAc6NeuAc1 | 0.002914 |
While many of the N-glycan expression trends that have been previously identified are validated here, inter-tumor and intra-tumor heterogeneity remains. This sort of heterogeneity is clear throughout all of the m/z images shown in Figure 1, where there are no glycans that are consistent in expression throughout all of the HCC cores or throughout all of the non-tumor tumor-adjacent cores. This sort of heterogeneity is highlighted in Figure 1F, which is a tetra-antennary glycan structure that has previously been shown to be often overexpressed in HCC tissues. This glycan was not significantly overexpressed in this TMA, with a p-value of 0.125, yet several of the HCC cases within the TMA express this glycan at very high levels compared to the non-HCC cores. Even the glycans that are significantly increased in HCC cores of this TMA vary substantially from tumor to tumor in expression (Figure 1B–C). N-glycosylation of HCC tissue is distinct from non-HCC tissue, but there are clearly additional factors beyond tumor presence that account for which structures are increased in expression in a tumor and to what degree they are increased in expression.
Tumor-specific N-glycan expression associated with HCC molecular subtypes.
In order to analyze N-glycosylation of HCC samples while accounting for genetic, molecular, and clinical variation, we subsequently analyzed HCC tumors that were classified using the Hoshida classification system (Figure S2).26,28 A direct comparison was made between each HCC tumor itself and its surrounding adjacent tissue for each sample, which was evaluated as the fold change for each glycan between regions. The adjacent tissue that was utilized in the analysis consisted primarily of cirrhotic/non-tumor liver tissue, with necrotic and fibrotic regions excluded. In total, thirty-seven subtyped tissues were examined in two defined sets. The first set consisted of twenty-five samples (six S1, four S2, fifteen S3 tumors) and was examined on the FT-ICR mass spectrometer as a part of the “discovery cohort”. Subsequently, the remaining twelve samples were examined on the MALDI-TOF instrument as a “validating cohort”. The discovery cohort was analyzed on a high mass accuracy and high sensitivity mass spectrometer in order to find specific N-glycosylation structural features associated with molecular subtypes. The validating cohort was analyzed on a more clinically accessible MALDI-TOF instrument at a higher spatial resolution to both evaluate the clinical applicability of the subtype-linked N-glycosylation and to further observe potential intra-tumor heterogeneity. Characteristics of the patients from both cohorts are found in Supplementary Table 1. These samples were utilized to represent the diversity of genetic characteristics of HCC tumors and not necessarily to mirror demographic characteristics found in the clinic such as etiology or gender, which have not been previously shown to be correlated to N-glycan expression.
As seen in Figure 2, the discovery cohort showed that all three subtypes demonstrate altered N-glycosylation of HCC tumors when compared to surrounding cirrhotic/non-tumor tissue, which further validates what previous work and the TMA analysis demonstrated broadly. An immediately clear difference between subtypes is seen in the total number of unique glycan structures with increased expression within tumors. For this work, an area under the peak fold change of three or higher from adjacent tissue to the tumor region was considered to be a tumor-associated increased expression of a glycan structure. Glycan structures varied in the magnitude of the fold change/tumor-associated increase, but of particular interest is the number of unique glycan structures that are increased within tumors, which implies broad dysregulation over the expression of N-glycan structures. All three subtypes demonstrate differentiating glycans from the non-tumor tissue, which vary based on the tumor, but S1 tumors in this cohort had significantly more unique glycan structures that were increased in the tumor region than S2/S3 per tumor (Figure 2A). When accounting for structural features of these glycans, the glycans that are increased in the tumor are largely made up of bisecting and tetra-antennary glycans in all three subtypes, which aligns with previously held ideas that branching is generally increased in HCC tumors (Figure 2B). When comparing fucosylation patterns between the subtypes, S1 tumors overexpress fucosylated structures with higher frequency than S2 or S3 tumors (Figure 2C). Increased expression of fucosylated structures appears to be a feature in S3 tumors similarly to S1, but there are significantly fewer overexpressed structures overall in S3 tumors. However, overexpression of fucosylated structures does not appear to occur at the same level in S2 tumors compared to S1 tumors, which offers a potential distinguishing feature of the two clinically aggressive subtypes. It does not appear as though a major share of tumor-associated glycans are sialylated in any of the three subtypes, which aligns with previous work that fucosylation is more relevant to HCC than sialylation (Figure 2D).
Figure 2:

(A): Analysis of the number of unique glycan structures with a 3+ fold area under the peak (AUP) increase in the tumor when compared to adjacent non-tumor/cirrhotic tissue. n=5 (S1), n=4 (S2), n=15 (S3). Statistical test includes Wilcoxon Rank-Sum test (* = p < 0.05) (B): The structural features of glycans that are increased in the tumor for each subtype. Structural features are determined based upon proposed structures for m/z values. (C): Analysis into the increase of fucosylated structures in tumors of each subtype. (D): Analysis into the increase of sialylated structures for tumors of each subtype. (E): The average fold change of all fucosylated tetra-antennary glycans by subtype. Average fold change was calculated through the sum AUP of these glycans in each tumor and non-tumor region. Statistical test includes Wilcoxon Rank-Sum test (* = p < 0.05). (F): The average fold change of all non-fucosylated tetra-antennary glycans by subtype. Statistical test includes Wilcoxon Rank-Sum test (* = p < 0.05).
Fucosylated tetra-antennary structures have been previously shown to be correlated with HCC in general, although lacking the necessary sensitivity to serve as a standalone biomarker. However, fucosylated tetra-antennary glycans are increased at significantly higher levels in S1 tumors than S2 tumors, while there is no difference between the three subtypes in the increased expression of non-fucosylated tetra-antennary structures (Figure 2E/F). This suggests that tetra-antennary structures are increased in expression in all subtypes of HCC, but fucosylated tetra-antennary structures vary in expression between subtypes of HCC, with higher expression in the clinically aggressive S1 tumors than the clinically aggressive S2 tumors.
The primary observed feature of the N-glycosylation in S1 tumors is the increased expression of fucosylated and/or branched glycan structures. In Figure 3, representative images from three of the S1 tumors are shown, with the tumors outlined in blue on the H&E stains (Figure 3A–C). In each of these three tumors, there are many tumor-increased glycan structures which fit the themes of increased branching and increased fucosylation. The expression of both a tetra-antennary structure with a single fucose (Figure 3D–F) and a tri-antennary structure with a single fucose (Figure 3G–I) are increased in all three of these tumors. These individual glycan structures are not increased in all six of the S1 tumors in this cohort, but these branched and fucosylated glycans represent the type of structures that are often increased in S1 tumors. These m/z images also demonstrate that HCC tumors contain intra-tumor heterogeneity, which was expected but requires further analysis in order to evaluate.
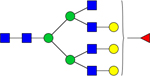
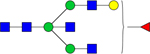
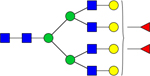
Figure 3:

(A-C): H&E stains of three S1 tissues. Tumors are outlined in blue. Regions of the adjacent tissue with significant necrosis or fibrosis were not included in glycosylation analyses. (D-F): Expression of a tetra-antennary structure with a single fucose, m/z= 2539.9045 (G-I): Expression of a tri-antennary structure with a single fucose, m/z= 2174.7784
Fucosylation in S2 tumors is of particular interest, as there is a clear difference in fucosylation patterns between S1 and S2 tumors as demonstrated in Figure 4. As seen previously, fucosylated structures being increased within the tumor is not a feature in S2 tumors. Additionally, a large share of the structures with a three-fold increase in the adjacent tissue compared to the tumor are fucosylated (Figure 4A). This would suggest that there is actually decreased expression of fucosylated structures in S2 tumors compared to adjacent non-HCC liver tissue, which directly opposes what is seen in S1 tumors. Representative images demonstrating this fucosylation pattern are shown in Figure 4B, where a simple biantennary structure is tumor-correlated, while the fucosylated structures shown to be tumor-correlated in S1 tumors are expressed more in the adjacent non-tumor liver tissue than in this S2 tumor. An analysis of individual glycan structures reveals that fucosylated structures that are frequently tumor-correlated in S1 tumors are expressed at significantly higher levels in S1 tumors than in S2 tumors regardless of the adjacent tissue. (Figure 4C). These five fucosylated structures are some of the most abundant tri-antennary, bisecting, and tetra-antennary fucosylated structures observed in these tissues, which suggests that fucosylation patterns are distinguishably different between these subtypes. Overall, fucosylation appears to be directly involved in tumor progression of many S1 tumors, while the expression of fucosylated structures is decreased in S2 tumors.
Figure 4:

(A): Increased expression of fucosylated and non-fucosylated glycans in HCC and non-HCC adjacent tissue by 3+ fold change. (B): Representative images of an S2 tissue. Tumor outlined in blue, with adjacent non-tumor liver tissue. m/z= 1339.4736 (top right), 2174.7784 (bottom left), m/z= 2539.9045 (bottom right). (C): AUP of five glycans for all S1 tumors and S2 tumors, without inclusion of adjacent tissue. Four fucosylated glycans are significantly increased in S1 tumors, m/z= 2174.7784, 2012.7208, 2377.8445, 2539.9045, 2685.9551 (top left, top right, middle left, middle right, bottom). Statistical test includes Wilcoxon Rank-Sum test (* = p < 0.05).
Validation of Glycomic Trends on MALDI-TOF Instrument.
To confirm subtype-based glycosylation trends observed in the initial cohort of HCC tissues, an additional cohort of 12 subtyped HCC tumors was analyzed using a MALDI-TOF instrument, with the list of detected glycans listed in Table S3. TOF-based mass spectrometry involves currently more clinically applicable instrumentation, albeit with a decreased sensitivity. Data analysis for this figure was done by determining m/z peaks determined to be spatially correlated to the tumor regions by Pearson coefficient, which differed from analysis of the discovery cohort due to variations in signal intensity from run to run on this instrument.
As can be seen in Figure 5, many of the trends observed earlier regarding increased overall dysregulation, specifically of fucosylation, in S1 tumors are also seen in analysis of this cohort. For this analysis, data from S2/S3 tumors were combined, which was done to further examine whether S1 tumors were distinguishable from all other HCC tumors. S1 tumors exhibit increased expression of a larger number of unique glycan structures than S2/S3 tumors (Figure 5A). Structural trends regarding the association of increased branching/bisecting and the tumors remain for both S1 and S2/S3 tumors (Figure 5B). Tetra-antennary glycans make up a greater percentage of tumor-associated glycans in S2/S3 than S1, although some of higher mass fucosylated tetra-antennary structures that were detected on the FT-ICR instrument were not detected on the TOF instrument. Based on the tissues analyzed in this cohort and previously, it does not appear as though the correlation between branching and tumor progression is subtype dependent. However, fucosylated structures are overexpressed with more abundance and variety in S1 tumors than S2/S3 tumors, which validates observations regarding fucosylation in the discovery cohort (Figure 5C). Once again, it should be emphasized that these trends regarding fucosylation and glycan dysregulation are not universal within each subtype. There are S1 tumors in both cohorts that do not exhibit the increased fucosylation being linked to S1, and there is a spectrum of S2/S3 tumors regarding the degree to which their glycosylation differs from surrounding tissue. This uncertainty can likely be attributed to both the imprecise nature of classifying all HCC cases into only three subtypes and the wide range of potential mechanistic effects through which altered glycosylation can support and drive tumor progression. However, trends regarding increased expression of branched structures in all three subtypes (Fig 5D) and increased expression of fucosylated structures in S1 (Fig 5E) do emerge and are worthy of further exploration for biomarker applications.
Figure 5:

(A): Analysis of the number of unique glycan structures that are correlated (Pearson coefficient > 0.4) to the tumor region when compared to adjacent non-tumor/cirrhotic region. n=5 (S1), n=2 (S2), n=5 (S3). Statistical test includes Wilcoxon Rank-Sum test (** = p < 0.01). (B): The structural features of glycans that are correlated to the tumor for S1 tumors and S2/S3 tumors (C): Analysis into the increase of fucosylated structures in S1 tumors and S2/S3 tumors. (D): Representative images of an S1 and S3 tumor to demonstrate that branched glycans without fucose are regularly overexpressed in tumors of all three subtypes, m/z=2393.849. The S3 tissue shown has a large region of fibrovascular tissue, which was not included in analysis but contains interesting glycosylation. (E): Representative images of an S1 tumor to demonstrate increased expression of fucosylated glycans, which extends to biantennary, bisecting, and branching structures. m/z= 1955.699 (top right), 1688.603 (bottom left), and 2320.835 (bottom right).
Discussion
Aberrant glycosylation has been considered a hallmark of cancer malignancy for many years.9,44–47 Mechanistically, glycosylation plays a critical role in cell signaling in non-cancerous tissue, and alterations to glycosylation motifs can drive abnormal signaling pathways in cancer, including increased growth factor signaling by increased core fucosylation as a prominent example.10,48 Additionally, expression of complex branched N-glycans has been linked to differentiation and metastasis along with the regulation of cytokine receptors.49–51 However, there is still a significant amount left unknown regarding both the nature of cancer-related glycosylation changes and the mechanism behind glycosylation’s impact on cancer progression. Further exploration into these fields has promise to reveal both promising cancer markers and a new class of potential cancer drug targets. This work focuses on the application of cancer-related N-glycosylation to the development of cancer markers, which is a rapidly developing field. Due to the ubiquitous nature of N-glycan expression on glycoproteins, the utilization of N-glycans as biomarkers for cancer could have profound implications on a wide range of cancer types. In many of these cases, molecular heterogeneity of cancer implies that the application of N-glycomics information to biomarker development is more likely to be successful as an algorithm of N-glycan expression as opposed to a single glycan structure, and there are already examples of this concept in development.52 However, there is still a significant need to understand the inter-tumor heterogeneity of N-glycosylation in HCC in order to more specifically apply glycomics information, as current glycomic biomarkers and algorithms have not been fully validated to be more sensitive for early stage HCC than AFP and/or ultrasound monitoring.53
Previous work on HCC tissues has demonstrated that branching and fucosylation are increased on HCC tissue and serum, but there was significant glycan heterogeneity that made understanding how to apply this information difficult.19,27,54,55 Incorporation of genetic and clinical information of each HCC tumor, which was novel to MALDI-IMS N-glycomic analysis, accounted for some of this heterogeneity. S1 tumors were demonstrated to have the most broadly dysregulated N-glycosylation in both cohorts analyzed, which allows this subtype to be distinguishable from other HCC tumors. Perhaps more significantly, fucosylated structures, which are conventionally considered to have increased expression overall in HCC, are increased with more frequency in S1 than in S2 or S3 tumors. This pattern of fucosylation in S1 tumors held up in both the cohort of samples analyzed through MALDI-FT-ICR and the cohort analyzed through the more clinically accessible MALDI-TOF. Interestingly, it appeared as though fucosylation may actually be decreased in S2 tumors, based upon both a lack of fucosylated structures with increased tumor expression and increased expression of fucosylated structures outside the tumor, which is in stark contrast to what is seen in S1 tumors considering their similarity in clinical outcomes. This suggests that aggressive stromal tumors have increased fucosylation within the tumor, whereas aggressive stemness tumors have decreased fucosylation within the tumor.
Drastic overexpression of a multitude of varied glycan structures, many including fucose(s), appears to be limited to S1 tumors, as only one S2/S3 tumor had more than five glycans with a threefold increase in the tumor, and only one S2/S3 tumor had more than three glycans determined to be spatially correlated to the tumor region. However, aberrant glycan expression is not uniform in S1 tumors, which is demonstrated by two S1 tissues, one in each cohort, that exhibited an increase to primarily non-fucosylated glycans. Further analysis into the specific features of S1 tumors that correlate with increased expression of complex fucosylated structures will be necessary. However, this data suggests that S1 tumors encapsulate most, if not all, of the HCC tumors that demonstrate extremely different glycosylation from adjacent cirrhotic liver tissue, specifically including increased fucosylation. Further validating this finding could prove very useful towards applying glycosylation information clinically as a method of using fucosylation patterns to distinguish S1 tumors easily.
Both S2 and S3 tumors demonstrate N-linked glycosylation that is more consistent with that of the adjacent, non-HCC tissue. There are typically still glycan structures in each tumor that exhibit increased expression, and these are often branched structures which have previously been shown to be directly linked to cancer progression in a variety of cancer types.24,49,50 S3 tumors having similar glycosylation to their surrounding tissue is unsurprising, as this subclass of tumors retains a hepatocyte phenotype, is well-differentiated, and includes the least aggressive HCC tumors. S3 tumors also have fewer hallmark aberrant signaling pathways, which altered glycosylation would play important roles in. However, these clinically favorable features of S3 tumors are not the case in S2 tumors, which are poorly differentiated and aggressive in nature. Along with poor clinical outcomes, S1 and S2 tumors share several mutated signaling pathways, including through canonical WNT signaling and mutated p53 signaling. Based on this N-glycosylation data, S2 tumors progress into rapidly proliferating, metastatic tumors in a very different manner than S1 tumors, specifically in a manner that does not rely on the overexpression of many fucosylated N-glycan structures. Further work into mechanistic differences between these subtypes could be exceedingly valuable in gaining an understanding into the relation of N-glycosylation and HCC development, progression, and metastasis, and it could offer more specific targets for both biomarker and drug development.
The validation of increased fucosylation in S1 tumors would have profound impacts for biomarker development. One of the features used to classify S2 tumors is significantly increased AFP levels from the other two subtypes, and AFP has already been demonstrated to have clinical biomarker utility.56 If AFP could be supplemented with a fucosylated marker that could increase detection of S1 tumors, which have lower AFP levels, this would have a notable impact on HCC screening effectiveness and HCC mortality reduction. . Indeed, our work has identified fucosylated kininogen as a good partner for AFP in biomarker algorithms and the results presented here may explain why this is the case.21,42,57,58 S3 tumors having less dramatic glycosylation abnormalities was expected, as this subtype is well-differentiated and less aggressive. Therefore, these tumors may be more indolent in nature with slower tumor doubling times and potentially lower risk of HCC-related mortality.59 Combining glycomic differences of S1 tumors and the high AFP levels of S2 tumors could lead to better detection of the most aggressive tumors, which would have profound effects on overall survival of HCC patients. In order for this to become clinically valuable, the distinguishing N-glycosylation features discussed here must be validated in serum.
Overall, there is clear value in incorporating genetic and clinical information into analysis of N-glycosylation of HCC, and it would likely be worthwhile to expand this idea to other cancer types. Biomarker development for HCC as a whole has largely lagged behind that of other cancer types, and there is still heavy reliance on imaging techniques for surveillance and detection. In order to develop specific markers of HCC, there must be incorporation of more specific information on each tumor beyond simply survival data. HCC is incredibly diverse molecularly and genetically, which suggests that successful markers for HCC must be able to detect a diverse range of presentations of HCC. Discovering markers for specific subclasses of HCC makes it more likely that these markers will complement each other to increase sensitivity to early stage HCC as a whole, which is the most promising avenue to reduce HCC-related mortality.
Supplementary Material
Financial Support:
This work is support by grant U01 CA226052 from the National Cancer Institute (NCI)
Footnotes
The authors declare no potential conflicts of interest
References
- 1.Varki A Biological roles of glycans. Glycobiology 27, 3–49 (2017). [DOI] [PMC free article] [PubMed] [Google Scholar]
- 2.Reily C, Stewart TJ, Renfrow MB & Novak J Glycosylation in health and disease. Nat. Rev. Nephrol. 15, 346–366 (2019). [DOI] [PMC free article] [PubMed] [Google Scholar]
- 3.Helenius A & Aebi M Intracellular functions of N-linked glycans. Science vol. 291 2364–2369 (2001). [DOI] [PubMed] [Google Scholar]
- 4.Oda Y, Hosokawa N, Wada I & Nagata K EDEM as an acceptor of terminally misfolded glycoproteins released from calnexin. Science (80-. ). 299, 1394–1397 (2003). [DOI] [PubMed] [Google Scholar]
- 5.Hebert DN, Foellmer B & Helenius A Glucose trimming and reglucosylation determine glycoprotein association with calnexin in the endoplasmic reticulum. Cell 81, 425–433 (1995). [DOI] [PubMed] [Google Scholar]
- 6.Wang X et al. Dysregulation of TGF-β1 receptor activation leads to abnormal lung development and emphysema-like phenotype in core fucose-deficient mice. Proc. Natl. Acad. Sci. U. S. A. 102, 15791–15796 (2005). [DOI] [PMC free article] [PubMed] [Google Scholar]
- 7.Lingwood CA & Hakomori S Selective inhibition of cell growth and associated changes in glycolipid metabolism induced by monovalent antibodies to glycolipids. Exp. Cell Res. 108, 385–391 (1977). [DOI] [PubMed] [Google Scholar]
- 8.Paszek MJ et al. The cancer glycocalyx mechanically primes integrin-mediated growth and survival. Nature 511, 319–325 (2014). [DOI] [PMC free article] [PubMed] [Google Scholar]
- 9.Pinho SS & Reis CA Glycosylation in cancer : mechanisms and clinical implications. Nat. Rev. Cancer 15, 540–555 (2015). [DOI] [PubMed] [Google Scholar]
- 10.Ferreira IG et al. Glycosylation as a main regulator of growth and death factor receptors signaling. Int. J. Mol. Sci. 19, 1–28 (2018). [DOI] [PMC free article] [PubMed] [Google Scholar]
- 11.Kailemia MJ, Park D & Lebrilla CB Glycans and glycoproteins as specific biomarkers for cancer. Anal. Bioanal. Chem. 409, 395–410 (2017). [DOI] [PMC free article] [PubMed] [Google Scholar]
- 12.Haglund C et al. Evaluation of CA 19–9 as a serum tumour marker in pancreatic cancer. Br. J. Cancer 53, 197–202 (1986). [DOI] [PMC free article] [PubMed] [Google Scholar]
- 13.Tsuchiya N et al. Biomarkers for the early diagnosis of hepatocellular carcinoma. World J. Gastroenterol. 21, 10573–10583 (2015). [DOI] [PMC free article] [PubMed] [Google Scholar]
- 14.Tzartzeva K et al. Surveillance Imaging and Alpha Fetoprotein for Early Detection of Hepatocellular Carcinoma in Patients With Cirrhosis: A Meta- analysis. Gastroenterology 154, 1706–1718 (2018). [DOI] [PMC free article] [PubMed] [Google Scholar]
- 15.Tan PS et al. Clinicopathological indices to predict hepatocellular carcinoma molecular classification. Liver Int. 36, 108–118 (2016). [DOI] [PMC free article] [PubMed] [Google Scholar]
- 16.Hung MH & Wang XW Molecular Alterations and Heterogeneity in Hepatocellular Carcinoma. in Hepatocellular Carcinoma: Translational Precision Medicine Approaches (ed. Hoshida Y) 293–316 (Humana Press, 2019). doi: 10.1007/978-3-030-21540-8_14. [DOI] [PubMed] [Google Scholar]
- 17.Zhu AX et al. Ramucirumab after sorafenib in patients with advanced hepatocellular carcinoma and increased α-fetoprotein concentrations (REACH-2): a randomised, double-blind, placebo-controlled, phase 3 trial. Lancet Oncol. 20, 282–296 (2019). [DOI] [PubMed] [Google Scholar]
- 18.Singal AG, Pillai A & Tiro J Early Detection, Curative Treatment, and Survival Rates for Hepatocellular Carcinoma Surveillance in Patients with Cirrhosis: A Meta-analysis. PLoS Med. 11, e1001624 (2014). [DOI] [PMC free article] [PubMed] [Google Scholar]
- 19.West CA et al. N-Linked Glycan Branching and Fucosylation Are Increased Directly in Hcc Tissue As Determined through in Situ Glycan Imaging. J. Proteome Res. 17, 3454–3462 (2018). [DOI] [PMC free article] [PubMed] [Google Scholar]
- 20.Comunale MA et al. Proteomic analysis of serum associated fucosylated glycoproteins in the development of primary hepatocellular carcinoma. J. Proteome Res. 5, 308–315 (2006). [DOI] [PubMed] [Google Scholar]
- 21.Wang M et al. Novel fucosylated biomarkers for the early detection of hepatocellular carcinoma. Cancer Epidemiol. Biomarkers Prev. 18, 1914–1921 (2009). [DOI] [PMC free article] [PubMed] [Google Scholar]
- 22.Comunale MA et al. Identification and development of fucosylated glycoproteins as biomarkers of primary hepatocellular carcinoma. J. Proteome Res. 8, 595–602 (2009). [DOI] [PMC free article] [PubMed] [Google Scholar]
- 23.Pierce M, Buckhaults P, Chen L & Fregien N Regulation of N-acetylglucosaminyltransferase V and Asn-linked oligosaccharide β(1,6) branching by a growth factor signaling pathway and effects on cell adhesion and metastatic potential. Glycoconjugate Journal vol. 14 623–630 (1997). [DOI] [PubMed] [Google Scholar]
- 24.Granovsky M et al. Suppression of tumor growth and metastasis in Mgat5-deficient mice. Nat. Med. 6, 306–312 (2000). [DOI] [PubMed] [Google Scholar]
- 25.Zhao T et al. Heterogeneities of Site-Specific N-Glycosylation in HCC Tumors With Low and High AFP Concentrations. Front. Oncol. 10, 496 (2020). [DOI] [PMC free article] [PubMed] [Google Scholar]
- 26.Hoshida Y et al. Integrative transcriptome analysis reveals common molecular subclasses of human hepatocellular carcinoma. Cancer Res. 69, 7385–7392 (2009). [DOI] [PMC free article] [PubMed] [Google Scholar]
- 27.Wheeler DA et al. Comprehensive and Integrative Genomic Characterization of Hepatocellular Carcinoma. Cell 169, 1327–1341.e23 (2017). [DOI] [PMC free article] [PubMed] [Google Scholar]
- 28.Goossens N, Sun X & Hoshida Y Molecular classification of hepatocellular carcinoma: potential therapeutic implications. Hepatic Oncol. 2, 371–379 (2015). [DOI] [PMC free article] [PubMed] [Google Scholar]
- 29.Lee J-SS et al. Classification and prediction of survival in hepatocellular carcinoma by gene expression profiling. Hepatology 40, 667–676 (2004). [DOI] [PubMed] [Google Scholar]
- 30.Kaposi-Novak P et al. Met-regulated expression signature defines a subset of human hepatocellular carcinomas with poor prognosis and aggressive phenotype. J. Clin. Invest. 116, 1582–1595 (2006). [DOI] [PMC free article] [PubMed] [Google Scholar]
- 31.Zhu S & Hoshida Y Molecular heterogeneity in hepatocellular carcinoma. Hepatic Oncol. 5, HEP10 (2018). [DOI] [PMC free article] [PubMed] [Google Scholar]
- 32.Chaisaingmongkol J et al. Common Molecular Subtypes Among Asian Hepatocellular Carcinoma and Cholangiocarcinoma. Cancer Cell 32, 57–70.e3 (2017). [DOI] [PMC free article] [PubMed] [Google Scholar]
- 33.Jiang Y et al. Proteomics identifies new therapeutic targets of early-stage hepatocellular carcinoma. Nature 567, 257–261 (2019). [DOI] [PubMed] [Google Scholar]
- 34.Dow M et al. Integrative genomic analysis of mouse and human hepatocellular carcinoma. Proc. Natl. Acad. Sci. U. S. A. 115, E9879–E9888 (2018). [DOI] [PMC free article] [PubMed] [Google Scholar]
- 35.Qiu Z et al. A Pharmacogenomic Landscape in Human Liver Cancers. Cancer Cell 36, 179–193.e11 (2019). [DOI] [PMC free article] [PubMed] [Google Scholar]
- 36.Hirschfield H et al. In vitro modeling of hepatocellular carcinoma molecular subtypes for anti-cancer drug assessment. Exp. Mol. Med. 50, e419 (2018). [DOI] [PMC free article] [PubMed] [Google Scholar]
- 37.Powers TW et al. Matrix assisted laser desorption ionization imaging mass spectrometry workflow for spatial profiling analysis of N-linked Glycan expression in tissues. Anal. Chem. 85, 9799–9806 (2013). [DOI] [PMC free article] [PubMed] [Google Scholar]
- 38.Powers TW, Holst S, Wuhrer M & Mehta AS Two-Dimensional N-Glycan Distribution Mapping of Hepatocellular Carcinoma Tissues by MALDI-Imaging Mass Spectrometry. Biomolecules 5, 2554–2572 (2015). [DOI] [PMC free article] [PubMed] [Google Scholar]
- 39.Powers TW et al. MALDI imaging mass spectrometry profiling of N-glycans in formalin-fixed paraffin embedded clinical tissue blocks and tissue microarrays. PLoS One 9, 1–11 (2014). [DOI] [PMC free article] [PubMed] [Google Scholar]
- 40.Ceroni A et al. GlycoWorkbench: A tool for the computer-assisted annotation of mass spectra of glycans. J. Proteome Res. 7, 1650–1659 (2008). [DOI] [PubMed] [Google Scholar]
- 41.McDowell CT et al. Imaging Mass Spectrometry and Lectin Analysis of N-linked Glycans in Carbohydrate Antigen Defined Pancreatic Cancer Tissues. Mol. Cell. Proteomics 100012 (2021) doi: 10.1074/mcp.ra120.002256. [DOI] [PMC free article] [PubMed] [Google Scholar]
- 42.Wang M et al. Changes in the glycosylation of kininogen and the development of a kininogen based algorithm for the early detection of HCC. Cancer Epidemiol. Biomarkers Prev. 26, 795–803 (2017). [DOI] [PMC free article] [PubMed] [Google Scholar]
- 43.Liu XE et al. N-glycomic changes in hepatocellular carcinoma patients with liver cirrhosis induced by hepatitis B virus. Hepatology 46, 1426–1435 (2007). [DOI] [PubMed] [Google Scholar]
- 44.Shultz M et al. The tumor-associated glycosyltransferase ST6Gal-I regulates stem cell transcription factors and confers a cancer stem cell phenotype. Cancer Res. 76, 3978–3988 (2016). [DOI] [PMC free article] [PubMed] [Google Scholar]
- 45.Buck CA, Glick MC & Warren L Glycopeptides from the surface of control and virus-transformed cells. Science (80-. ). 172, 169–171 (1971). [DOI] [PubMed] [Google Scholar]
- 46.Christiansen MN et al. Cell surface protein glycosylation in cancer. Proteomics 14, 525–546 (2014). [DOI] [PubMed] [Google Scholar]
- 47.Taniguchi N & Kizuka Y Glycans and cancer: Role of N-Glycans in cancer biomarker, progression and metastasis, and therapeutics. in Advances in Cancer Research vol. 126 11–51 (Academic Press Inc., 2015). [DOI] [PubMed] [Google Scholar]
- 48.Wang X et al. Core fucosylation regulates epidermal growth factor receptor-mediated intracellular signaling. J. Biol. Chem. 281, 2572–2577 (2006). [DOI] [PubMed] [Google Scholar]
- 49.Lau KS et al. Complex N-Glycan Number and Degree of Branching Cooperate to Regulate Cell Proliferation and Differentiation. Cell 129, 123–134 (2007). [DOI] [PubMed] [Google Scholar]
- 50.Dennis JW, Laferté S, Waghorne C, Breitman ML & Kerbel RS β1–6 branching of Asn-linked oligosaccharides is directly associated with metastasis. Science (80-. ). 236, 582–585 (1987). [DOI] [PubMed] [Google Scholar]
- 51.Partridge EA et al. Regulation of cytokine receptors by golgi N-glycan processing and endocytosis. Science (80-. ). 306, 120–124 (2004). [DOI] [PubMed] [Google Scholar]
- 52.Mehta AS et al. Application of the Doylestown algorithm for the early detection of hepatocellular carcinoma. PLoS One 13, 1–12 (2018). [DOI] [PMC free article] [PubMed] [Google Scholar]
- 53.Parikh ND et al. Biomarkers for the Early Detection of Hepatocellular Carcinoma. Cancer Epidemiol. Biomarkers Prev. 29, 2495–2503 (2020). [DOI] [PMC free article] [PubMed] [Google Scholar]
- 54.Drake RR et al. MALDI Mass Spectrometry Imaging of N-Linked Glycans in Cancer Tissues. in Advances in Cancer Research vol. 134 85–116 (Academic Press Inc., 2017). [DOI] [PMC free article] [PubMed] [Google Scholar]
- 55.Blomme B, Van Steenkiste C, Callewaert N & Van Vlierberghe H Alteration of protein glycosylation in liver diseases. J. Hepatol. 50, 592–603 (2009). [DOI] [PubMed] [Google Scholar]
- 56.Marrero JA et al. α-Fetoprotein, Des-γ Carboxyprothrombin, and Lectin-Bound α-Fetoprotein in Early Hepatocellular Carcinoma. Gastroenterology 137, 110–118 (2009). [DOI] [PMC free article] [PubMed] [Google Scholar]
- 57.Wang M et al. Biomarker analysis of fucosylated kininogen through depletion of lectin reactive heterophilic antibodies in hepatocellular carcinoma. J Immunol Methods 462, 59–64 (2018). [DOI] [PMC free article] [PubMed] [Google Scholar]
- 58.Singal AG et al. Doylestown Plus and GALAD Demonstrate High Sensitivity for HCC Detection in Patients with Cirrhosis. Clin. Gastroenterol. Hepatol. (2021) doi: 10.1016/j.cgh.2021.04.018. [DOI] [PMC free article] [PubMed] [Google Scholar]
- 59.Rich NE et al. Hepatocellular Carcinoma Demonstrates Heterogeneous Growth Patterns in a Multicenter Cohort of Patients With Cirrhosis. Hepatology 72, 1654–1665 (2020). [DOI] [PMC free article] [PubMed] [Google Scholar]
Associated Data
This section collects any data citations, data availability statements, or supplementary materials included in this article.