
Figure 8. Effect of baseline on crystallinity.
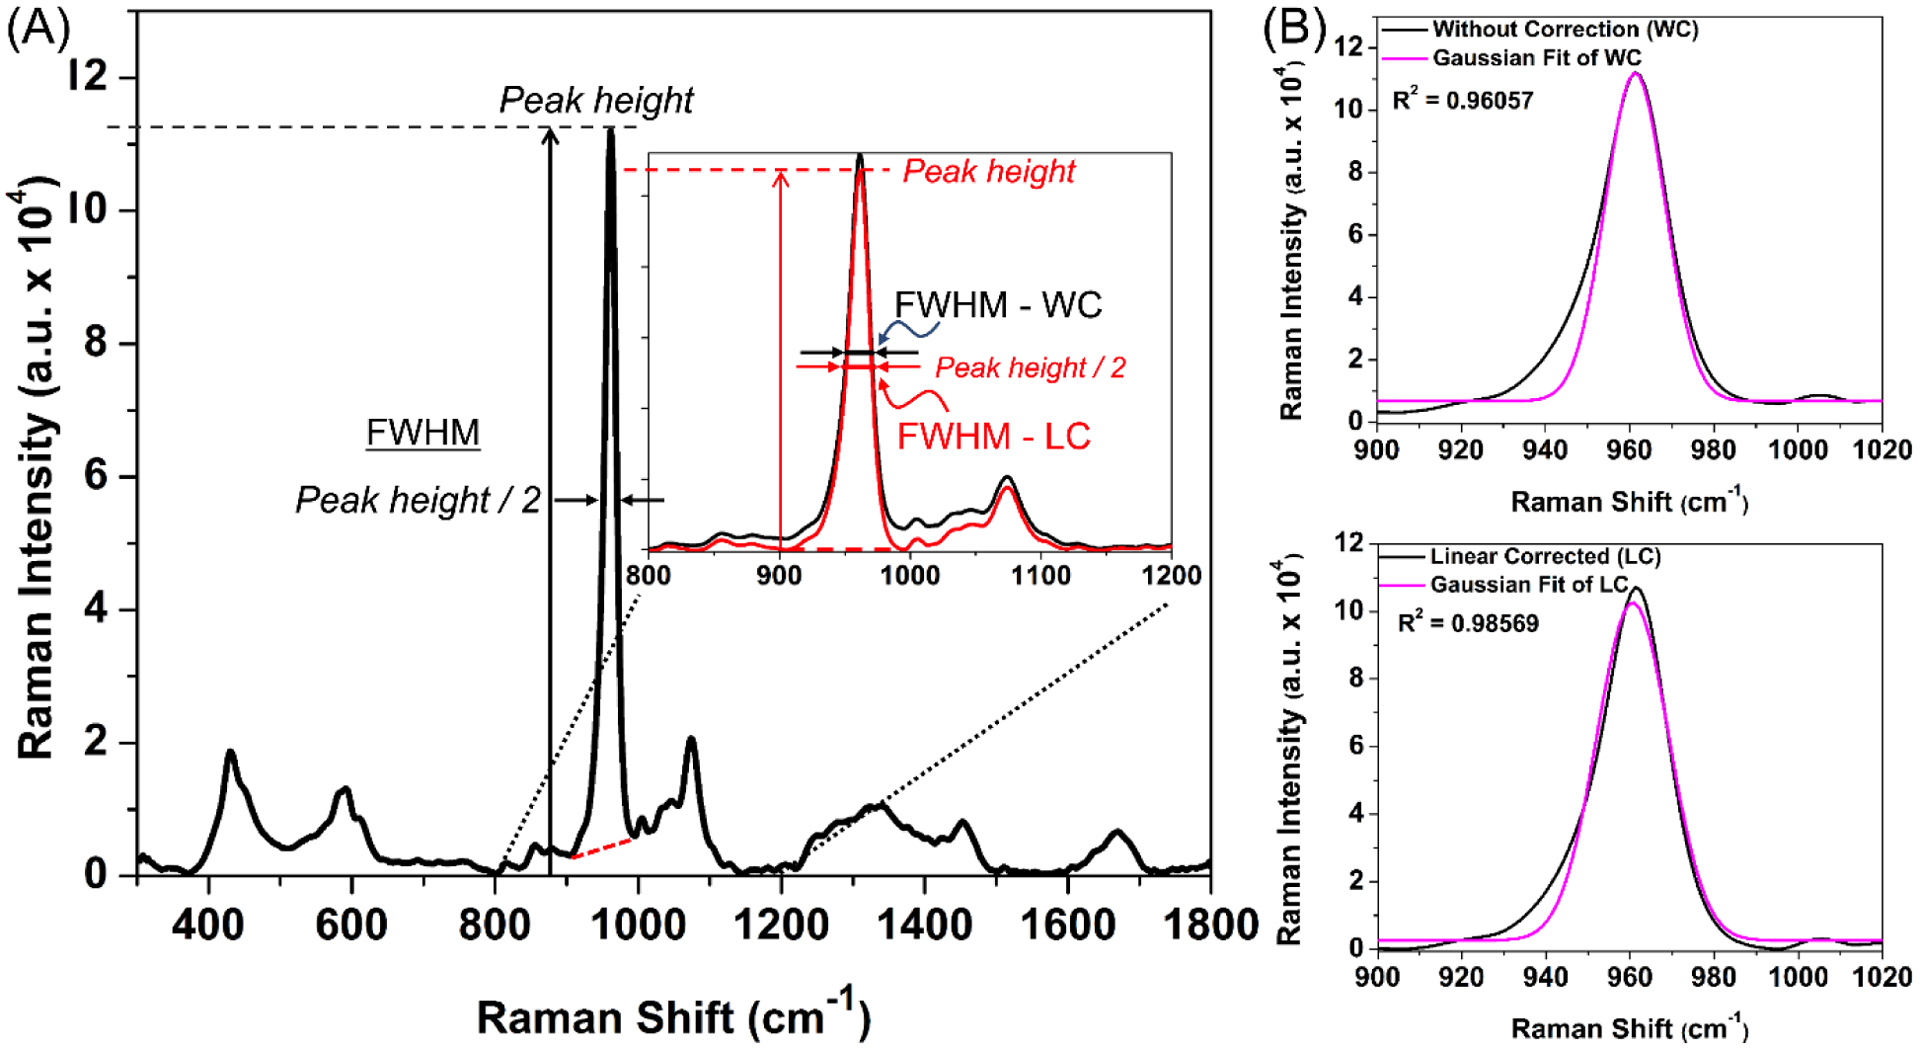
When a local linear baseline (red line) ‘corrects’ the height of the ν1 phosphate peak at ~960 cm−1, the FWHM decreases meaning crystallinity increases (A). This linear correction (LC) also increases the correlation of determination (R2) of the fit of the Gaussian curve to the peak (B) when compared to a fit without correction (WC).