

Abstract
Multiple sclerosis (MS) is a neuroinflammatory disorder leading to chronic disability. Brain lesions in MS commonly arise in normal-appearing white matter (NAWM). Genome-wide association studies (GWAS) have identified genetic variants associated with MS. Transcriptome alterations have been observed in case-control studies of NAWM. We developed a Cross-Dataset Evaluation (CDE) function for our network-based tool, Edge-Weighted Dense Module Search of GWAS (EW_dmGWAS). We applied CDE to integrate publicly available MS GWAS summary statistics of 41,505 cases and controls with collectively 38 NAWM expression samples, using the human protein interactome as the reference network, to investigate biological underpinnings of MS etiology. We validated the resulting modules with colocalization of GWAS and expression quantitative trait loci (eQTL) signals, using GTEx Consortium expression data for MS-relevant tissues: 14 brain tissues and 4 immune-related tissues. Other network assessments included a drug target query and functional gene set enrichment analysis. CDE prioritized a MS NAWM network containing 55 unique genes. The gene list was enriched (p-value = 2.34×10⁻⁷) with GWAS-eQTL colocalized genes: CDK4, IFITM3, MAPK1, MAPK3, METTL12B and PIK3R2. The resultant network also included drug signatures of FDA-approved medications. Gene set enrichment analysis revealed the top functional term “intracellular transport of virus”, among other viral pathways. We prioritize critical genes from the resultant network: CDK4, IFITM3, MAPK1, MAPK3, METTL12B and PIK3R2. Enriched drug signatures suggest potential drug targets and drug repositioning strategies for MS. Finally, we propose mechanisms of potential MS viral onset, based on prioritized gene set and functional enrichment analysis.
Keywords: multiple sclerosis (MS), genome-wide association studies (GWAS), normal-appearing white matter (NAWM), Dense Module Search of GWAS (EW_dmGWAS), expression quantitative trait loci (eQTL)
INTRODUCTION
Multiple sclerosis (MS) is a neuroinflammatory disease characterized by autoimmune attacks on the myelin sheaths of central nervous system (CNS) neurons. MS affects nearly one million people in the United States who are typically 20 to 40 years old when diagnosed, and it is one of the leading causes of disability in young adults (Wallin et al., 2019). MS lesions commonly affect the CNS white matter, but the normal-appearing white matter (NAWM) surrounding MS lesions may also be microscopically damaged (Moll et al., 2011). MS pathogenesis mechanisms may begin in the NAWM (van der Poel et al., 2019; Zeis et al., 2008). Different immune cell subsets have been described in the inflamed CNS and contribute to the pathophysiology of MS, including lymphocytes, macrophages, and resident microglial cells (Jordão et al., 2019). The suspected environmental trigger in MS is unknown, and the determination of genetically predisposing factors continues to be a popular area of research. It is hypothesized that immune response activation is stimulated by a viral infection leading to a T cell auto-reactivity process involving molecular mimicry (Dendrou et al., 2015). Some findings support the hypothesis of viral involvement, as Epstein Barr Virus (EBV) infection has been linked to MS risk. Furthermore, genetic risk factors may affect the immune response against EBV infection in MS (Agostini et al., 2018). Another hypothesis is that epigenetic factors, such as methylation, contribute to the onset of the disease by dysregulating genes in MS (Koch et al., 2013).
Studying genetic factors of MS may aid to better understand the etiology of this elusive disorder, given that hereditary patterns have been observed. Genome-wide association studies (GWAS) in particular have successfully identified several genetic loci associated with MS by screening the genotypes of large population samples (Dendrou et al., 2015; Jordão et al., 2019). For instance, the latest GWAS of MS has identified more than 200 variants/loci associated with MS by screening the genotypes of a population of 47,429 MS cases and 68,374 control subjects (Patsopoulos et al., 2019). However, the context in which these associations manifest the molecular changes remains unclear (Patsopoulos et al., 2019). The gene expression profiling of disease-related tissues of MS has revealed differentially expressed genes in MS (Hendrickx et al., 2017; van der Poel et al., 2019), while the roles that genetic factors play during the disease pathogenesis are still elusive. Integrating the disease-related tissue expression with GWAS signals can aid in understanding the biological basis of disease-associated genetic variants (Yan et al., 2020).
Previously, we conducted a network analysis of MS GWAS data sets from 2009 and 2011 (Manuel et al., 2020). We successfully linked GWAS signals to viral infection hypothesis of MS etiology, as well as MS drug targets. Here, we focus on the NAWM as an important and meaningful tissue type in MS (Moll et al., 2011; Zeis et al., 2008), which may provide further insights into mechanisms of MS onset and MS drugs. As network-based analyses can aid in detecting combinatory signals of identified genomic and transcriptomic annotations, we integrate the largest, publicly available MS GWAS dataset with gene expression profiles of MS NAWM post-mortem brain tissue, and use the human protein interactome as the reference network (Patsopoulos et al., 2019). We apply the Edge-Weighted Dense Module Search of GWAS (EW_dmGWAS) algorithm to perform this integrative network-based study in efforts to depict underlying MS mechanisms from biological data (Wang et al., 2015). By following the EW_dmGWAS algorithm, nodes of network modules are weighted by GWAS signals, and edges are weighted by differential gene co-expression (Wang et al., 2015). This algorithm can effectively combine the genetic association signals at the DNA (genetic variants from GWAS) and RNA (transcriptomic profiles) levels.
Another aim of this study is to perform a novel network-based evaluation to identify consistent signals of MS NAWM gene expression datasets, by integrating with a well powered MS GWAS dataset. To overcome the common flawed reproducibility issue with gene expression profiling (Zhang et al., 2008), we develop and apply a cross-dataset evaluation (CDE) function to identify replicated results and deliver more reproducible outcomes.
MATERIALS AND METHODS
We consider gene-expression datasets derived from MS NAWM and independently integrate each dataset with the largest up-to-date MS GWAS summary statistics data (Patsopoulos et al., 2019). Our EW_dmGWAS version 3.0 tool was used for this network-based integrative study (Wang et al., 2015). To construct the human protein interactome, multiple sources were integrated by compilation of experimentally validated human protein-protein interactions (PPIs). The compiled PPIs originated from the following sources: BioGRID (Oughtred et al., 2019), ESCAPE (Xu et al., 2013), HINT (Das and Yu, 2012), IRefIndex (Razick et al., 2008), ReactomeFI (Croft et al., 2011), and STRING (Szklarczyk et al., 2019). Two gene expression datasets of MS NAWM, with matched controls, were gathered from the Gene Expression Omnibus (GEO) database, which collectively included 38 MS NAWM and matched control post-mortem brain tissue samples (Barrett et al., 2013; Hendrickx et al., 2017; van der Poel et al., 2019). The first gene expression study, considered as the discovery dataset in the present work, performed whole transcriptome shotgun sequencing (RNA-seq) on 10 samples of isolated microglia from MS NAWM and 11 matched controls (van der Poel et al., 2019). The other dataset, considered as the evaluation dataset, comprised microarray profiles of 7 samples of chronic active perilesional MS NAWM and 10 matched controls (Hendrickx et al., 2017). Subsequently, we developed a Cross-Dataset Evaluation (CDE) feature for EW_dmGWAS to detect replicated results in both the discovery and evaluation MS NAWM expression datasets. Lastly, we evaluate our resulting networks with several enrichment analyses: MS FDA-approved drug target enrichment, enrichment of GWAS-eQTL colocalization genes, and gene set enrichment analysis.
GWAS-based node weight calculations
We collected the most recent GWAS summary statistics with the largest samples for MS so far, conducted by the International Multiple Sclerosis Genetics Consortium (IMSGC), which was made publicly available at its website (http://imsgc.net/, Patsopoulos et al., 2019). This IMSGC GWAS summary statistics dataset included 41,505 individuals (14,802 MS cases and 26,703 controls) of European descent. The publicly available GWAS summary statistics collected pertained to the discovery cohort of the recent MS GWAS. The genotype data were imputed by the original IMSGC study, based on the 1000 Genomes Projects (1KGP) European Panel (Patsopoulos et al., 2019). In total, the GWAS summary statistics included association results for a total of 8,868,766 single nucleotide polymorphisms (SNPs), including those on the X chromosome, either genotyped or imputed (INFO > 0.1).
Nodes within our networks represented genes weighted by gene-level p-values (pg), which were calculated by the Pathway Scoring Algorithm (Pascal) from IMSGC GWAS summary statistics (Lamparter et al., 2016). Considering the potential biases from gene length, SNP density and the local linkage disequilibrium (LD) structure (1KGP Europeans), Pascal utilizes the sums of chi-squares to combine all SNPs in the gene body and 50 kb up- and down-stream of the gene body. We further excluded those genes failed the quality control (i.e. too few SNPs were observed for the corresponding genes). The GWAS-based node weights (v), representing vertices in networks, were obtained by transferring pg to z-scores, following the normal distribution function.
Edge weight calculation from NAWM tissue expression
Pearson correlation coefficient (PCC) values were used to generate gene co-expression matrices for MS NAWM cases and controls. To quantify the RNA-seq expression, we obtained the Reads Per Kilobase of transcript, per Million mapped reads (RPKM). We used log2(RPKM +1) values for the RNA-seq discovery set and microarray intensities for the evaluation set. PCC values of gene-gene co-expression corresponding to PPIs from our human protein interactome compilation were matched. Fisher’s Transformation of PCC values was performed for normalization, and the Fisher’s Test of Differing Conditions was conducted for MS NAWM cases versus controls of gene expression, as previously described (Wang et al., 2015). Edge weight z-scores (e) and respective p-values (pe) were transferred from Fisher statistic values, following the normal distribution (Wang et al., 2015). Differential co-expression was defined by edge weight scores transferring below the nominal p-value (pe < 0.05; |e| > 1.96). Lastly, all genes with attainable GWAS-based node weights, human PPIs and differential co-expression edge weights were matched. Custom scripts coded in the R programming language, which may be found in the GitHub repository (https://github.com/astrika/MS_NAWM_CrossDatasetEvaluation), performed all statistical analyses for edge weight calculations and node weight matching.
Implementation of EW_dmGWAS for gene module identification
Node weights and edge weights of respective genes and PPIs were input for EW_dmGWAS. A dense module searching method was used to score modules by
where S represents the module score, E represents the set of edges, e represents each edge weight, V represents the set of nodes, v represents each node weight, and λ is a scaling factor for GWAS and gene-expression values (Wang et al., 2015). In this work, we used λ = 1. When we used the parameter λ = 1, we assumed the genetic factors and expression factors contributed equally to the module network, though such weights can be adjusted under specific cases. Lastly, modules were ranked by EW_dmGWAS based on 1,000 permutations of signal-enrichment from both genomic and gene expression profiling of MS cases and controls. In summary, interactions between genes were considered edges within our networks, resulting from annotations of human PPIs and enhanced by differential genetic co-expression in MS NAWM cases versus controls.
Cross-Dataset Evaluation (CDE) framework
This newly developed CDE feature identifies consistently enriched signals for both a discovery expression dataset and an evaluation expression dataset, in conjunction with trait-associated GWAS summary statistics. In this study, the CDE feature assesses overlapping signals of independent MS NAWM expression datasets, also considering MS genomic variations as an anchoring factor, as nodes remained weighted by IMSGC GWAS. The MS NAWM RNA-seq dataset was considered the discovery set, as RNA-seq experiments show higher specificity than microarray assays (Wang et al., 2009). The MS NAWM microarray dataset was considered the evaluation set. The module list of the discovery set was the input for the CDE algorithm. Edge scores of each module in module list were recalculated based on evaluation set (co-expression values of MS NAWM microarray data). We used the same node weights, calculated from the 2019 MS GWAS, for both the discovery set and the evaluation set. New evaluation module scores were obtained by computing the sum of node scores and edge scores, considering the same scaling of edge scores used in the discovery set analysis. The resulting CDE modules output by CDE were only those overlapping above the 97.5% quantile of discovery set permutation module scores and newly ascertained evaluation module scores. The CDE algorithm was coded in a custom R script, which may be accessed at https://github.com/astrika/MS_NAWM_CrossDatasetEvaluation.
MS GWAS-eQTL colocalization using disease-relevant GTEx tissues
We conducted GWAS-eQTL colocalization by using a Bayesian method (Giambartolomei et al., 2014). This method evaluates whether the GWAS and eQTL associations best fit a model in which the associations are due to a single shared variant (summarized by the posterior probability). Firstly, we parsed all genome-wide significant (p < 5 × 10⁻⁸) SNPs. The SNPs were LD-pruned by plink (r2 < 0.1) on 1KPG European panel following the methods in Patsopoulos’s work (Patsopoulos et al., 2019; Purcell et al., 2007). Tag SNP region was identified by r2 > 0.8 for each index LD-pruned SNPs. We further excluded those tag SNP regions overlapped with the MHC region (Chr. 6: 24–35 Mbp, hg19 Genome Assembly). For eQTL data, we used 18 tissues including all 14 brain tissues and 4 immuno-related tissues in GTEx V7 (data accessed by 06/15/2018) (Lonsdale et al., 2013). We systematically implemented the colocalization analysis for the 500-kb window around each Tag SNP region using eQTL from these 18 MS related tissues (GTEx V7) and MS summary statistics (Giambartolomei et al., 2014). A posterior probability (H4) of colocalization ≥ 0.8 was considered as strong evidence for a causal gene. The causal genes with strong evidence of colocalization (H4 ≥ 0.8) are referred to as egenes. We report these intersected “causal” signals (eQTL and GWAS) and the corresponding egenes in Supplementary Table 1.
Assessment of prioritized gene modules by distinct enrichment analyses
Gene sets pertaining to the prioritized modules of CDE, as well as top 100 ranking modules of each independent gene expression data, were each assessed through gene set enrichment analysis (GSEA) using ToppGene (Kaimal et al., 2010), based on Gene Ontology (GO) Biological Process annotations (Gene Ontology Consortium, 2004). We used the GO Biological Process annotations because these terms have been commonly considered as biological pathways in the gene set enrichment analysis (Wang et al., 2011; Jia et al., 2012). The gene set size was set between 5 and 500 genes to avoid too general or too small GO terms to be analyzed. GSEA results were then filtered to include only the terms with at least 3 contributing genes from the query gene list and with Benjamini-Hochberg adjusted p-value (false discovery rate, FDR) being < 0.05 (Benjamini and Hochberg, 1995).
We collected a comprehensive list of FDA-approved drugs for MS, and their respective drug targets from DrugBank database annotations (downloaded by 03/11/2019) (Wishart et al., 2018). A query was conducted for assessment of module genes, which considered any 32 target genes of MS FDA-approved drugs within top modules. To check potential drug targets, we also performed a query with annotated drug pathways from the “FDA-approved drugs collection” of the Drug Signature Database (DSigDB) (assessed by 02/27/2020) (Yoo et al., 2015). We further computed hypergeometric enrichment, to assess overlapping genes between our modules and Drug Signatures (Hahne et al., 2008). Lastly, to provide more genetic evidence for our resultant CDE network, gene sets were cross-referenced with 111 significant eQTL genes.
RESULTS
Network modules with GWAS-based node weights and expression-based edge weights
We compiled the reference network from various sources (see Methods), which included 21,139 genes and 412,494 experimentally validated human PPIs. Next, the gene-based association analysis was performed independently of PPI network compilation, by consideration of solely the IMSGC GWAS SNP-level data. Pascal scoring of IMSGC GWAS summary statistics yielded 21,762 successfully (denoted “SUCCESS” by Pascal) attained gene-level p-values (pg). RNA-seq differential co-expression profiles in MS NAWM microglia produced 305,173 edge weight values matched to human PPI interactions involving 13,964 unique genes. EW_dmGWAS yielded 1,996 modules with scores (Sm) greater than 2.46 and less than 15.60 for the RNA-seq discovery set. When filtering values of differential co-expression in microarray profiling of active perilesional MS NAWM (evaluation set), we matched 15,316 GWAS-based node weights with 322,728 human PPI edge weights. EW_dmGWAS yielded 2,101 modules (2.39 < Sm < 15.70) for the evaluation set.
With the scaling factor λ=1, the GWAS-based node weights accounted for a higher proportion in the module score because there were differences in the distributions of node weights versus edge weights (Supplementary Figure 1). In this way, higher weights were applied to the dataset with higher statistical power, given that the MS GWAS had a much larger sample size than the expression datasets.
Top modules of independent analyses present drug target genes of MS medications
The top 100 ranking modules of the RNA-seq discovery dataset exhibited permutation scores (Zperm) greater than 7.22, containing 196 unique genes. Notably, this gene set included gene HDAC1 [GWAS gene-based p-value (pg) = 4.71 × 10⁻⁵] (Figure 1A). HDAC1 is the molecular target of FDA-approved MS drug Fingolimod. HDAC1 presented differential co-expression with the genes STAT3 (pg = 3.09 × 10⁻¹²) and MORF4L1 (pg = 5.10 × 10⁻⁵), as shown in Figure 1B. Some sparse correlations were observed in Figure 1B due to the small sample size of the MS NAWM discovery dataset. To examine the sparse correlations, and to avoid the potential impact of extreme points, we used rank-based Spearman correlation. Although there were slight differences in the Pearson and Spearman correlations, all negative correlations remained negative, while all positive correlations also remained positive (Supplementary Figure 2). Other MS drug targets present in top 100 modules of discovery set included IFNAR1 (pg = 2.05 × 10⁻⁴), KEAP1(pg = 2.31 × 10⁻⁹) and RELA (pg = 6.77 × 10⁻⁶), none of which were reported in the original gene expression studies (Supplementary Figure 3A–D).The top 100 ranking modules of the evaluation set yielded Zperm > 7.47. They comprised 199 non-redundant genes, including target genes of MS medications: KEAP1 (pg = 2.31 × 10⁻⁹) and RELA (pg = 6.77 × 10⁻⁶). These two genes were not reported in the original gene expression study (Supplementary Figure 3E–F).
Figure 1. Top module of MS NAWM discovery set presents HDAC1, drug target of MS medication fingolimod.
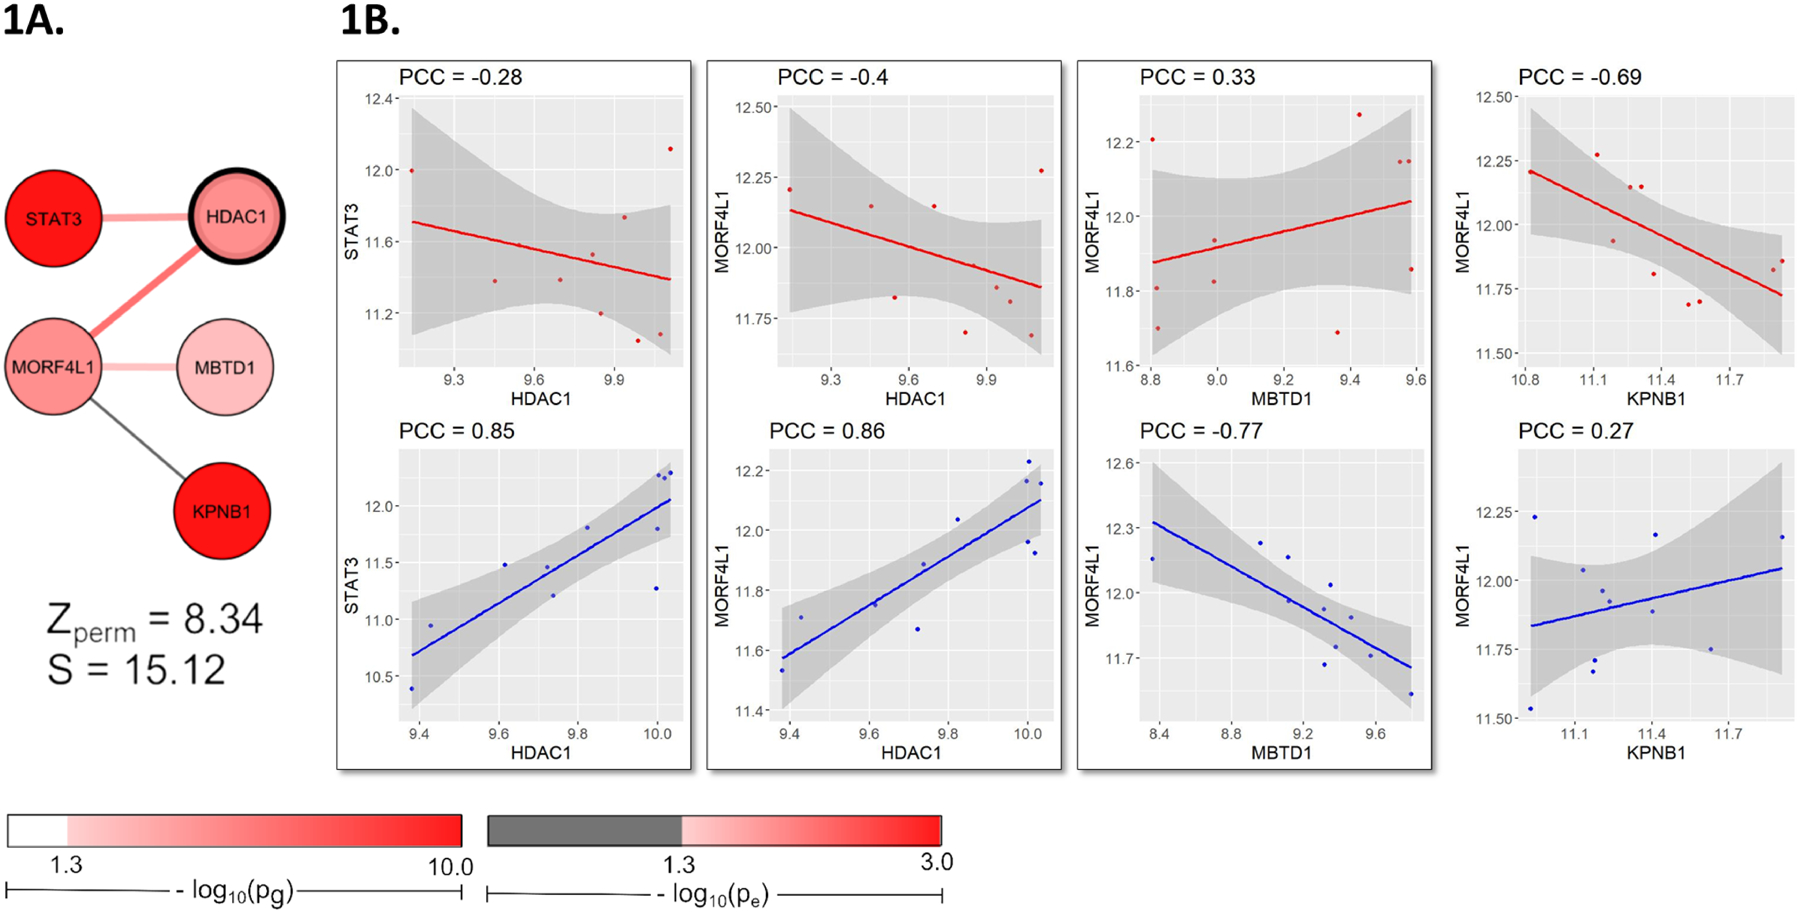
(A) HDAC1 showed differential co-expression with STAT3 (pg = 3.09 × 10⁻¹²) and MORF4L1 (pg = 5.10 × 10⁻⁵) in the 5th top ranked module of discovery set. (B) Differential co-expression between HDAC1 and STAT3 presented a Pearson Correlation Coefficient (PCC) in MS NAWM microglia (PCCMS) as −0.28, as opposed to the strong positive co-expression relationship observed with a PCC in control samples (PCCCtrl) of 0.85. These different PCC values of co-expression between HDAC1 and STAT3 yielded an edge weight (e) of 2.27, which transfers to a p-value (pe) of 0.02 (by the normal distribution function), representing a differential co-expression relationship. The genes HDAC1 and MORF4L1 presented a similar differential co-expression relationship (PCCMS = − 0.39, PCCCtrl = 0.86, e = 2.62, pe = 0.008).
CDE identified replicated differential expression relationships in MS NAWM datasets
Cross-Dataset Evaluation of NAWM expression datasets prioritized 19 modules comprising 55 non-redundant genes from the 1,996 discovery set modules identified. These 19 modules were prioritized by our CDE analysis because their calculated discovery and evaluation module scores overlapped over the 97.5% quantile (Figure 2A). From the 19 modules depicted by CDE, we selected the module with the highest sum of edge scores in both discovery set and evaluation set as the top-ranked module (Figure 2B). We considered the module with the highest sum of edge scores because edge scores represent differential co-expression, a key part of the CDE analysis. Intriguingly, this module showed a similar differential co-expression relationship between the genes TEC (pg = 2.11 × 10⁻⁶) and VAV1 (pg = 7.21 × 10⁻⁴) in both the discovery set and evaluation set modules (Figure 2C). Nine other differential co-expression relationships were present in the prioritized CDE modules (Supplementary Table 2).
Figure 2. Reproduced differential expression relationship between TEC and VAV1 in discovery and evaluation sets of MS NAWM expression.
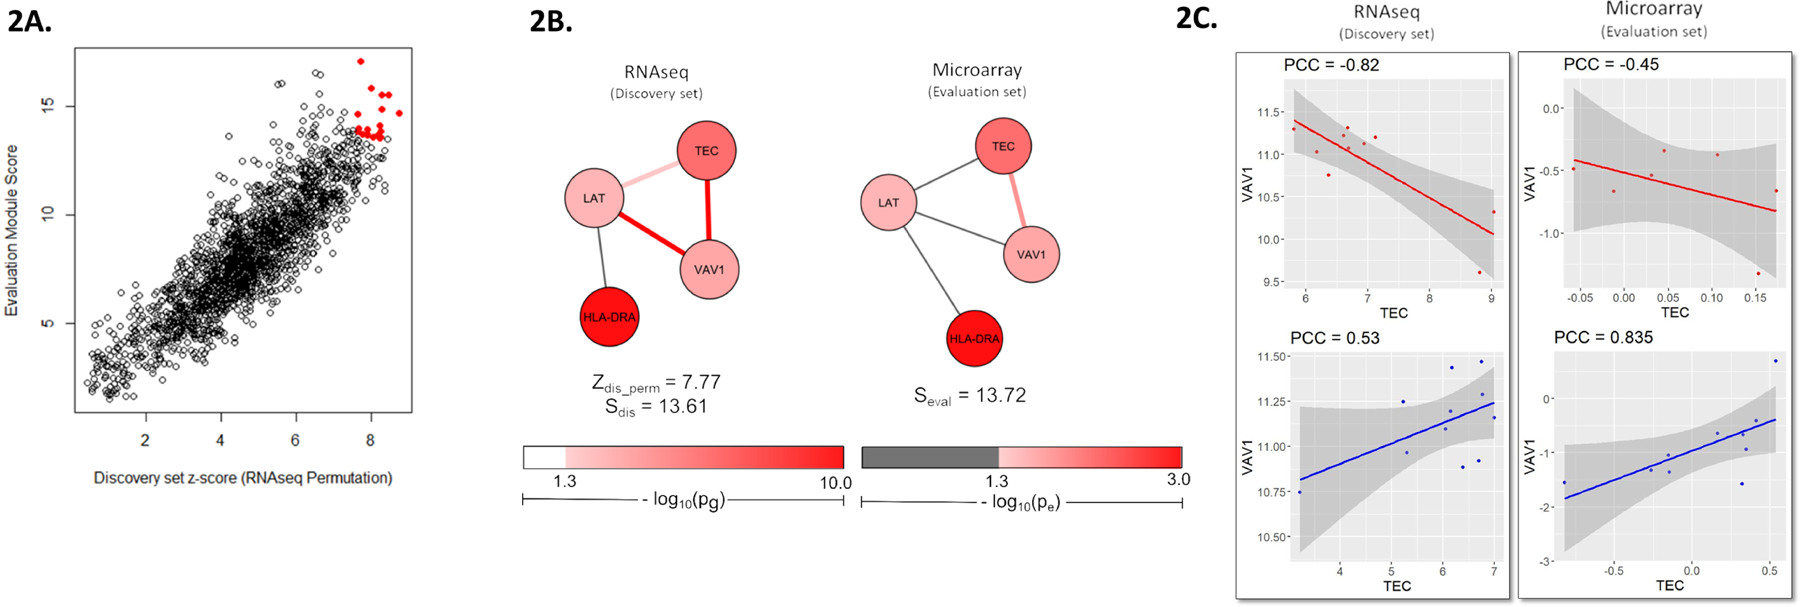
(A) Red coordinates represent the resultant modules of CDE analysis, which overlapped over the 97.5 % quantile of discovery set module permutation scores and evaluation module scores. (B) Top module of CDE is shown. The discovery set module is plotted based on differential co-expression in RNA-seq dataset; the evaluation set module was plotted based on microarray dataset. (C) TEC and VAV1 showed a negative PCCMS of −0.82 and a positive PCCCtrl of 0.53, yielding an edge score (e) of 2.66 and a p-value (pe) of 0.008. Similarly, in the evaluation set, TEC and VAV1 displayed a negative PCCMS of −0.45 and a positive PCCCtrl of 0.84 (e = 2.14, pe = 0.03). Connections were also exhibited between VAV1 and LAT (pg =3.30 × 10⁻³; PCCMS = 0.90, PCCCtrl = −0.26, e = 2.66, pe = 0.008) and between LAT and TEC (PCCMS = −0.92, PCCCtrl = −0.26, e = 1.98, pe = 0.05).
Enrichment of MS GWAS-eQTL colocalized genes in resultant gene networks
The MS GWAS-eQTL colocalization analysis (see Methods) identified 111 genes with GWAS-eQTL pairs, which are reported in Supplementary Table 1. Sixty of 111 significant colocalized genes were present in the discovery expression dataset. Of these 60 colocalized genes, seven presented in the top 2.5 % discovery set modules (containing 105 genes), yielding an enrichment with a p-value of 1.03 × 10⁻⁶ (Fisher’s Exact Test). When considering the evaluation set, 64 of 111 significant colocalized genes were included in the node and edge weight input. From these 64 colocalized genes, 6 were included in the resulting top 2.5% modules of evaluation set, which showed a significant overrepresentation (p-value = 1.77 × 10⁻⁵, Fisher’s Exact Test). Lastly, the input of the discovery set of CDE included 60 of 111 colocalized genes, of which six were found in the top 2.5% overlapping CDE modules (containing 55 genes). This exhibited a 24.97-fold enrichment with the colocalized genes (p-value = 1.20 × 10⁻⁷, hypergeometric test). These six colocalized genes were: CDK4 (pg =3.28 × 10⁻¹²), IFITM3 (pg =4.40 × 10⁻¹¹), MAPK1 (pg =3.04 × 10⁻¹¹), MAPK3 (pg =3.38 × 10⁻⁷), METTL21B (pg =1.94 × 10⁻¹¹) and PIK3R2 (pg = 4.28×10⁻¹²). Table 1 summarizes all respective MS-associated eQTL tissues for which these genes showed colocalization, including 14 brain tissues and 4 immune-related tissues. The gene IFITM3 in particular presented colocalization pairs in 8 of 14 brain tissues. Strikingly, METTL21B showed colocalization pairs in all MS-relevant GTEx tissues that we examined. Tag SNP identified the colocalization pairs between MS GWAS and the GTEx tissues (Figure 3).
Table 1:
GTEx tissues of MS GWAS-eQTL colocalization and corresponding posterior probability (H4) values
| Posterior probability of gene | ||||||
|---|---|---|---|---|---|---|
| GTEx tissue | CDK4 | IFITM3 | MAPK1 | MAPK3 | METTL21B | PIK3R2 |
| Amygdala | - | 0.935 | - | - | 0.951 | - |
| Anterior cingulate cortex | - | 0.921 | - | - | 0.948 | - |
| Caudate basal ganglia | - | 0.992 | - | - | 0.949 | - |
| Cerebellar hemisphere | - | - | - | 0.950 | - | |
| Cerebellum | - | 0.876 | - | - | 0.947 | 0.938 |
| Cortex | - | - | - | 0.819 | 0.946 | - |
| Frontal cortex | - | - | - | 0.969 | 0.948 | - |
| Hippocampus | - | - | - | - | 0.953 | - |
| Hypothalamus | 0.917 | 0.952 | - | - | 0.950 | - |
| Nucleus accumbens basal ganglia | - | 0.992 | - | - | 0.948 | - |
| Pituitary | - | - | - | - | 0.949 | - |
| Putamen basal ganglia | - | 0.990 | 0.802 | - | 0.945 | - |
| Spinal cord cervical | - | - | - | - | 0.946 | - |
| Substantia niagra | - | 0.947 | - | - | 0.960 | - |
| Lung | - | - | - | 0.852 | 0.946 | - |
| Small intestine terminal ileum | - | - | - | - | 0.929 | - |
| Spleen | - | - | - | 0.950 | 0.944 | - |
| Whole blood | - | - | - | 0.977 | 0.949 | - |
data is not available.
Figure 3. MS GWAS-eQTL colocalization examples.
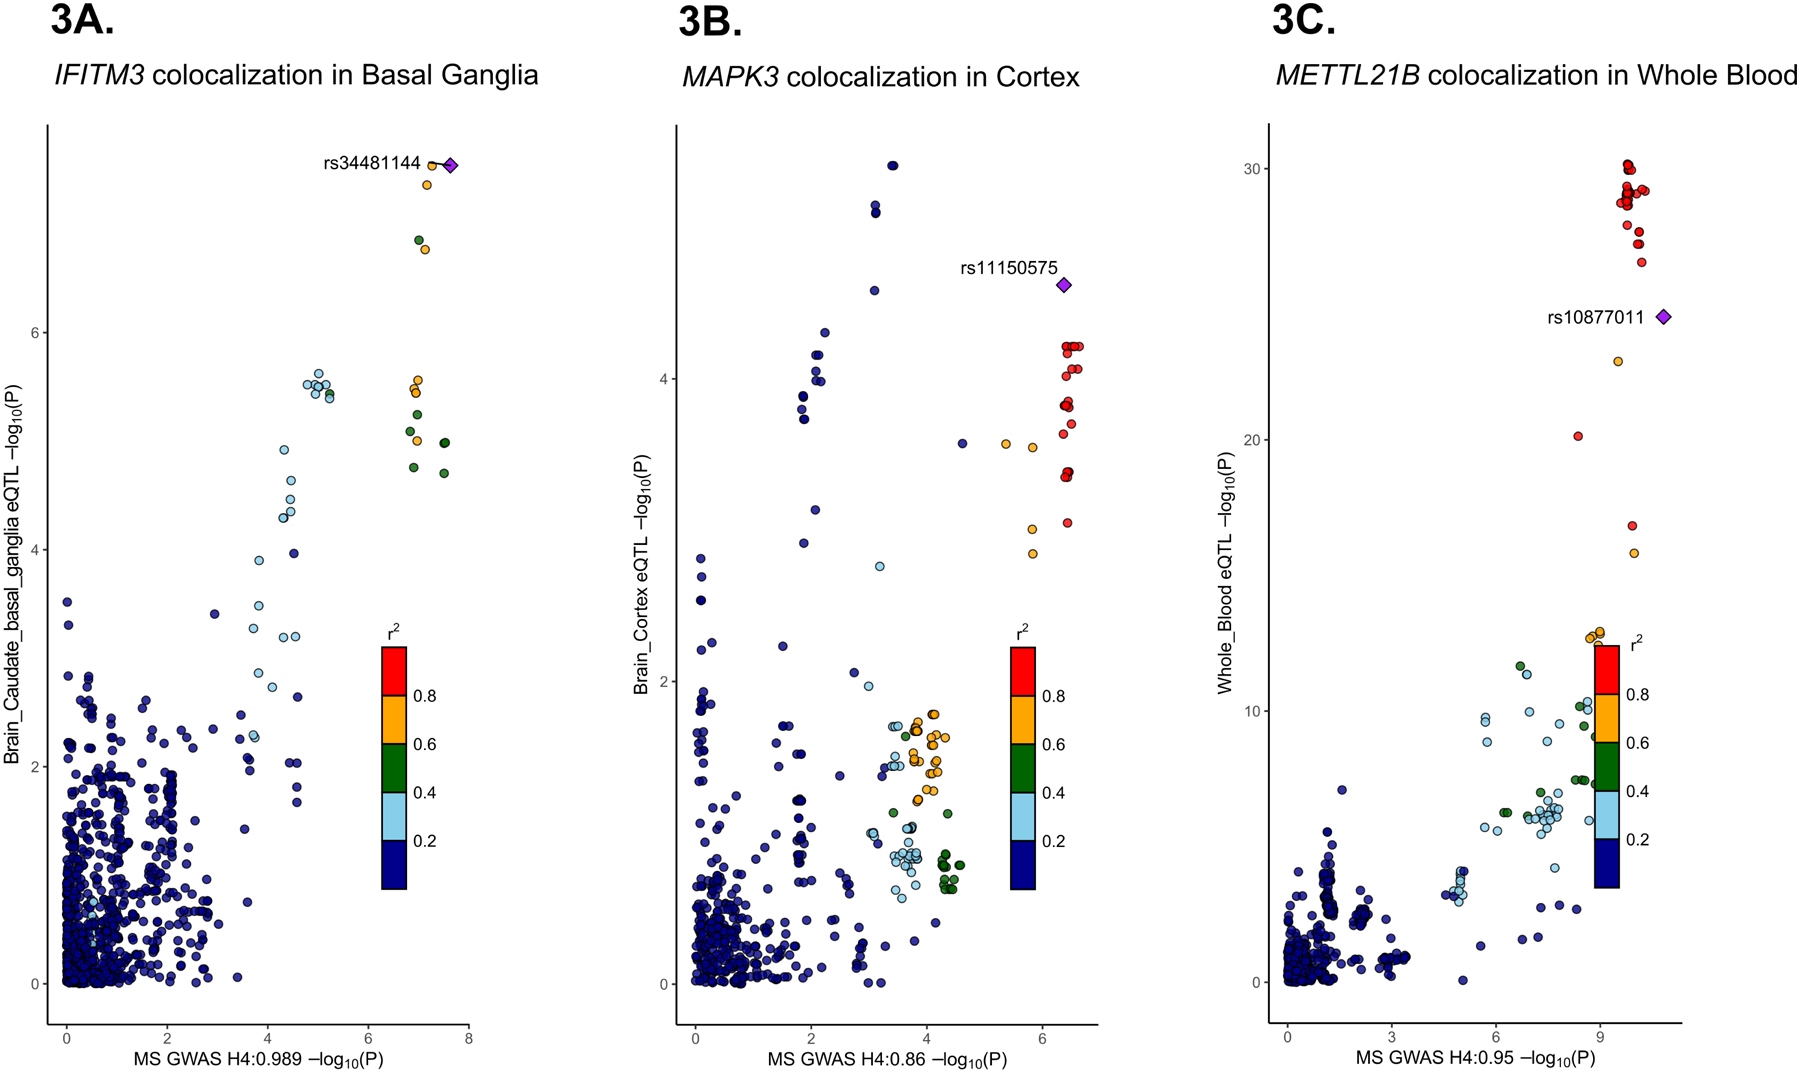
(A) The tag SNP rs34481144 identified the GWAS-eQTL colocalization pair for IFITM3 in basal ganglia expression. (B) The tag SNP rs1110575 identified the GWAS-eQTL colocalization pair for MAPK3 in cortex expression. (C) The tag SNP rs10877011 identified the GWAS-eQTL colocalization pair for METT2L1B in whole blood expression.
Functional gene set enrichment analysis of CDE network
The prioritized gene set by the CDE feature of EW_dmGWAS was highly enriched with several GO Biological Processes terms (Supplementary Table 3). The top enriched term was “JAK-STAT cascade involved in growth hormone signaling pathway” (FDR = 4.54×10⁻⁷) with 5 contributing genes: JAK2, MAPK1, MAPK3, STAT3, and STAT5A. Among top 10 enriched terms, several pathways involved in immune reactions were observed, such as “Response to granulocyte macrophage colony-stimulating factor” (FDR = 3.63×10⁻⁴), “Fc receptor mediated stimulatory signaling” (FDR = 1.17×10⁻³), and “T cell costimulation” (FDR = 6.52×10⁻³). Other top enriched terms showed involvement of viral process, such as “Response to exogenous dsRNA” (FDR = 0.011) and “Intracellular transport of virus” (FDR = 0.018).
Drug signatures of FDA-approved medications were present in CDE network
We performed enrichment analysis at a drug signature pathway level, which considered all the drug signatures annotated for a particular drug in DSigDB (Yoo et al., 2015). Several drug signatures from FDA-approved collections of DSigDB were enriched in our MS-associated CDE network (Table 2). The top enriched drug signature pathway in our network was for rubidomycin hydrochloride (FDR = 0.014), a medication indicated for acute myeloid leukemia. The second most enriched drug signature pathway was for zafirlukast (FDR = 0.014), a medication developed to treat asthma. Interestingly, the genes JAK2, MAPK1, MAPK3 and STAT3 were contributing to several of top 10 drug signature pathways.
Table 2:
Top 10 enriched FDA drug signature pathways of MS-associated gene network
| Drug name | Indication of medication | Genes contributing to drug signature pathway | Raw p-value | FDR* |
|---|---|---|---|---|
| Rubidomycin hydrochloride | Acute myeloid leukemia | HSPA1A, JAK2, MAPK1, STAT3 | 3.36 × 10⁻⁴ | 0.014 |
| Zafirlukast | Prophylaxis in asthma | KAT2A, MAPK1, MAPK3 | 4.05 × 10⁻⁴ | 0.014 |
| Podophyllotoxin | Genital warts | JAK2, STAT3, TUBB3 | 8.21 × 10⁻⁴ | 0.016 |
| Hexachlorophene | Disinfectant | KAT2A, MAPK1, MAPK3, STAT3 | 9.17 × 10⁻⁴ | 0.016 |
| Etoposide | Chemotherapy | MAPK1, MAPK3 | 3.96 ×10⁻³ | 0.053 |
| Mitoxantrone dihydrochloride | Acute myeloid leukemia | KAT2A, MAPK1 | 4.64 ×10⁻³ | 0.053 |
| Doxorubicin Hydrochloride | Acute myeloid leukemia | JAK2, MAPK1, STAT3 | 7.79 ×10⁻³ | 0.060 |
| Ruxolitinib phosphate | Myelofibrosis | JAK2 | 7.86 ×10⁻³ | 0.060 |
| Palbociclib | Breast cancer | CDK4 | 7.86 ×10⁻³ | 0.060 |
| Zalcitabine | HIV/AIDS | MAPK1 | 0.012 | 0.081 |
FDR: p-value adjusted by Benjamini-Hochberg procedure for multiple tests.
DISCUSSION
Consistency of methods exemplified by stable HDAC1 observations
We developed and applied the CDE feature not only investigate the largest MS GWAS, but also to provide supporting evidence in NAWM expression. We highlight target network modules, from which to pinpoint target genes with druggability. For instance, we emphasize the module containing HDAC1, a drug target gene of the FDA-approved MS drug fingolimod, for its presence in a top network module (Figure 1). HDAC1 was also previously identified in our network analysis of a former and smaller MS GWAS, GeneMSA GWAS (Baranzini et al., 2009; Manuel et al., 2020). The reliability of our methods is exemplified by stable observations of HDAC1 interactions in our current networks and previous work (Manuel et al., 2020). Although HDAC1 did not show association with MS (pg > 0.05) in the GeneMSA GWAS (of only 1,861 MS cases and controls), we highlighted HDAC1 as a hub gene for its interactions with other significant genes (Manuel et al., 2020). Here, we have greater power to identify the true genome-wide significance of HDAC1 (pg = 4.71 × 10⁻⁵), due to the larger sample size of the recent MS GWAS (IMSGC GWAS of 41,505 MS cases and controls) (Patsopoulos et al., 2019). Moreover, HDAC1 was differentially co-expressed with STAT3 in MS NAWM (Figure 1), which further asserts the conjecture that STAT3 is a potential drug target for MS, as we also previously indicated (Manuel et al., 2020).
Top MS-associated networks contain drug signatures of FDA-approved medications
We assessed independent gene networks, each yielded from either the RNA-seq discovery set or microarray evaluation set. The top 100 gene modules of the discovery set and evaluation set were significantly enriched (p < 0.05) with drug target genes of MS medications extracted from the DrugBank database (Wishart et al., 2018), including HDAC1 (drug target of fingolimod), IFNAR1 (drug target of interferon medications), KEAP1 and RELA (both drug targets of dimethyl fumarate) from the discovery set module list and KEAP1 and RELA from the evaluation set module list, respectively (Supplementary Figure 1). Importantly, these novel MS drug target associations were not reported by the original GWAS and gene expression studies (Hendrickx et al., 2017; Patsopoulos et al., 2019; van der Poel et al., 2019). Here, we utilize the MS GWAS and NAWM expression datasets to demonstrate human genetic evidence that supports drug targets of approved MS drugs.
Following independent analyses, we performed CDE analysis to deal with the challenge of limited MS brain samples, where both the discovery and evaluation datasets were collectively analyzed. Here, we presented the independent results because they showed genetic evidence for drug target genes of MS. However, some of the modules resulting from the independent analyses were not present in the CDE results. Final prioritizations of critical genes in MS NAWM were based on the CDE findings.
Furthermore, our drug signature enrichment analysis of CDE gene set sheds light on potential drug targets and repositioning strategies for MS. Drug signatures of rubidomycin hydrochloride and zafirlukast were significantly enriched (FDR < 0.05) in our gene set (Table 2). Rubidomycin hydrochloride is a drug indicated for acute myeloid leukemia. In MS, the autoimmune attacks might be suppressed by the drugs used to inhibit the proliferation of certain immune cells in blood cancers. Zafirlukast, a medication used to treat asthma, may also be drug of interest for MS treatment because of its anti-inflammatory actions. In future work, we will further investigate these medications as drug repositioning options for MS. Furthermore, we suggest genes JAK2, MAPK1, MAPK3 and STAT3 as potential drug target genes for MS, as they were contributing to several enriched drug signature pathways (Table 2). These potential drug targets also warrant further investigation.
The noncanonical interaction between TEC and VAV1 in MS NAWM
Our CDE method identified and reproduced a differential co-expression relationship between TEC and VAV1 in both discovery and evaluation MS NAWM expression datasets (Figure 2). The gene TEC was highlighted as a candidate gene of MS risk in a network analysis performed by IMSGC (Zipp et al., 2013). Our findings support the involvement of TEC in MS mechanisms, and highlight the differential co-expression of TEC with VAV1 in MS NAWM. TEC gene encodes Tec protein tyrosine, and VAV1 gene encodes Vav guanine nucleotide exchange factor 1. The interaction between these two proteins was first identified by co-immunoprecipitation and kinase assays of human cell lines, which showed that Tec protein tyrosine kinase increases the activity of Vav guanine nucleotide exchange factor 1 (Kline et al., 2001). This relationship is confirmed by the positive PCC of TEC and VAV1 expression in non-neurological NAWM controls of both discovery and evaluation sets (Figure 2C). However, MS NAWM expression showed that TEC and VAV1 had an inverse relationship, where VAV1 expression decreased as TEC expression increased (Figure 2C). Both TEC and VAV1 have important roles in T cell development, and this interaction has been implicated in T cell receptor signaling (Lucas et al., 2003; Raberger et al., 2008; Reynolds et al., 2002). Thus, the noncanonical interaction of TEC and VAV1, observed in MS NAWM expression, may lead to dysfunction of appropriate T cell development in MS, thereby contributing to mechanisms of autoimmune reactions.
Evaluations of CDE yield the support of viral involvement in MS etiology
Gene set enrichment analysis of the CDE genes also indicated involvement of viral processes in MS NAWM by the presence of enriched GO Biological Process term “intracellular transport of virus”. All other GO Biological Process terms contributing to viral processes are depicted in Figure 4A. We validate our CDE gene set with enrichment analysis of colocalized MS GWAS-eQTL genes by using a Bayesian method and GTEx brain tissues and immune-related tissues (Giambartolomei et al., 2014; Lonsdale et al., 2013). Our CDE gene set was significantly enriched (p-value = 2.34 × 10⁻⁷) with six colocalized genes: CDK4, IFITM3, MAPK1, MAPK3, METTL12B and PIK3R2. METTL12B was colocalized in all eighteen GTEx disease-relevant tissues considered. METTL12B encodes a methyltransferase protein (Malecki et al., 2017). METTL12B may contribute to abnormal epigenetic mechanisms in MS (Huynh et al., 2014; Koch et al., 2013). IFITM3 was colocalized in eight of fourteen GTEx brain tissues. IFITM3 encodes for the interferon-induced transmembrane protein 3, which plays an essential role in conferring immunity for several viral infections by enabling lysosomal degradation of viral components (Figure 4B) (Everitt et al., 2012; Poddar et al., 2016; Spence et al., 2019). We postulate that the variability of IFITM3 in MS patients may hinder the anti-viral action of this interferon-induced protein, thereby leading to viral import and viral infection in MS. The gene MAPK3, presenting colocalization in the cortex, frontal cortex, lung, spleen and whole blood, was differentially co-expressed with CASP8 in CDE network (Figure 4C). Models of the protein interaction between MAPK3 and CASP8 have demonstrated that activation of CASP8 by MAPK3 has resulted in mitochondria-dependent cell death (El Mchichi et al., 2007). Thus, we conjecture that differential expression of MAPK3 and CASP8 in MS NAWM leads to subsequent intrinsic apoptotic signaling (Figure 4D).
Figure 4. Proposed mechanisms of viral involvement in MS mechanisms.
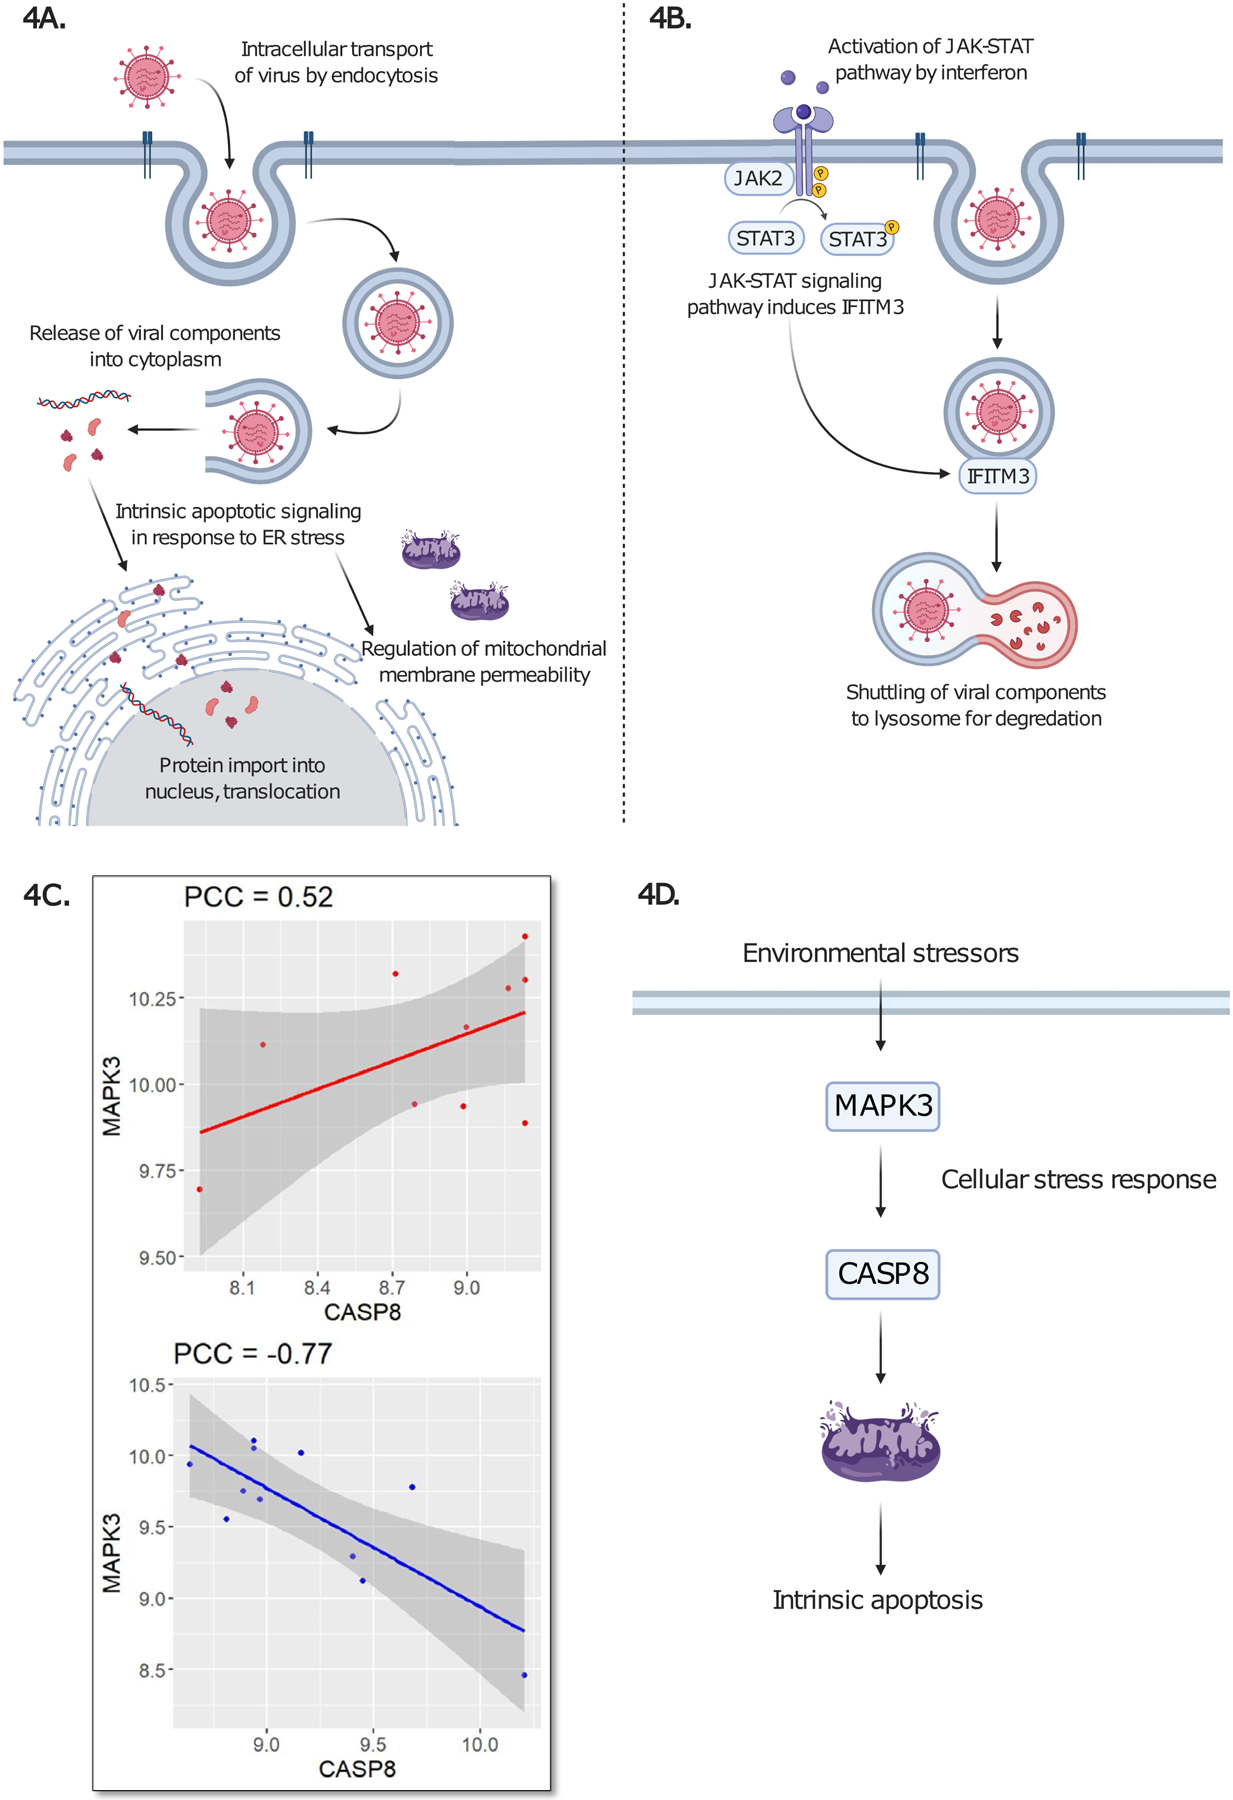
(A) Representation of viral cycle is shown, based on enrichment of GO Biological Process terms: “Intracellular transport of virus” (FDR = 0.018) is depicted through endocytosis, followed by release of viral components. Viral components then enter endoplasmic reticulum (ER), leading to “Intrinsic apoptotic signaling pathway in response to endoplasmic reticulum stress” (FDR = 0.017). “Protein import into nucleus, translocation” (FDR = 0.013) and “Regulation of membrane permeability” (FDR = 0.023) are other enriched GO Biological Process terms. Please see Supplementary Table 3 for complete enrichment results. (B) Canonical function of IFITM3 is shown. JAK-STAT pathway is induced by interferon, leading to IFITM3 activation and subsequent degradation of virus. We postulate that this pathway has dysfunction in MS. (C) Differential co-expression of MAPK3 and CASP8 in MS NAWM. Positive correlation (PCC = 0.52) is shown in cases and negative correlation (PCC = −0.77) is shown in controls. (D) Environmental factors, potentially viral components, activate the mitogen-activated protein kinase (encoded by MAPK3), leading to CASP8 activation, which signals for intrinsic apoptosis. Figure 4A, B, D were drawn using online tool BioRender.com.
Limitations
Our study was limited by the data heterogeneity between MS NAWM expression datasets (RNA-seq of MS NAWM microglia versus microarray of perilesional MS NAWM). Another limitation is lack of human PPI network completeness. Although we compile an extensive list of PPIs from several database sources, it remains that these do not contain a full list of PPI interactions in humans and may not contain PPIs specific to brain expression. In addition, the sample size of the transcriptomic profiling in MS is still small, though we demonstrated the integrative analysis with GWAS signals can effectively uncover joint contributions to MS. In this study, we assumed the integrative contribution of genetic factors and co-expression factors were equal by setting the scaling factor λ = 1. However, we were aware of that contribution ratio λ might be other than the empirical number one. The determination of parameter λ remains open and needs future exploration. Finally, we mainly focused on European population in our analysis. The genetic factors vary among different ethnic populations. For future work, we plan to expand on our network-based methods to include more multi-omics data, such as methylation, which likely also plays a role in MS pathogenesis (Huynh et al., 2014). We will also extend the work to the data in other human populations when such data become available in future.
CONCLUSIONS
In order to investigate the biological underpinnings of MS mechanisms, we introduced a newly developed CDE function for EW_dmGWAS, which is useful for identifying replicated results in separate expression datasets, while also examining GWAS signals. The CDE function was applied to collectively 38 MS NAWM cases and healthy controls, in conjunction with the largest up-to-date MS GWAS. By performing this evaluation, we prioritized a MS-associated network of 55 core genes. The MS-associated network was enriched with drug signatures of FDA-approved drugs, which indicated potential drug repositioning strategies for MS. We highlighted rubidomycin hydrochloride and zafirlukast as potential medications for drug repositioning strategies in MS. Furthermore, we also showed that MAPK and JAK2/STAT3 pathways are the major drug targets in MS, due to their presence in several enriched drug signature pathways (Table 2). We also examined the top network module of the MS-associated network, as it identified replicated differential co-expression between the genes TEC and VAV1 in both the discovery and evaluation NAWM expression datasets, and we suggest that the noncanonical relationship may lead to abnormal T cell development in MS, contributing to MS autoimmune reactions. The MS-associated network was validated by enrichment of GWAS-eQTL colocalization. The colocalized genes enriched in our network are prioritized as critical genes in MS: CDK4, IFITM3, MAPK1, MAPK3, METTL12B and PIK3R2. We presented conjectural mechanisms for viral involvement in MS etiology, based on the enriched Gene Ontology terms (Figure 4). Specifically, we hypothesized that the variability of IFITM3 in MS may hinder its anti-viral action, leading to the entry of viral components in cells of NAWM. Moreover, we also showed that MAPK3 and CASP8 had a differential co-expression relationship, which may lead to stress-induced mitochondria-dependent cell death in MS NAWM. Further investigation is warranted in order to validate the involvement of viral activity in MS etiology.
Supplementary Material
Supplementary Figure 1. Independent results of RNA-seq discovery set and microarray evaluation set presented drug target genes of MS medications. (A-D) Represented modules of discovery set. (E-F) Represents modules of evaluation set. The drug targets are shown with bold borders. (B) The MS drug target gene IFNAR1 was present within the 4th top ranked module of discovery set and showed differential co-expression with CCNB2 (pg = 4.80×10⁻³, PCCMS = 0.27, PCCCtrl = −0.83, e = 2.23, pe = 0.03) and CDK3 (pg = 6.56×10⁻⁴; PCCMS = 0.22, PCCCtrl = −0.88, e = 2.51, pe = 0.01). (C) The 59th top ranked module of the discovery set RELA displayed differential co-expression with C3 (pg = 3.04×10⁻⁴, PCCMS = −0.58, PCCCtrl = 0.63, e = 2.04, pe = 0.04). (D) RELA was also connected to ZGLP1 (pg = 7.88×10⁻⁵) with differential co-expression (PCCMS = −0.88, PCCCtrl = 0.38, e = 2.76, pe = 0.005) in the 86th top ranked module of discovery set. KEAP1 was connected to RELA in this module as well; however, no differential co-expression was observed between these two MS drug target genes. (E) KEAP1 was also present in the 3rd top ranked module of the evaluation set; however, KEAP1 did not display differential co-expression with other genes. (F) RELA showed differential co-expression (PCCMS = 0.92, PCCCtrl = −0.66, e = 1.96, pe = 0.05) with HSPA1L (pg = 1.58×10⁻¹⁴) within the 62nd top ranked module of the evaluation set.
ACKNOWLEDGEMENTS
The authors would like to thank Dr. Assaf Gottlieb and Dr. Aik Choon Tan for valuable discussion about DSigDB enrichment and interpretation. We would also like to thank Ms. Fangfang Yan for aiding in the compilation and construction of the human protein interactome, which was used as the reference network in this study.
FUNDING
A.M.M. is supported by a training fellowship from the Gulf Coast Consortia on the National Institutes of Health (NIH) NLM Training Program in Biomedical Informatics & Data Science (T15LM007093). Z.Z. was partially supported by the NIH grant (R01LM012806) and the Cancer Prevention and Research Institute of Texas (CPRIT RP180734 and RP210045). The funders had no role in the study design, data collection and analysis, decision to publish, or preparation of the manuscript.
Footnotes
COMPETING INTERESTS
None declared.
REFERENCES
- Agostini S, Mancuso R, Guerini FR, D’Alfonso S, Agliardi C, Hernis A, Zanzottera M, Barizzone N, Leone MA, Caputo D, Rovaris M, Clerici M, 2018. HLA alleles modulate EBV viral load in multiple sclerosis. J Transl Med. 16:80. [DOI] [PMC free article] [PubMed] [Google Scholar]
- Baranzini SE, Wang J, Gibson RA, Galwey N, Naegelin Y, Barkhof F, Radue EW, Lindberg RLP, Uitdehaag BMG, Johnson MR, Angelakopoulou A, Hall L, Richardson JC, Prinjha RK, Gass A, Geurts JJG, Kragt J, Sombekke M, Vrenken H, Qualley P, Lincoln RR, Gomez R, Caillier SJ, George MF, Mousavi H, Guerrero R, Okuda DT, Cree BAC, Green AJ, Waubant E, Goodin DS, Pelletier D, Matthews PM, Hauser SL, Kappos L, Polman CH, Oksenberg JR, 2009. Genome-wide association analysis of susceptibility and clinical phenotype in multiple sclerosis. Hum. Mol. Genet 18, 767–778. [DOI] [PMC free article] [PubMed] [Google Scholar]
- Barrett T, Wilhite SE, Ledoux P, Evangelista C, Kim IF, Tomashevsky M, Marshall KA, Phillippy KH, Sherman PM, Holko M, Yefanov A, Lee H, Zhang N, Robertson CL, Serova N, Davis S, Soboleva A, 2013. NCBI GEO: Archive for functional genomics data sets - Update. Nucleic Acids Res 2013:D991–5. [DOI] [PMC free article] [PubMed] [Google Scholar]
- Benjamini Y, Hochberg Y, 1995. Controlling the False Discovery Rate: A Practical and Powerful Approach to Multiple Testing. J. R. Stat. Soc. Ser. B 57, 289–300. [Google Scholar]
- Croft D, O’Kelly G, Wu G, Haw R, Gillespie M, Matthews L, Caudy M, Garapati P, Gopinath G, Jassal B, Jupe S, Kalatskaya I, MayMahajan S, May B, Ndegwa N, Schmidt E, Shamovsky V, Yung C, Birney E, Hermjakob H, D’Eustachio P, Stein L, 2011. Reactome: A database of reactions, pathways and biological processes. Nucleic Acids Res 2011:D691–7. [DOI] [PMC free article] [PubMed] [Google Scholar]
- Das J, Yu H, 2012. HINT: High-quality protein interactomes and their applications in understanding human disease. BMC Syst. Biol 6:92. [DOI] [PMC free article] [PubMed] [Google Scholar]
- Dendrou CA, Fugger L, Friese MA, 2015. Immunopathology of multiple sclerosis. Nat. Rev. Immunol 15:545–58. [DOI] [PubMed] [Google Scholar]
- El Mchichi B, Hadji A, Vazquez A, Leca G, 2007. p38 MAPK and MSK1 mediate caspase-8 activation in manganese-induced mitochondria-dependent cell death. Cell Death Differ 14:1826–36. [DOI] [PubMed] [Google Scholar]
- Everitt AR, Clare S, Pertel T, John SP, Wash RS, Smith SE, Chin CR, Feeley EM, Sims JS, Adams DJ, Wise HM, Kane L, Goulding D, Digard P, Anttila V, Baillie JK, Walsh TS, Hume DA, Palotie A, Xue Y, Colonna V, Tyler-Smith C, Dunning J, Gordon SB, Smyth RL, Openshaw PJ, Dougan G, Brass AL, Kellam Paul, Everingham K, Dawson H, Hope D, Ramsay P, Campbell A, Kerr S, Harrison D, Rowan K, Addison J, Donald N, Galt S, Noble D, Taylor J, Webster N, Taylor I, Aldridge J, Dornan R, Richard C, Gilmour D, Simmons R, White R, Jardine C, Williams D, Booth M, Quasim T, Watson V, Henry P, Munro F, Bell L, Ruddy J, Cole S, Southward J, Allcoat P, Gray S, McDougall M, Matheson J, Whiteside J, Alcorn D, Rooney K, Sundaram R, Imrie G, Bruce J, McGuigan K, Moultrie S, Cairns C, Grant J, Hughes M, Murdoch C, Davidson A, Harris G, Paterson R, Wallis C, Binning S, Pollock M, Antonelli J, Duncan A, Gibson J, McCulloch C, Murphy L, Haley C, Faulkner G, Freeman T, Chaussabel D, Adamson WE, Carman WF, Thompson C, Zambon MC, Aylin P, Ashby D, Barclay WS, Brett SJ, Cookson WO, Drumright LN, Elderfield RA, Garcia-Alvarez L, Gazzard BG, Griffiths MJ, Habibi MS, Hansel TT, Herberg JA, Holmes AH, Hussell T, Johnston SL, Kon OM, Levin M, Moffatt MF, Nadel S, Warner JO, Aston SJ, Hay A, McCauley J, O’Garra A, Banchereau J, Hayward A, Kellam P, Simmonds P, McNamara PS, Semple MG, Nguyen-Van-Tam JS, Ho LP, McMichael AJ, 2012. IFITM3 restricts the morbidity and mortality associated with influenza. Nature 484:519–23. [DOI] [PMC free article] [PubMed] [Google Scholar]
- Gene Ontology Consortium, 2004. The Gene Ontology (GO) database and informatics resource. Nucleic Acids Res. 32, 258D–261. [DOI] [PMC free article] [PubMed] [Google Scholar]
- Giambartolomei C, Vukcevic D, Schadt EE, Franke L, Hingorani AD, Wallace C, Plagnol V, 2014. Bayesian Test for Colocalisation between Pairs of Genetic Association Studies Using Summary Statistics. PLoS Genet. 10. [DOI] [PMC free article] [PubMed] [Google Scholar]
- Hahne F, Huber W, Gentleman Robert, Falcon Seth, Falcon S, Gentleman R, 2008. Hypergeometric Testing Used for Gene Set Enrichment Analysis, in: Bioconductor Case Studies 207–220. [Google Scholar]
- Hendrickx DAE, van Scheppingen J, van der Poel M, Bossers K, Schuurman KG, van Eden CG, Hol EM, Hamann J, Huitinga I, 2017. Gene expression profiling of multiple sclerosis pathology identifies early patterns of demyelination surrounding chronic active lesions. Front. Immunol 8:1810. [DOI] [PMC free article] [PubMed] [Google Scholar]
- Huynh JL, Garg P, Thin TH, Yoo S, Dutta R, Trapp BD, Haroutunian V, Zhu J, Donovan MJ, Sharp AJ, Casaccia P, 2014. Epigenome-wide differences in pathology-free regions of multiple sclerosis-affected brains. Nat. Neurosci 17:121–30. [DOI] [PMC free article] [PubMed] [Google Scholar]
- Jia P, Zhao Z., 2012. Personalized pathway enrichment map of putative cancer genes from next generation sequencing data. PLoS ONE 7(5): e37595. [DOI] [PMC free article] [PubMed] [Google Scholar]
- Jordão MJC, Sankowski R, Brendecke SM, Sagar Locatelli, G., Tai YH, Tay TL, Schramm E, Armbruster S, Hagemeyer N, Groß O, Mai D, Çiçek Ö, Falk T, Kerschensteiner M, Grün D, Prinz M, 2019. Neuroimmunology: Single-cell profiling identifies myeloid cell subsets with distinct fates during neuroinflammation. Science 363:365. [DOI] [PubMed] [Google Scholar]
- Kaimal V, Bardes EE, Tabar SC, Jegga AG, Aronow BJ, 2010. ToppCluster: A multiple gene list feature analyzer for comparative enrichment clustering and networkbased dissection of biological systems. Nucleic Acids Res. 38:W96–102. [DOI] [PMC free article] [PubMed] [Google Scholar]
- Kline JB, Moore DJ, Clevenger CV, 2001. Activation and association of the Tec tyrosine kinase with the human prolactin receptor: Mapping of a Tec/Vav1-receptor binding site. Mol. Endocrinol 15:832–41. [DOI] [PubMed] [Google Scholar]
- Koch MW, Metz LM, Kovalchuk O, 2013. Epigenetic changes in patients with multiple sclerosis. Nat. Rev. Neurol 9:35–43. [DOI] [PubMed] [Google Scholar]
- Lamparter D, Marbach D, Rueedi R, Kutalik Z, Bergmann S, 2016. Fast and Rigorous Computation of Gene and Pathway Scores from SNP-Based Summary Statistics. PLoS Comput. Biol 12:e1004714. [DOI] [PMC free article] [PubMed] [Google Scholar]
- Lonsdale J, Thomas J, Salvatore M, Phillips R, Lo E, Shad S, Hasz R, Walters G, Garcia F, Young N, Foster B, Moser M, Karasik E, Gillard B, Ramsey K, Sullivan S, Bridge J, Magazine H, Syron J, Fleming J, Siminoff L, Traino H, Mosavel M, Barker L, Jewell S, Rohrer D, Maxim D, Filkins D, Harbach P, Cortadillo E, Berghuis B, Turner L, Hudson E, Feenstra K, Sobin L, Robb J, Branton P, Korzeniewski G, Shive C, Tabor D, Qi L, Groch K, Nampally S, Buia S, Zimmerman A, Smith A, Burges R, Robinson K, Valentino K, Bradbury D, Cosentino M, Diaz-Mayoral N, Kennedy M, Engel T, Williams P, Erickson K, Ardlie K, Winckler W, Getz G, DeLuca D, MacArthur Daniel, Kellis M, Thomson A, Young T, Gelfand E, Donovan M, Meng Y, Grant G, Mash D, Marcus Y, Basile M, Liu J, Zhu J, Tu Z, Cox NJ, Nicolae DL, Gamazon ER, Im HK, Konkashbaev A, Pritchard J, Stevens M, Flutre T, Wen X, Dermitzakis ET, Lappalainen T, Guigo R, Monlong J, Sammeth M, Koller D, Battle A, Mostafavi S, McCarthy M, Rivas M, Maller J, Rusyn I, Nobel A, Wright F, Shabalin A, Feolo M, Sharopova N, Sturcke A, Paschal J, Anderson JM, Wilder EL, Derr LK, Green ED, Struewing JP, Temple G, Volpi S, Boyer JT, Thomson EJ, Guyer MS, Ng C, Abdallah A, Colantuoni D, Insel TR, Koester SE, A Roger Little, Bender PK, Lehner T, Yao Y, Compton CC, Vaught JB, Sawyer S, Lockhart NC, Demchok J, Moore HF, 2013. The Genotype-Tissue Expression (GTEx) project. Nat. Genet 45:580–85. [DOI] [PMC free article] [PubMed] [Google Scholar]
- Lucas JA, Miller AT, Atherly LO, Berg LJ, 2003. The role of Tec family kinases in T cell development and function. Immunol. Rev 191:119–38. [DOI] [PubMed] [Google Scholar]
- Malecki J, Aileni VK, Ho AYY, Schwarz J, Moen A, Sørensen V, Nilges BS, Jakobsson ME, Leidel SA, Falnes PO, 2017. The novel lysine specific methyltransferase METTL21B affects mRNA translation through inducible and dynamic methylation of Lys-165 in human eukaryotic elongation factor 1 alpha (eEF1A). Nucleic Acids Res 45:4370–89. [DOI] [PMC free article] [PubMed] [Google Scholar]
- Manuel AM, Dai Y, Freeman LA, Jia P, Zhao Z, 2020. Dense module searching for gene networks associated with multiple sclerosis. BMC Med. Genomics 13(Suppl 5):48. [DOI] [PMC free article] [PubMed] [Google Scholar]
- Moll NM, Rietsch AM, Thomas S, Ransohoff AJ, Lee JC, Fox R, Chang A, Ransohoff RM, Fisher E, 2011. Multiple sclerosis normal-appearing white matter: Pathology-imaging correlations. Ann. Neurol 70, 764–73. [DOI] [PMC free article] [PubMed] [Google Scholar]
- Oughtred R, Stark C, Breitkreutz BJ, Rust J, Boucher L, Chang C, Kolas N, O’Donnell L, Leung G, McAdam R, Zhang F, Dolma S, Willems A, Coulombe-Huntington J, Chatr-Aryamontri A, Dolinski K, Tyers M, 2019. The BioGRID interaction database: 2019 update. Nucleic Acids Res 47:D529–41. [DOI] [PMC free article] [PubMed] [Google Scholar]
- Patsopoulos NA, Baranzini SE, Santaniello A, Shoostari P, Cotsapas C, Wong G, Beecham AH, James T, Replogle J, Vlachos IS, McCabe C, Pers TH, Brandes A, White C, Keenan B, Cimpean M, Winn P, Panteliadis IP, Robbins A, Andlauer TFM, Zarzycki O, Dubois B, Goris A, Søndergaard HB, Sellebjerg F, Sorensen PS, Ullum H, Thørner LW, Saarela J, Cournu-Rebeix I, Damotte V, Fontaine B, Guillot-Noel L, Lathrop M, Vukusic S, Berthele A, Pongratz V, Buck D, Gasperi C, Graetz C, Grummel V, Hemmer B, Hoshi M, Knier B, Korn T, Lill CM, Luessi F, Mühlau M, Zipp F, Dardiotis E, Agliardi C, Amoroso A, Barizzone N, Benedetti MD, Bernardinelli L, Cavalla P, Clarelli F, Comi G, Cusi D, Esposito F, Ferrè L, Galimberti D, Guaschino C, Leone MA, Martinelli V, Moiola L, Salvetti M, Sorosina M, Vecchio D, Zauli A, Santoro S, Mancini N, Zuccalà M, Mescheriakova J, Van Duijn C, Bos SD, Celius EG, Spurkland A, Comabella M, Montalban X, Alfredsson L, Bomfim IL, Gomez-Cabrero D, Hillert J, Jagodic M, Lindén M, Piehl F, Jelčić I, Martin R, Sospedra M, Baker A, Ban M, Hawkins C, Hysi P, Kalra S, Karpe F, Khadake J, Lachance G, Molyneux P, Neville M, Thorpe J, Bradshaw E, Caillier SJ, Calabresi P, Cree BAC, Cross A, Davis M, De Bakker PWI, Delgado S, Dembele M, Edwards K, Fitzgerald K, Frohlich IY, Gourraud PA, Haines JL, Hakonarson H, Kimbrough D, Isobe N, Konidari I, Lathi E, Lee MH, Li T, An D, Zimmer A, Madireddy L, Manrique CP, Mitrovic M, Olah M, Patrick E, Pericak-Vance MA, Piccio L, Schaefer C, Weiner H, Lage K, Compston A, Hafler D, Harbo HF, Hauser SL, Stewart G, D’Alfonso S, Hadjigeorgiou G, Taylor B, Barcellos LF, Booth D, Hintzen R, Kockum I, Martinelli-Boneschi F, McCauley JL, Oksenberg JR, Oturai A, Sawcer S, Ivinson AJ, Olsson T, De Jager PL, 2019. Multiple sclerosis genomic map implicates peripheral immune cells and microglia in susceptibility. Science 365:1417. [DOI] [PMC free article] [PubMed] [Google Scholar]
- Poddar S, Hyde JL, Gorman MJ, Farzan M, Diamond MS, 2016. The Interferon-Stimulated Gene IFITM3 Restricts Infection and Pathogenesis of Arthritogenic and Encephalitic Alphaviruses. J. Virol;90:8780–94. [DOI] [PMC free article] [PubMed] [Google Scholar]
- Purcell S, Neale B, Todd-Brown K, Thomas L, Ferreira MAR, Bender D, Maller J, Sklar P, De Bakker PIW, Daly MJ, Sham PC, 2007. PLINK: A tool set for whole-genome association and population-based linkage analyses. Am. J. Hum. Genet 81:559–75. [DOI] [PMC free article] [PubMed] [Google Scholar]
- Raberger J, Boucheron N, Sakaguchi S, Penninger JM, Ellmeier W, 2008. Impaired T-cell development in the absence of Vav1 and Itk. Eur. J. Immunol 38:3530–42. [DOI] [PubMed] [Google Scholar]
- Razick S, Magklaras G, Donaldson IM, 2008. iRefIndex: A consolidated protein interaction database with provenance. BMC Bioinformatics 9:405. [DOI] [PMC free article] [PubMed] [Google Scholar]
- Reynolds LF, Smyth LA, Norton T, Freshney N, Downward J, Kioussis D, Tybulewicz VLJ, 2002. Vav1 transduces T cell receptor signals to the activation of phospholipase C-γ1 via phosphoinositide 3-kinase-dependent and -independent pathways. J. Exp. Med 279:18239–46. [DOI] [PMC free article] [PubMed] [Google Scholar]
- Spence JS, He R, Hoffmann HH, Das T, Thinon E, Rice CM, Peng T, Chandran K, Hang HC, 2019. IFITM3 directly engages and shuttles incoming virus particles to lysosomes. Nat. Chem. Biol 15:259–68. [DOI] [PMC free article] [PubMed] [Google Scholar]
- Szklarczyk D, Gable AL, Lyon D, Junge A, Wyder S, Huerta-Cepas J, Simonovic M, Doncheva NT, Morris JH, Bork P, Jensen LJ, Von Mering C, 2019. STRING v11: Protein-protein association networks with increased coverage, supporting functional discovery in genome-wide experimental datasets. Nucleic Acids Res 47:D607–13. [DOI] [PMC free article] [PubMed] [Google Scholar]
- van der Poel M, Ulas T, Mizee MR, Hsiao CC, Miedema SSM, Adelia Schuurman, K.G., Helder B, Tas SW, Schultze JL, Hamann J, Huitinga I, 2019. Transcriptional profiling of human microglia reveals grey–white matter heterogeneity and multiple sclerosis-associated changes. Nat. Commun 10:1139. [DOI] [PMC free article] [PubMed] [Google Scholar]
- Wallin MT, Culpepper WJ, Campbell JD, Nelson LM, Langer-Gould A, Marrie RA, Cutter GR, Kaye WE, Wagner L, Tremlett H, Buka SL, Dilokthornsakul P, Topol B, Chen LH, Larocca NG, 2019. The prevalence of MS in the United States: A population-based estimate using health claims data. Neurology 93(15):688. [DOI] [PMC free article] [PubMed] [Google Scholar]
- Wang Q, Yu H, Zhao Z, Jia P, 2015. EW-dmGWAS: Edge-weighted dense module search for genome-wide association studies and gene expression profiles. Bioinformatics 31, 2591–2594. [DOI] [PMC free article] [PubMed] [Google Scholar]
- Wang Z, Gerstein M, Snyder M, 2009. RNA-Seq: A revolutionary tool for transcriptomics. Nat. Rev. Genet 10:57–63. [DOI] [PMC free article] [PubMed] [Google Scholar]
- Wang L, Jia P, Wolfinger RD, Chen X, Zhao Z., 2011. Gene set analysis of genome-wide association studies: methodological issues and perspectives. Genomics, 98:1–8 [DOI] [PMC free article] [PubMed] [Google Scholar]
- Wishart DS, Feunang YD, Guo AC, Lo EJ, Marcu A, Grant JR, Sajed T, Johnson D, Li C, Sayeeda Z, Assempour N, Iynkkaran I, Liu Y, MacIejewski A, Gale N, Wilson A, Chin L, Cummings R, Le Di., Pon A, Knox C, Wilson M, 2018. DrugBank 5.0: A major update to the DrugBank database for 2018. Nucleic Acids Res. 46, D1074–D1082. [DOI] [PMC free article] [PubMed] [Google Scholar]
- Xu H, Baroukh C, Dannenfelser R, Chen EY, Tan CM, Kou Y, Kim YE, Lemischka IR, Ma’ayan A, 2013. ESCAPE: Database for integrating high-content published data collected from human and mouse embryonic stem cells. Database 2013:bat045. [DOI] [PMC free article] [PubMed] [Google Scholar]
- Yan F, Dai Y, Iwata J, Zhao Z, Jia P, 2020. An integrative, genomic, transcriptomic and network-assisted study to identify genes associated with human cleft lip with or without cleft palate. BMC Med. Genomics 13(Suppl 5):39. [DOI] [PMC free article] [PubMed] [Google Scholar]
- Yoo M, Shin J, Kim J, Ryall KA, Lee K, Lee S, Jeon M, Kang J, Tan AC, 2015. DSigDB: Drug signatures database for gene set analysis. Bioinformatics 31:3069–71. [DOI] [PMC free article] [PubMed] [Google Scholar]
- Zeis T, Graumann U, Reynolds R, Schaeren-Wiemers N, 2008. Normal-appearing white matter in multiple sclerosis is in a subtle balance between inflammation and neuroprotection. Brain 131:288–303. [DOI] [PubMed] [Google Scholar]
- Zhang M, Yao C, Guo Z, Zou J, Zhang L, Xiao H, Wang D, Yang D, Gong X, Zhu J, Li Y, Li X, 2008. Apparently low reproducibility of true differential expression discoveries in microarray studies. Bioinformatics 24:2057–63. [DOI] [PubMed] [Google Scholar]
- Zipp F, Ivinson AJ, Haines JL, Sawcer S, Dejager P, Hauser SL, Oksenberg JR, 2013. Network-based multiple sclerosis pathway analysis with GWAS data from 15,000 cases and 30,000 controls. Am. J. Hum. Genet 92, 854–865. [DOI] [PMC free article] [PubMed] [Google Scholar]
Associated Data
This section collects any data citations, data availability statements, or supplementary materials included in this article.
Supplementary Materials
Supplementary Figure 1. Independent results of RNA-seq discovery set and microarray evaluation set presented drug target genes of MS medications. (A-D) Represented modules of discovery set. (E-F) Represents modules of evaluation set. The drug targets are shown with bold borders. (B) The MS drug target gene IFNAR1 was present within the 4th top ranked module of discovery set and showed differential co-expression with CCNB2 (pg = 4.80×10⁻³, PCCMS = 0.27, PCCCtrl = −0.83, e = 2.23, pe = 0.03) and CDK3 (pg = 6.56×10⁻⁴; PCCMS = 0.22, PCCCtrl = −0.88, e = 2.51, pe = 0.01). (C) The 59th top ranked module of the discovery set RELA displayed differential co-expression with C3 (pg = 3.04×10⁻⁴, PCCMS = −0.58, PCCCtrl = 0.63, e = 2.04, pe = 0.04). (D) RELA was also connected to ZGLP1 (pg = 7.88×10⁻⁵) with differential co-expression (PCCMS = −0.88, PCCCtrl = 0.38, e = 2.76, pe = 0.005) in the 86th top ranked module of discovery set. KEAP1 was connected to RELA in this module as well; however, no differential co-expression was observed between these two MS drug target genes. (E) KEAP1 was also present in the 3rd top ranked module of the evaluation set; however, KEAP1 did not display differential co-expression with other genes. (F) RELA showed differential co-expression (PCCMS = 0.92, PCCCtrl = −0.66, e = 1.96, pe = 0.05) with HSPA1L (pg = 1.58×10⁻¹⁴) within the 62nd top ranked module of the evaluation set.