

Abstract
For electrons to continuously enter and flow through the mitochondrial electron transport chain (ETC), they must ultimately land on a terminal electron acceptor (TEA), which is known to be oxygen in mammals. Paradoxically, we find that complex I and dihydroorotate dehydrogenase (DHODH) can still deposit electrons into the ETC when oxygen reduction is impeded. Cells lacking oxygen reduction accumulate ubiquinol, driving the succinate dehydrogenase (SDH) complex in reverse to enable electron deposition onto fumarate. Upon inhibition of oxygen reduction, fumarate reduction sustains DHODH and complex I activities. Mouse tissues display varying capacities to use fumarate as a TEA, most of which net reverse the SDH complex under hypoxia. Thus, we delineate a circuit of electron flow in the mammalian ETC that maintains mitochondrial functions under oxygen limitation.
The flow of electrons through the mitochondrial electron transport chain (ETC) supports a diverse set of cellular processes, such as the synthesis of central metabolites and the regulation of signaling and cell death pathways (1–7). Electrons enter the ETC through the activities of enzymes such as dihydroorotate dehydrogenase (DHODH) and complex I, move between complexes via the electron carrier ubiquinol (UQH2), and exit by reducing a terminal electron acceptor (TEA). The canonical view is that in mammalian cells, oxygen (O2) serves as the sole TEA and its reduction is necessary for the reoxidation of UQH2 into ubiquinone (UQ) and thus the continuous input of electrons into the ETC. However, under a variety of physiological states, mammalian cells can exist in hypoxic niches (8–16) while maintaining functions that require the flow of electrons into the ETC, including de novo pyrimidine biosynthesis and oxidation of reduced nicotinamide adenine dinucleotide (NADH) (17–22). Thus, we sought to clarify the extent to which mitochondrial functions that necessitate electron input into the ETC also require the use of O2 as a TEA.
Results
In mammalian cells, the flow of electrons into the ETC does not require O2 reduction
To ask how limitations in O2 reduction affect mitochondrial functions that depend on the input of electrons into the ETC, we monitored the activity of DHODH. DHODH oxidizes dihydroorotate into orotate and deposits these electrons into the ETC (Fig. 1A). As this reaction is a step in de novo pyrimidine biosynthesis, DHODH activity can be monitored by tracing 13C4-aspartate into 13C3–uridine 5′-triphosphate (UTP) (fig. S1A). Because ETC inhibition reduces aspartate levels (23–25), we used excess aspartate as the stable isotope tracer to ensure its availability is not limiting for DHODH activity. Upon treatment of human 143B osteosarcoma cells with antimycin, which inhibits complex III and prevents the transfer of electrons to O2, 13C3-UTP levels were unchanged (Fig. 1B). However, in both vehicle-and antimycin-treated cells, the DHODH inhibitor brequinar ablated 13C3-UTP production (Fig. 1B). Similarly, under hypoxia (1% O2), cells sustained pyrimidine biosynthesis in a DHODH-dependent manner (Fig. 1B). Thus, even under conditions that reduce the transfer of electrons to O2, DHODH can still deposit electrons into the ETC.
Fig. 1. Cells deficient in O2 reduction retain the capacity to input electrons into the ETC.
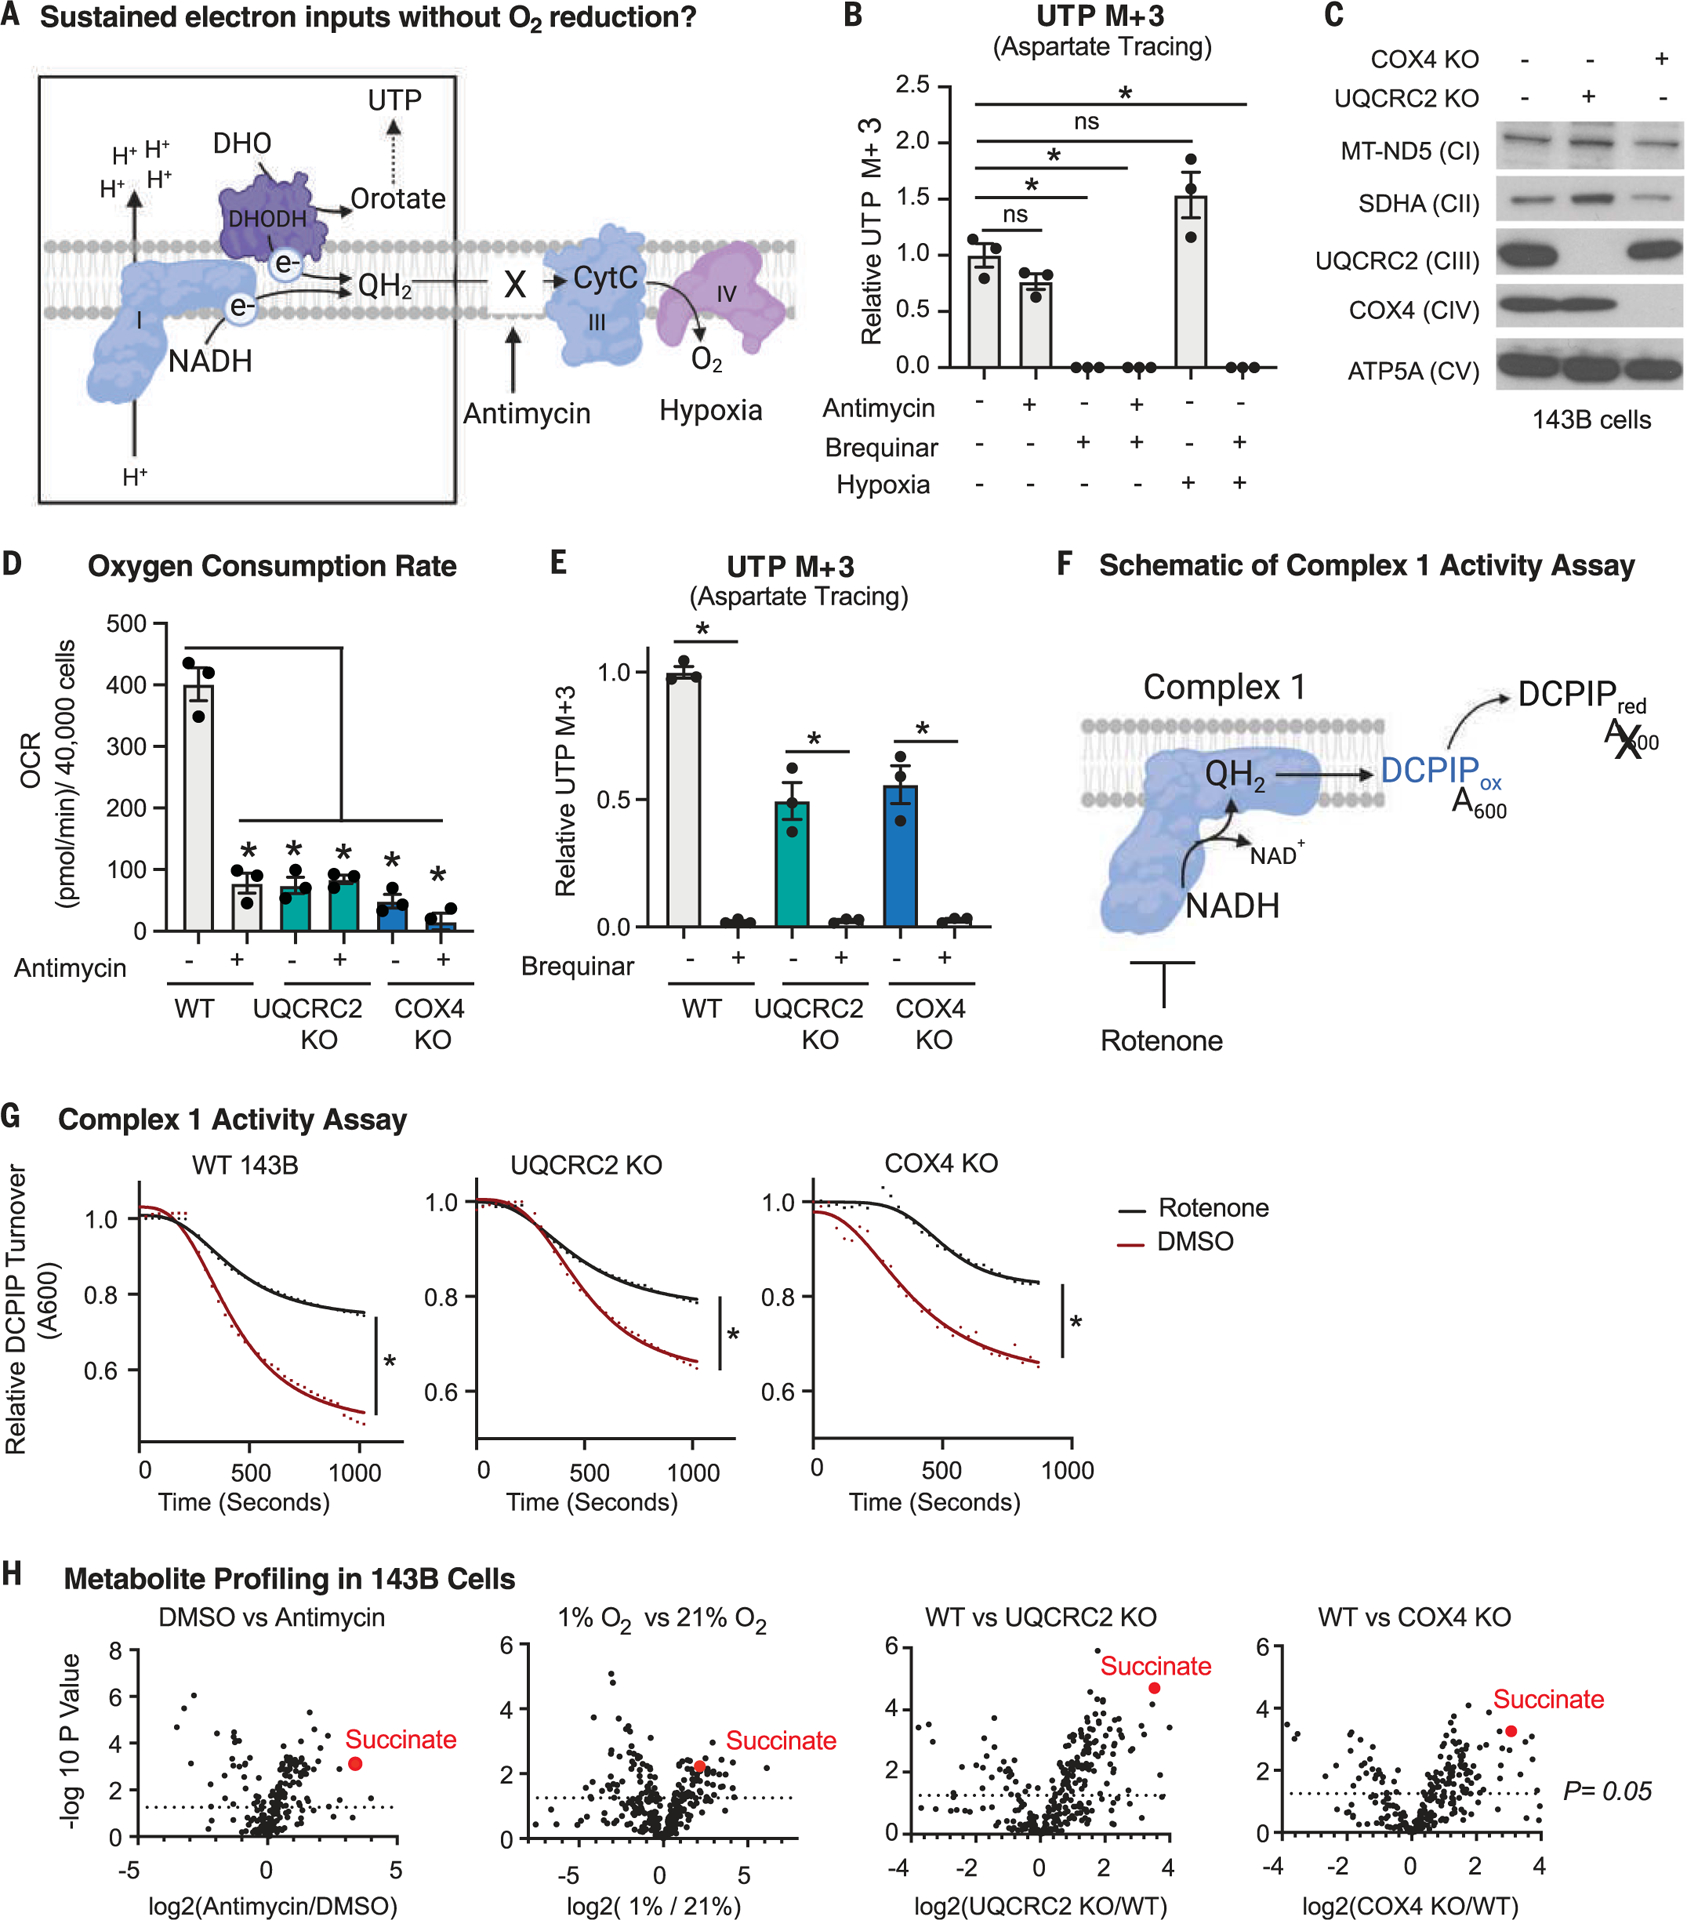
(A) Schematic depicting the electron transport chain (ETC) and the deposition of electrons (e−) onto a terminal electron acceptor. CytC, cytochrome c. (B) DHODH activity as determined by stable isotope tracing with 10 mM 13C4-aspartate, which generates 13C3-UTP if DHODH is active. Tracing was performed for 8 hours in 143B cells treated with vehicle [dimethyl sulfoxide (DMSO)], 500 nM antimycin, 2 μM brequinar, or in combination or cultured in 1% O2 for 24 hours (mean ± SEM, n = 3 biological replicates per condition). *P < 0.05. P values were calculated using a two-way analysis of variance (ANOVA). (C) Immunoblot analyses of mitochondrial proteins in wild-type (WT), UQCRC2 (complex III) knockout (KO), and COX4 (complex IV) KO 143B cells. (D) O2 consumption rate (OCR) of WT, UQCRC2 KO, and COX4 KO 143B cells treated with DMSO or 500 nM antimycin for 1 hour (mean ± SEM, n = 3 biological replicates per condition). *P < 0.05. P values were calculated using a two-way ANOVA. (E) DHODH activity as determined using stable isotope tracing of 10 mM 13C4- aspartate, which generates 13C3-UTP if DHODH is active. Tracing was performed for 8 hours in WT, UQCRC2 KO, and COX4 KO 143B cells treated with DMSO or 2 μM brequinar (mean ± SEM, n = 3 biological replicates per condition). *P < 0.05. P values were calculated using a parametric t test. (F) Schematic depicting the complex I activity assay on purified mitochondria. NADH initiates the reaction, and the absorbance (A600) of the oxidized electron acceptor 2,6-dichlorophenolindophenol (DCPIP) is measured over time. (G) Complex I activity in mitochondria purified from WT, UQCRC2 KO, and COX4 KO 143B cells in the presence or absence of 1 μM rotenone (complex I inhibitor). *P < 0.05. P values were calculated using an extra sum of squares F test in GraphPad Prism. (H) Polar metabolite profiling of 143B cells treated with DMSO versus 500 nM antimycin for 8 hours, grown in 21% versus 1% O2, WT versus UQCRC2 KO 143B cells, or WT versus COX4 KO 143B cells, n = 3 biological replicates per condition. P values were calculated using a parametric t test.
Because complex IV has a high affinity for O2 and has partial activity even under hypoxia (26–28), we generated 143B cells that lack a key component of complex IV (COX4) or complex III (UQCRC2), which rendered them incapable of reducing O2 in the ETC. Loss of these genes did not induce the expression of paralogs, reduce the amounts or assembly of other ETC complexes, or strongly affect mitochondrial DNA (mtDNA) copy number (Fig. 1C and fig. S1, B and C). Although O2 consumption was greatly reduced in UQCRC2 and COX4 knockout cells (Fig. 1D), de novo pyrimidine biosynthesis was far less impaired. DHODH enzyme activity was unaffected by the loss of UQCRC2 or COX4 in cell lysates (fig. S1D) and dropped ~50% from wild-type levels in live cells, as measured by 13C4-aspartate incorporation into 13C3-UTP (Fig. 1E). The DHODH inhibitor brequinar ablated 13C3-UTP biosynthesis in UQCRC2 and COX4 knockout cells despite having no effect on their O2 consumption (Fig. 1E and fig. S1, E and F), indicating that DHODH maintains activity independently of the cells’ ability to reduce O2 (Fig. 1E). Notably, the difference in oxygen consumption rate upon brequinar treatment in wild-type cells between our two assays warrants follow-up in future studies (fig. S1, E and F). Furthermore, supplementation of culture media with aspartate, an essential precursor in de novo pyrimidine biosynthesis, increased the proliferation of antimycin-treated cells, which was ablated by the DHODH inhibitor brequinar (fig. S1G). Similarly, brequinar treatment reduced the proliferation of UQCRC2 and COX4 knockout cells (fig. S1H). Thus, both pharmacological and genetic experiments reveal that DHODH maintains electron input into the ETC when O2 cannot be used as a TEA and that an adaptive mechanism (or mechanisms) must exist to sustain electron flow into the ETC in this context.
Next, we examined complex I activity because it deposits electrons into the ETC during the oxidation of NADH. We purified mitochondria from wild-type, UQCRC2-, and COX4-knockout cells and measured complex I enzymatic activity (29) (Fig. 1F). All mitochondria, including those genetically incapable of O2 reduction, had reduced complex I activity upon rotenone treatment, indicating that complex I enzymatic activity is intact (Fig. 1G). The activity of complex I was slightly lower in mitochondria that lacked UQCRC2 or COX4 (Fig. 1G), consistent with previous findings that hypoxia reduces but does not ablate complex I activity in cells (30–34). Inhibition of complex I by piericidin did not affect O2 consumption rate in UQCRC2 and COX4 knockout cells (fig. S1, E and F) but did reduce their proliferation, although to a lesser extent than in wild-type cells (fig. S1I). This is expected from complex I having partial activity upon a block in O2 reduction. Thus, as with DHODH, complex I can still deposit electrons into the ETC when O2 cannot be reduced.
Inhibition of O2 reduction stimulates a net reversal of the succinate dehydrogenase complex, enabling fumarate reduction
Given that DHODH and complex I deposit electrons into the ETC when O2 reduction is not possible, we sought to determine the fate of these electrons (Fig. 2A). Upon exposure to hypoxia, electrons can be transferred to nicotinamide adenine dinucleotide (NAD+) through reversal of complex I activity, formally known as reverse electron transfer (35, 36). The combined inhibition of complex III with antimycin and complex I with piericidin had no effect on DHODH activity as measured by the incorporation of 13C4-aspartate into 13C3-UTP, indicating that an alternative electron removal pathway must sustain nucleotide biosynthesis in the absence of O2 reduction (fig. S2A). Under hypoxia, lower eukaryotes use fumarate as a TEA, generating succinate as a by-product (37). Succinate also accumulates in cancer cells exposed to hypoxia (38, 39), ischemic hearts (40), and postexercise muscle (41). In 143B cells, we observed an increase in succinate upon hypoxia exposure, antimycin treatment, and depletion of UQCRC2 or COX4 (Fig. 1H).
Fig. 2. Upon inhibition of O2 reduction, fumarate accepts electrons through net reversal of the SDH complex.
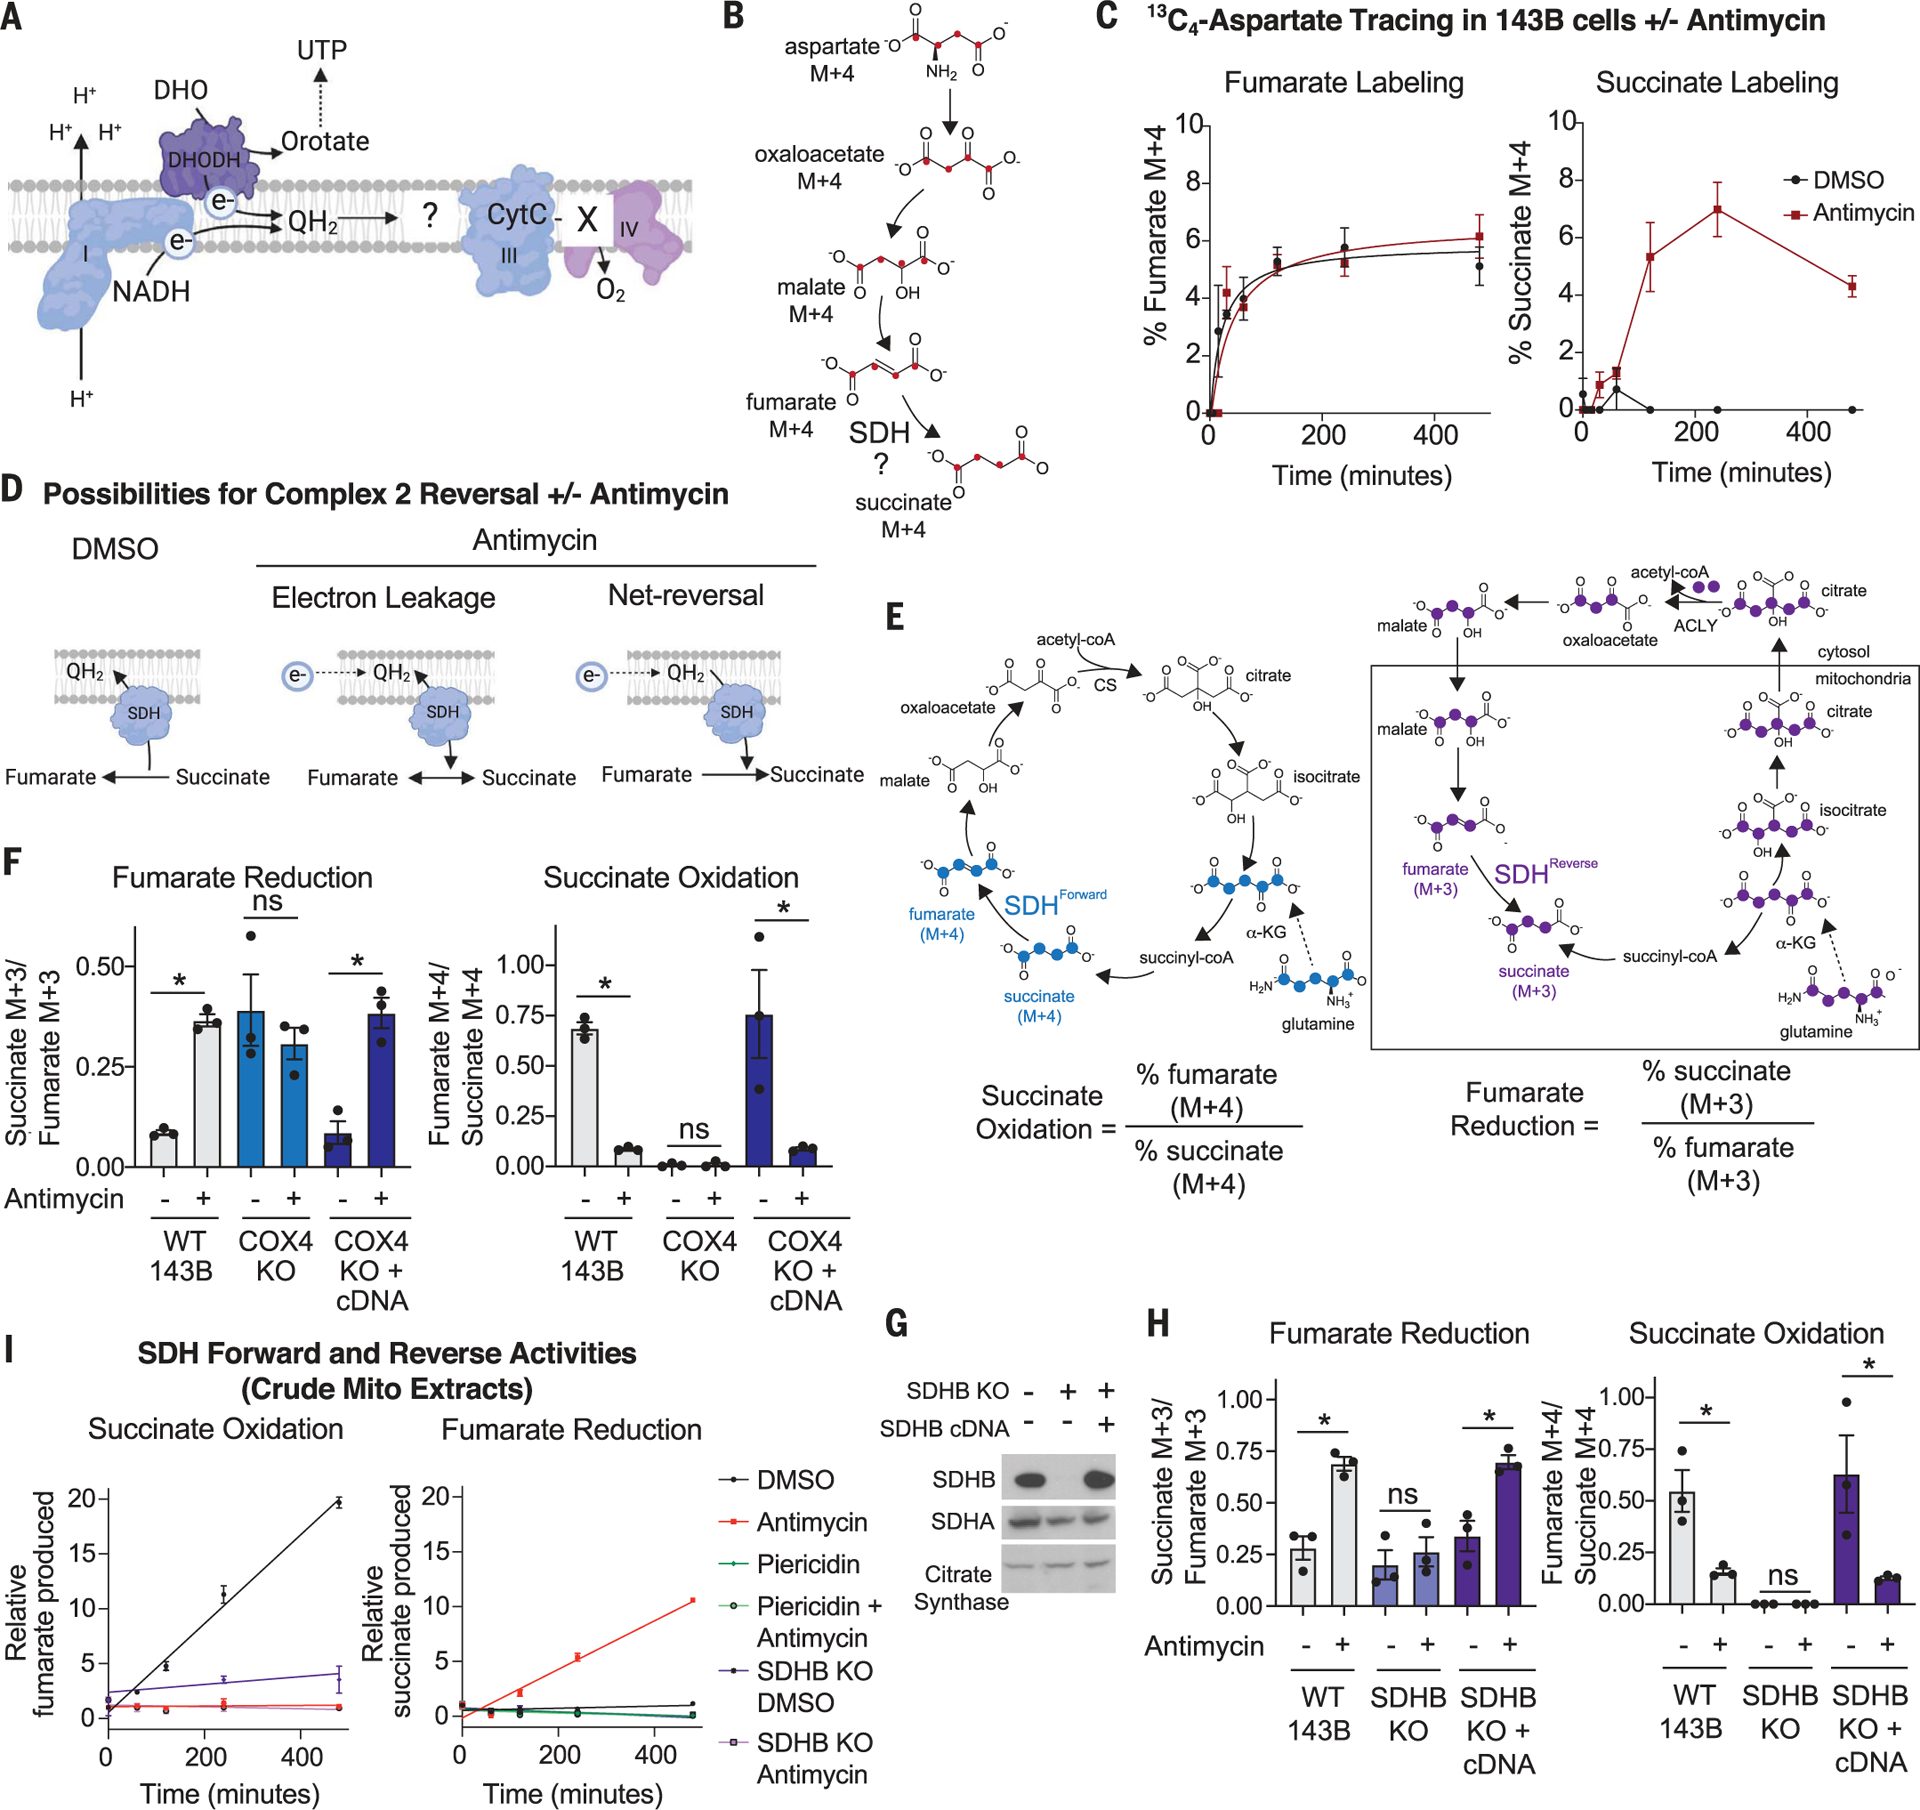
(A) Schematic depicting the question “what is the fate of electrons in the ETC when O2 cannot be reduced?” (B) Schematic showing the expected isotopologues produced during 13C4-aspartate tracing if succinate is generated from fumarate. (C) Percent labeled fumarate and succinate from a stable isotope tracing experiment using 3 mM 13C4-aspartate. WT 143B cells were treated with DMSO or 500 nM antimycin for the indicated times (mean ± SEM, n = 3 biological replicates per time point). (D) Schematic depicting the reduction of fumarate from either electron leakage onto fumarate or net reversal of SDH upon antimycin treatment. (E) Schematic demonstrating the expected isotopologues of TCA cycle metabolites produced during 13C515N2-glutamine tracing. The forward direction of the SDH reaction can be monitored with the ratio of percent labeled fumarate M + 4 to percent labeled succinate M + 4. The reverse direction of the SDH reaction can be monitored with the ratio of percent labeled succinate M + 3 to percent labeled fumarate M + 3. ACLY, ATP citrate lyase; CoA, coenzyme A; CS, citrate synthase; α-KG, α-ketoglutarate. (F) Fumarate reduction and succinate oxidation as determined using stable isotope tracing of 2 mM 13C515N2-glutamine. Tracing was performed for 8 hours in WT, COX4 KO, and COX4 KO 143B cells expressing the COX4 cDNA and treated with DMSO or 100 nM antimycin for 8 hours (mean ± SEM, n = 3 biological replicates per condition). ns, not significant. (G) Immunoblot analyses for indicated proteins in SDHB KO and SDHB cDNA addback 143B cells. (H) Fumarate reduction and succinate oxidation as determined using stable isotope tracing of 2 mM 13C515N2-glutamine. Tracing was performed for 8 hours in WT, SDHB KO, and SDHB KO 143B cells expressing the SDHB cDNA and treated with DMSO or 100 nM antimycin for 8 hours (mean ± SEM, n = 3 biological replicates per condition). (I) SDH activity in purified mitochondria from WT and SDHB KO 143B cells. The succinate oxidation reaction was initiated by adding 10 mM succinate and monitored by the production of fumarate over time. The fumarate reduction reaction was initiated with 10 mM fumarate and 1 mM NADH and monitored through the production of succinate over time; 1 μM antimycin and 1 μM piericidin were included as indicated (mean ± SEM, n = 3 biological replicates per time point). Data points were fitted using linear regression. *P < 0.05 for all experiments. P values were calculated using an unpaired parametric t test.
Although there is agreement that succinate accumulates in mammalian cells under hypoxia, its source is contentious (42). Stable isotope tracing studies demonstrate that most of the succinate pool in hypoxic cells derives from α-ketoglutarate through oxidative tricarboxylic acid (TCA) cycle flux (43, 44). However, numerous studies find that a large fraction of the succinate pool comes from fumarate upon a block in O2 reduction (38–40, 45). This reaction is likely catalyzed by the succinate dehydrogenase (SDH) protein complex (complex II), although, given the electrophilicity of fumarate, it is also possible that fumarate is reduced in an unregulated, nonenzymatic fashion.
Fumarate reduction can be monitored in cells by the stable isotope tracing of either 13C4-aspartate or 13C515N2-glutamine. 13C4-aspartate contributes to the fumarate pool via oxaloacetate and malate and so should lead to the production of 13C4-succinate upon fumarate reduction (Fig. 2B). 13C515N2-glutamine contributes to the fumarate pool through the reductive arm of the TCA cycle via glutamate, α-ketoglutarate, isocitrate, citrate, oxaloacetate, and malate (38, 39). A key distinction between the two labeling approaches is that 13C515N2-glutamine enriches the fumarate pool more upon antimycin treatment owing to enhanced reductive carboxylation flux (38, 39), whereas 13C4-aspartate labels the fumarate pool to equivalent extents in vehicle- and antimycin-treated cells (Fig. 2C). Therefore, with stable isotope tracing of 13C4-aspartate, the amount of 13C4-succinate is a direct measure of fumarate reduction, whereas the stable isotope tracing of 13C515N2-glutamine requires a ratiometric analysis of labeled succinate to labeled fumarate to normalize for differences in the extent of fumarate labeling.
Antimycin robustly stimulated the conversion of fumarate into succinate, as monitored by the production of 13C4-succinate over time and the ratio of percent 13C4-succinate to percent 13C4-fumarate when 13C4-aspartate labeling was in the steady state (Fig. 2C and fig. S2, B to D). Given this, we reasoned that even if—as has been argued (43, 44)—fumarate is not the major source of succinate accumulation in hypoxic cells, it could still serve as a TEA when O2 reduction is limiting. However, there could be two explanations for the increase in fumarate reduction caused by hypoxia and antimycin treatment: minor electron leakage onto the electrophilic molecule fumarate, similar to how electrons leak out of complexes I and III nonspecifically to generate reactive oxygen species (ROS), or net reversal of the SDH complex, in which the rate of fumarate reduction exceeds that of succinate oxidation (Fig. 2D). In both cases, hypoxia would stimulate fumarate to succinate conversion, but only net reversal would enable efficient reoxidation of UQH2 and thereby sustain the input of electrons into the ETC from complex I and DHODH.
To formally test whether hypoxia triggers net reversal of the SDH complex, we used the 13C515N2-glutamine tracer, which enables simultaneous quantification of the forward and reverse activities of SDH through the generation of specific isotopologues upon flux through the oxidative arm (α-ketoglutarate to succinate) rather than through the reductive arm (α-ketoglutarate, through citrate, to fumarate) of the TCA cycle (Fig. 2E). In this assay, the forward (succinate oxidation) reaction is the ratio of percent labeled 13C4-fumarate to its precursor 13C4-succinate (Fig. 2E), and the reverse (fumarate reduction) reaction is the ratio of percent labeled 13C3-succinate to its precursor 13C3-fumarate (Fig. 2E). This analysis was performed when the labeling is in the steady state after 4 to 8 hours of incubation with 13C515N2-glutamine (fig. S2, E and F). Notably, this ratiometric analysis of the succinate and fumarate isotopologues eliminates biases caused by higher 13C3-fumarate labeling in antimycin-treated cells (fig. S2E).
Inhibition of O2 reduction by antimycin or hypoxia decreased succinate oxidation and increased fumarate reduction, which are the SDH forward and reverse activities, respectively (Fig. 2F and fig. S2G). Because the ratio of isotopologues representing fumarate reduction exceeded those for succinate oxidation by approximately fourfold, we conclude that antimycin treatment and hypoxia exposure cause higher levels of fumarate reduction than succinate oxidation. Likewise, the UQCRC2 and COX4 knockout cells had approximately six- and eightfold higher levels of fumarate reduction than succinate oxidation, respectively, whereas the opposite was true in the control cells (Fig. 2F and fig. S3, A to E). Expression in the knockout cells of the UQCRC2 or COX4 cDNA rescued O2 consumption and restored succinate oxidation and fumarate reduction reactions and their sensitivity to antimycin treatment to close to wild-type levels (Fig. 2F and fig. S3, A to E). In cells lacking either the SDHA or SDHB component of the SDH complex, the fumarate reduction and succinate oxidation reactions were not altered by antimycin treatment (Fig. 2, G and H, and fig. S3, F and G). Expression in the knockout cells of the respective cDNAs restored the increase in fumarate reduction and decrease in succinate oxidation caused by antimycin treatment (Fig. 2, G and H, and fig. S3, F and G). Similarly, the complex II inhibitor malonic acid almost completely ablated fumarate reduction in UQCRC2 and COX4 knockout cells and had no effect on SDHB knockout cells (fig. S3, H and I). Dimethyl succinate treatment slightly suppressed antimycin-induced fumarate reduction, which is consistent with high succinate levels inhibiting SDH activity (fig. S3J). Taken together, these data demonstrate that the SDH complex catalyzes more fumarate reduction than succinate oxidation when electrons cannot be transferred to O2, suggesting a net reversal of its activity.
In the untreated wild-type, SDHA, and SDHB knockout cells, we detected similar background levels of fumarate reduction, which are likely caused by the nonenzymatic reduction of fumarate into succinate, consistent with its electrophilic nature. To test whether electron leakage out of the ETC contributes to background fumarate reduction, we treated 143B cells with the mitochondrial-targeted antioxidant MitoTEMPO in the presence or absence of antimycin (fig. S3K). MitoTEMPO caused a significant decrease in fumarate reduction in vehicle-treated cells but did not affect fumarate reduction in antimycin-treated cells (fig. S3K), suggesting that electron leakage may contribute to baseline levels of fumarate reduction.
Consistent with results in 143B cells, antimycin treatment increased fumarate reduction in a panel of human cancer cell lines (SW1353, U87, DLD1, and HCT116), in the mouse myo-blast cell line C2C12, in primary dermal fibro-blasts, and in mink lung epithelial cells (fig. S4, A to D). These data generalize the conclusion that inhibition of O2 reduction leads to a rewiring of electron flow in the ETC to enable fumarate reduction.
To ask whether net reversal can also occur in a cell-free system, we examined SDH activity in permeabilized purified mitochondria. The rate of succinate oxidation was measured by monitoring fumarate production over time after initiating the reaction with succinate. The rate of fumarate reduction was measured in a separate assay by monitoring the rate of succinate production over time after initiating the reaction with fumarate and NADH. Consistent with the stable isotope tracing experiments in live cells, vehicle-treated mitochondria had a higher rate of succinate oxidation than fumarate reduction, whereas the opposite was the case in antimycin-treated mitochondria (Fig. 2I). Mitochondria that lacked the SDH complex did not exhibit any succinate oxidation or fumarate reduction, and complex I inhibition by piericidin suppressed the fumarate reduction caused by antimycin treatment (Fig. 2I), demonstrating that electrons enter the ETC from complex I and exit onto fumarate via SDH.
Ubiquinol accumulation is required for SDH reversal
Our data so far suggest that upon inhibition of O2 reduction, the reduced electron carrier UQH2 transfers electrons to fumarate, a reversal of the normal reaction catalyzed by SDH in which succinate deposits electrons onto the oxidized electron carrier UQ. Net reversal of the mammalian SDH complex has been considered thermodynamically unfavorable because the standard reduction potential of UQ is slightly greater than that of fumarate (46). Moreover, unlike lower eukaryotes, mammals do not appear to have a distinct electron carrier with a lower reduction potential that could facilitate fumarate reduction (37). Because the reduction potential of UQ and fumarate are very close to each other (~10 mV apart), we considered the possibility that UQH2 accumulation drives the net reversal of the SDH complex in mammalian cells upon suppression of O2 reduction (Fig. 3A). To test this, we took advantage of the enzyme alternative oxidase (AOX), which oxidizes UQH2 to UQ in an antimycin-insensitive manner (47, 48). If UQH2 accumulation is necessary to drive SDH in reverse, AOX expression should prevent net reversal of SDH when O2 reduction is blocked by maintaining an oxidized UQ pool (Fig. 3A).
Fig. 3. Fumarate reduction is required to maintain nucleotide biosynthesis and the mitochondrial membrane potential in cells deficient in O2 reduction.
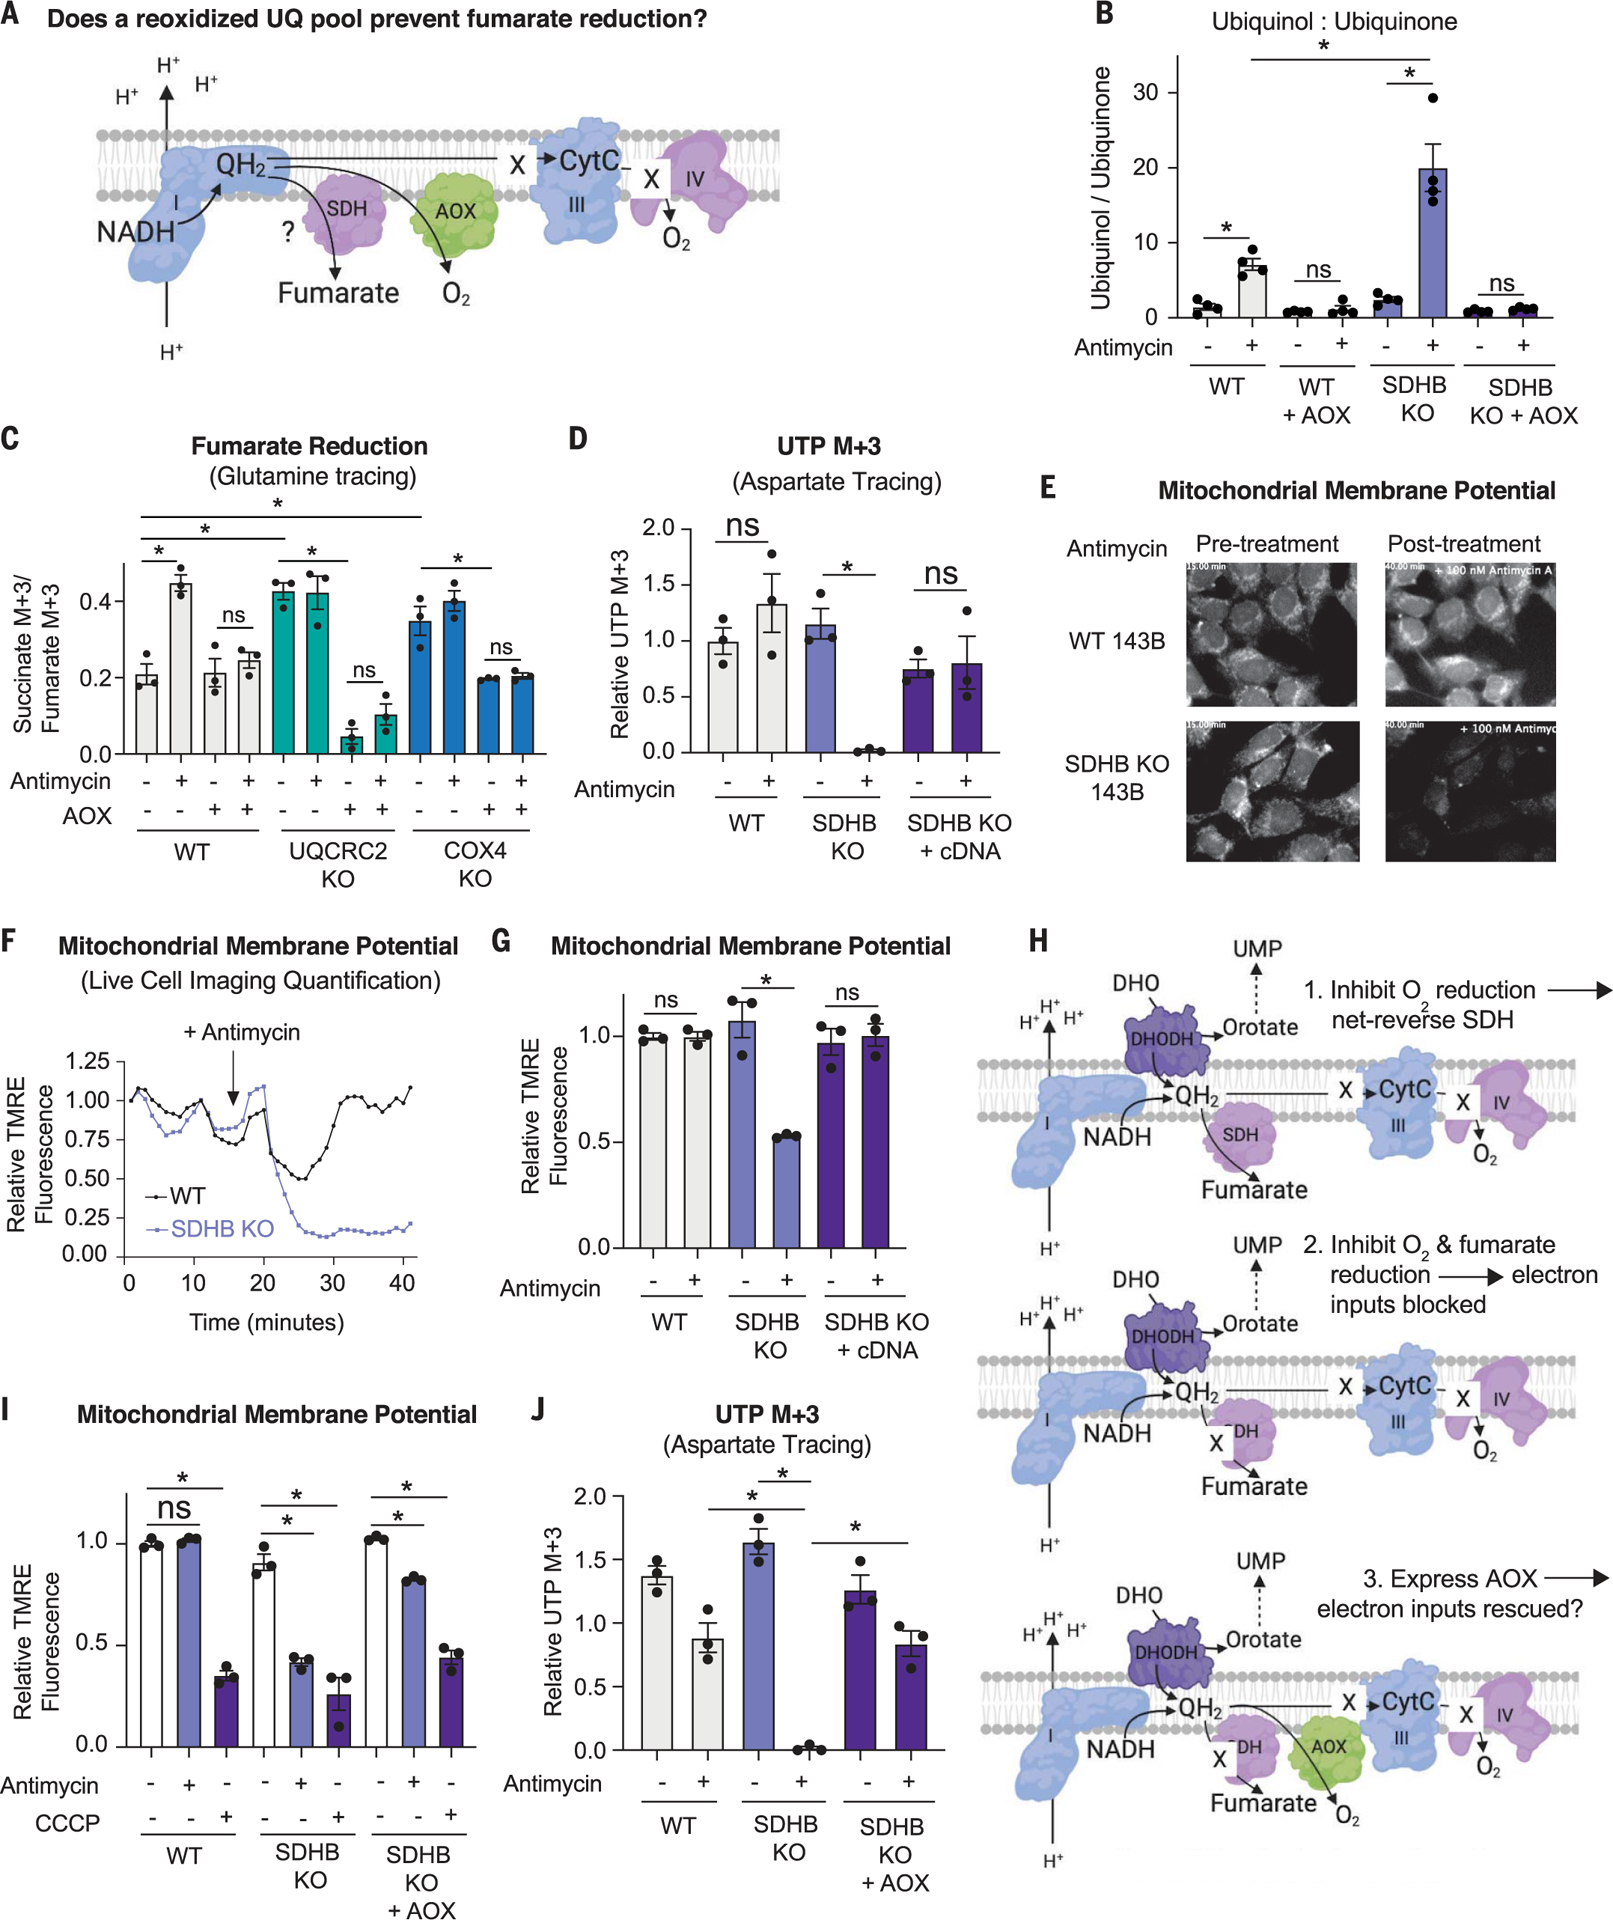
(A) Schematic depicting the potential impact of alternative oxidase (AOX) on the accumulation of QH2 in cells deficient for complex III or IV activity and the consequences for fumarate reduction. (B) Ratio of ion counts of ubiquinol to ubiquinone as measured by LC-MS on mitochondria isolated from WT and SDHB KO 143B cells expressing or not expressing AOX and treated with DMSO or 500 nM antimycin for 3 hours (mean ± SEM, n = 4 biological replicates per condition). *P < 0.05. P values were calculated using a two-way ANOVA. (C) Relative fumarate reduction as determined using stable isotope tracing of 2 mM 13C515N2-glutamine and the ratio of percent succinate M + 3 to percent fumarate M + 3, representing fumarate reduction in a stable isotope tracing experiment using 2 mM 13C515N2-glutamine. Tracing was performed for 8 hours in WT, UQCRC2 KO, and COX4 KO 143B cells expressing or not expressing AOX and treated with DMSO or 500 nM antimycin (mean ± SEM, n = 3 biological replicates per condition). *P < 0.05. P values were calculated using a two-way ANOVA. (D) DHODH activity as measured by stable isotope tracing with 10 mM 13C4- aspartate, which generates 13C3-UTP if DHODH is active. Tracing was for 8 hours in WT, SDHB KO, and KO 143B cells with the SDHB cDNA expressed and treated with DMSO or 500 nM antimycin (mean ± SEM, n = 3 biological replicates per condition). *P < 0.05. P values were calculated using a parametric t test. (E) First and last images from a live-cell imaging video of WT and SDHB KO 143B cells treated with DMSO or 100 nM antimycin. (F) Quantification of the mitochondrial membrane potential using live-cell imaging of WT and SDHB KO 143B cells treated with 100 nM antimycin, which was added at the time point indicated with the arrow. (G) Mitochondrial membrane potential of WT, SDHB KO, and SDHB KO cells expressing the SDHB cDNA treated with either DMSO or 500 nM antimycin for 1 hour (mean ± SEM, n = 3 biological replicates per condition). *P < 0.05. P values were calculated using a parametric t test. (H) Schematic depicting the hypothesis that expression of AOX will rescue complex I and DHODH activities in SDH KO cells treated with antimycin. UMP, uridine 5′-monophosphate. (I) Mitochondrial membrane potential in WT, SDHB KO, and SDHB KO 143B cells expressing AOX and treated with DMSO, 500 nM antimycin for 1 hour (mean ± SEM, n = 3 biological replicates per condition). *P < 0.05. P values were calculated using a two-way ANOVA. (J) DHODH activity as measured via stable isotope tracing with 10 mM 13C4- aspartate, which generates 13C3-UTP if DHODH is active. Tracing was performed for 8 hours in WT, SDHB KO, and SDHB KO 143B cells expressing AOX and treated with DMSO or 500 nM antimycin (mean ± SEM, n = 3 per biological replicates condition). *P < 0.05. P values were calculated using a two-way ANOVA.
We targeted AOX to the mitochondrial inner membrane (fig. S5A), where, consistent with its role in maintaining an oxidized UQ pool, it blunted NADH and UQH2 accumulation upon antimycin treatment (Fig. 3B and fig. S5B). Notably, the levels of UQH2 and the ratio of UQH2 to UQ were greater in antimycin-treated SDHB knockout cells than in antimycin-treated wild-type cells, which is consistent with the SDH complex playing a critical role in UQH2 reoxidation upon antimycin treatment (Fig. 3B). Expression of AOX in SDHB knockout cells blunted the accumulation of UQH2 upon antimycin treatment (Fig. 3B and fig. S5, C and D). Similarly, expression of AOX in UQCRC2 and COX4 knockout cells reduced the UQH2/UQ ratio and the levels of UQH2 (fig. S5, E to I).
To determine whether UQH2 accumulation is required to reverse the SDH complex, we used stable isotope tracing of both 13C515N2-glutamine and 13C4-aspartate to measure fumarate reduction in AOX-expressing wild-type cells as well as those lacking UQCRC2 or COX4 (Fig. 3C and fig. S6, A and B). Consistent with the idea that UQH2 accumulation is required to reverse SDH upon inhibition of O2 reduction, AOX expression fully suppressed the increase in fumarate reduction caused by antimycin treatment in wild-type cells (Fig. 3C and fig. S6, A and B). Similarly, AOX expression in the UQCRC2 and COX4 knockout cells also suppressed fumarate reduction and almost completely restored succinate oxidation to wild-type levels (Fig. 3C and fig. S6, A and B).
We corroborated the impact of AOX expression on SDH directionality by using permeabilized purified mitochondria from AOX-expressing 143B cells treated with vehicle or antimycin. As before (Fig. 2I), we monitored the SDH forward (succinate oxidation) and reverse (fumarate reduction) reactions over time. Consistent with the stable isotope tracing results in live cells, AOX expression prevented fumarate reduction upon antimycin treatment (fig. S6C). Taken together, these data demonstrate that when O2 reduction is blocked, UQH2 accumulation is required for SDH reversal.
Fumarate reduction sustains electron inputs into the ETC when O2 reduction is suppressed
To understand the potential importance of fumarate reduction, we asked whether it is required for cells that are incapable of using O2 as a TEA to sustain mitochondrial functions, such as de novo pyrimidine biosynthesis through DHODH, which requires the deposition of electrons into the ETC. If fumarate reduction sustains DHODH activity upon inhibition of O2 reduction, we expect that simultaneous loss of both TEAs—O2 and fumarate—will suppress this reaction. Indeed, antimycin ablated DHODH activity (as read out by 13C3-UTP production) in SDHB-deficient cells but had no effect in wild-type cells, knockout cells complemented with the SDHB cDNA, or knockout cells complemented with a class 1 DHODH that directly deposits electrons on fumarate as opposed to UQ (Fig. 3D and fig. S6D).
Next, we tested whether fumarate reduction sustains complex I activity in cells incapable of using O2 as a TEA. To do so, we measured both the NAD+/NADH ratio, which is an indicator of complex I–mediated NADH reoxidation, and the mitochondrial membrane potential (ΔΨMito), to which complex I contributes via proton pumping. As with DHODH activity, we reasoned that simultaneous inhibition of fumarate and O2 reduction would reduce complex I activity, causing a decrease in the NAD+/NADH ratio and depolarization of the ΔΨMito. Consistent with this idea, SDHB-null cells treated with antimycin, which cannot use fumarate or O2 as a TEA, had a lower NAD+/NADH ratio than wild-type cells treated with antimycin (fig. S6, E to G). Moreover, the ΔΨMito, which we monitored using the fluorescent dye tetramethylrhodamine ethyl ester (TMRE), was substantially more depolarized in SDHB-null cells after 30 min of antimycin treatment than in wild-type cells (Fig. 3, E and F), in a fashion complemented by the SDHB cDNA (Fig. 3G). Notably, treatment with 250 nM carbonyl cyanide 3-chlorophenylhydrazone (CCCP), which specifically uncouples the ΔΨMito without affecting the plasma membrane potential, reduced fluorescence, indicating that the TMRE dye was not in quench mode (fig. S6H) (49). Upon antimycin treatment, wild-type cells displayed an initial reduction in the ΔΨMito, which was restored to pretreatment levels with a similar timing as it takes for antimycin to increase fumarate reduction (Fig. 3F and fig. S6I). The effects of antimycin treatment on ΔΨMito were further corroborated in the contexts of pharmacologic and genetic suppression of SDHA activity (fig. S6, J and K), and notably, antimycin treatment did not alter mtDNA copy number in the SDHA and SDHB knockout cells (fig. S6, L and M). Thus, fumarate reduction supports partial complex I activity, specifically NADH reoxidation and ΔΨMito, in cells incapable of reducing O2 in the ETC.
Thus far, our data establish that the SDH complex is required to maintain DHODH and complex I activities when O2 reduction is impeded. To determine whether these defects are caused by a lack of electron removal from the ETC onto fumarate and thus an inability to reoxidize UQH2 (47), we tested whether expression of AOX could restore DHODH activity and the ΔΨMito in cells that are unable to use both fumarate and O2 as TEAs (Fig. 3H). To do so, we expressed AOX in SDHB knockout cells and measured ΔΨMito and DHODH activity upon antimycin treatment. Indeed, expression of AOX in SDHB knockout cells almost completely prevented depolarization of ΔΨMito and the reduction in DHODH activity upon antimycin treatment (Fig. 3, I and J). Thus, we conclude that simultaneous loss of electron transfer to fumarate and O2 ablates mitochondrial functions that are dependent on electron input into the ETC and that these functions can be restored by reoxidation of UQH2 to UQ.
An expected consequence of complete loss of electron flow in the ETC is reduced proliferation rate because the ETC supports many biosynthetic pathways, including pyrimidines. Therefore, so long as there are sufficient nutrients to supply precursors for these biosynthetic pathways, we expect that fumarate reduction will support proliferation in cells incapable of using O2 as a TEA. Consistent with this idea, treatment of SDHB-null cells treated with antimycin in media containing high pyruvate and aspartate reduced proliferation more than wild-type cells (fig. S6N). Similarly, treatment of UQCRC2 and COX4 knockout cells with the complex II inhibitor malonic acid significantly reduced their proliferation (fig. S6, O and P). Thus, in the context of sufficient metabolic precursors, fumarate reduction can support the proliferation of cells incapable of using O2 as a TEA.
Fumarate is a terminal electron acceptor in mouse tissues
To understand the physiological relevance of fumarate reduction, we traced 13C515N2-glutamine in 143B cells cultured at O2 concentrations that fall within the 1 to 15% range observed in tissues in vivo (8). Notably, although fumarate reduction was undetectable at 20% O2, even a decrease to 15% was sufficient to stimulate fumarate reduction, which continued to increase as O2 concentrations were lowered until it reached a maximum at 3% O2 (fig. S7A).
To investigate fumarate reduction in vivo, we applied the 13C515N2-glutamine tracing technique to mouse tissues. Mice were injected with 13C515N2-glutamine, followed by absolute quantification of the succinate and fumarate isotopologues in tissues. SDH activities were quantified by calculating the ratio of the picomoles of M + 4 isotopologues, representing succinate oxidation, and of M + 3 isotopologues, representing fumarate reduction (Fig. 4A). Notably, because these in vivo tracing experiments were performed with a bolus injection, the labeling was not in the steady state, and therefore, the forward and reverse SDH activities in a given tissue could not be compared with one another (50).
Fig. 4. Fumarate reduction supports mitochondrial functions in tissues capable of net reversal of the SDH reaction.
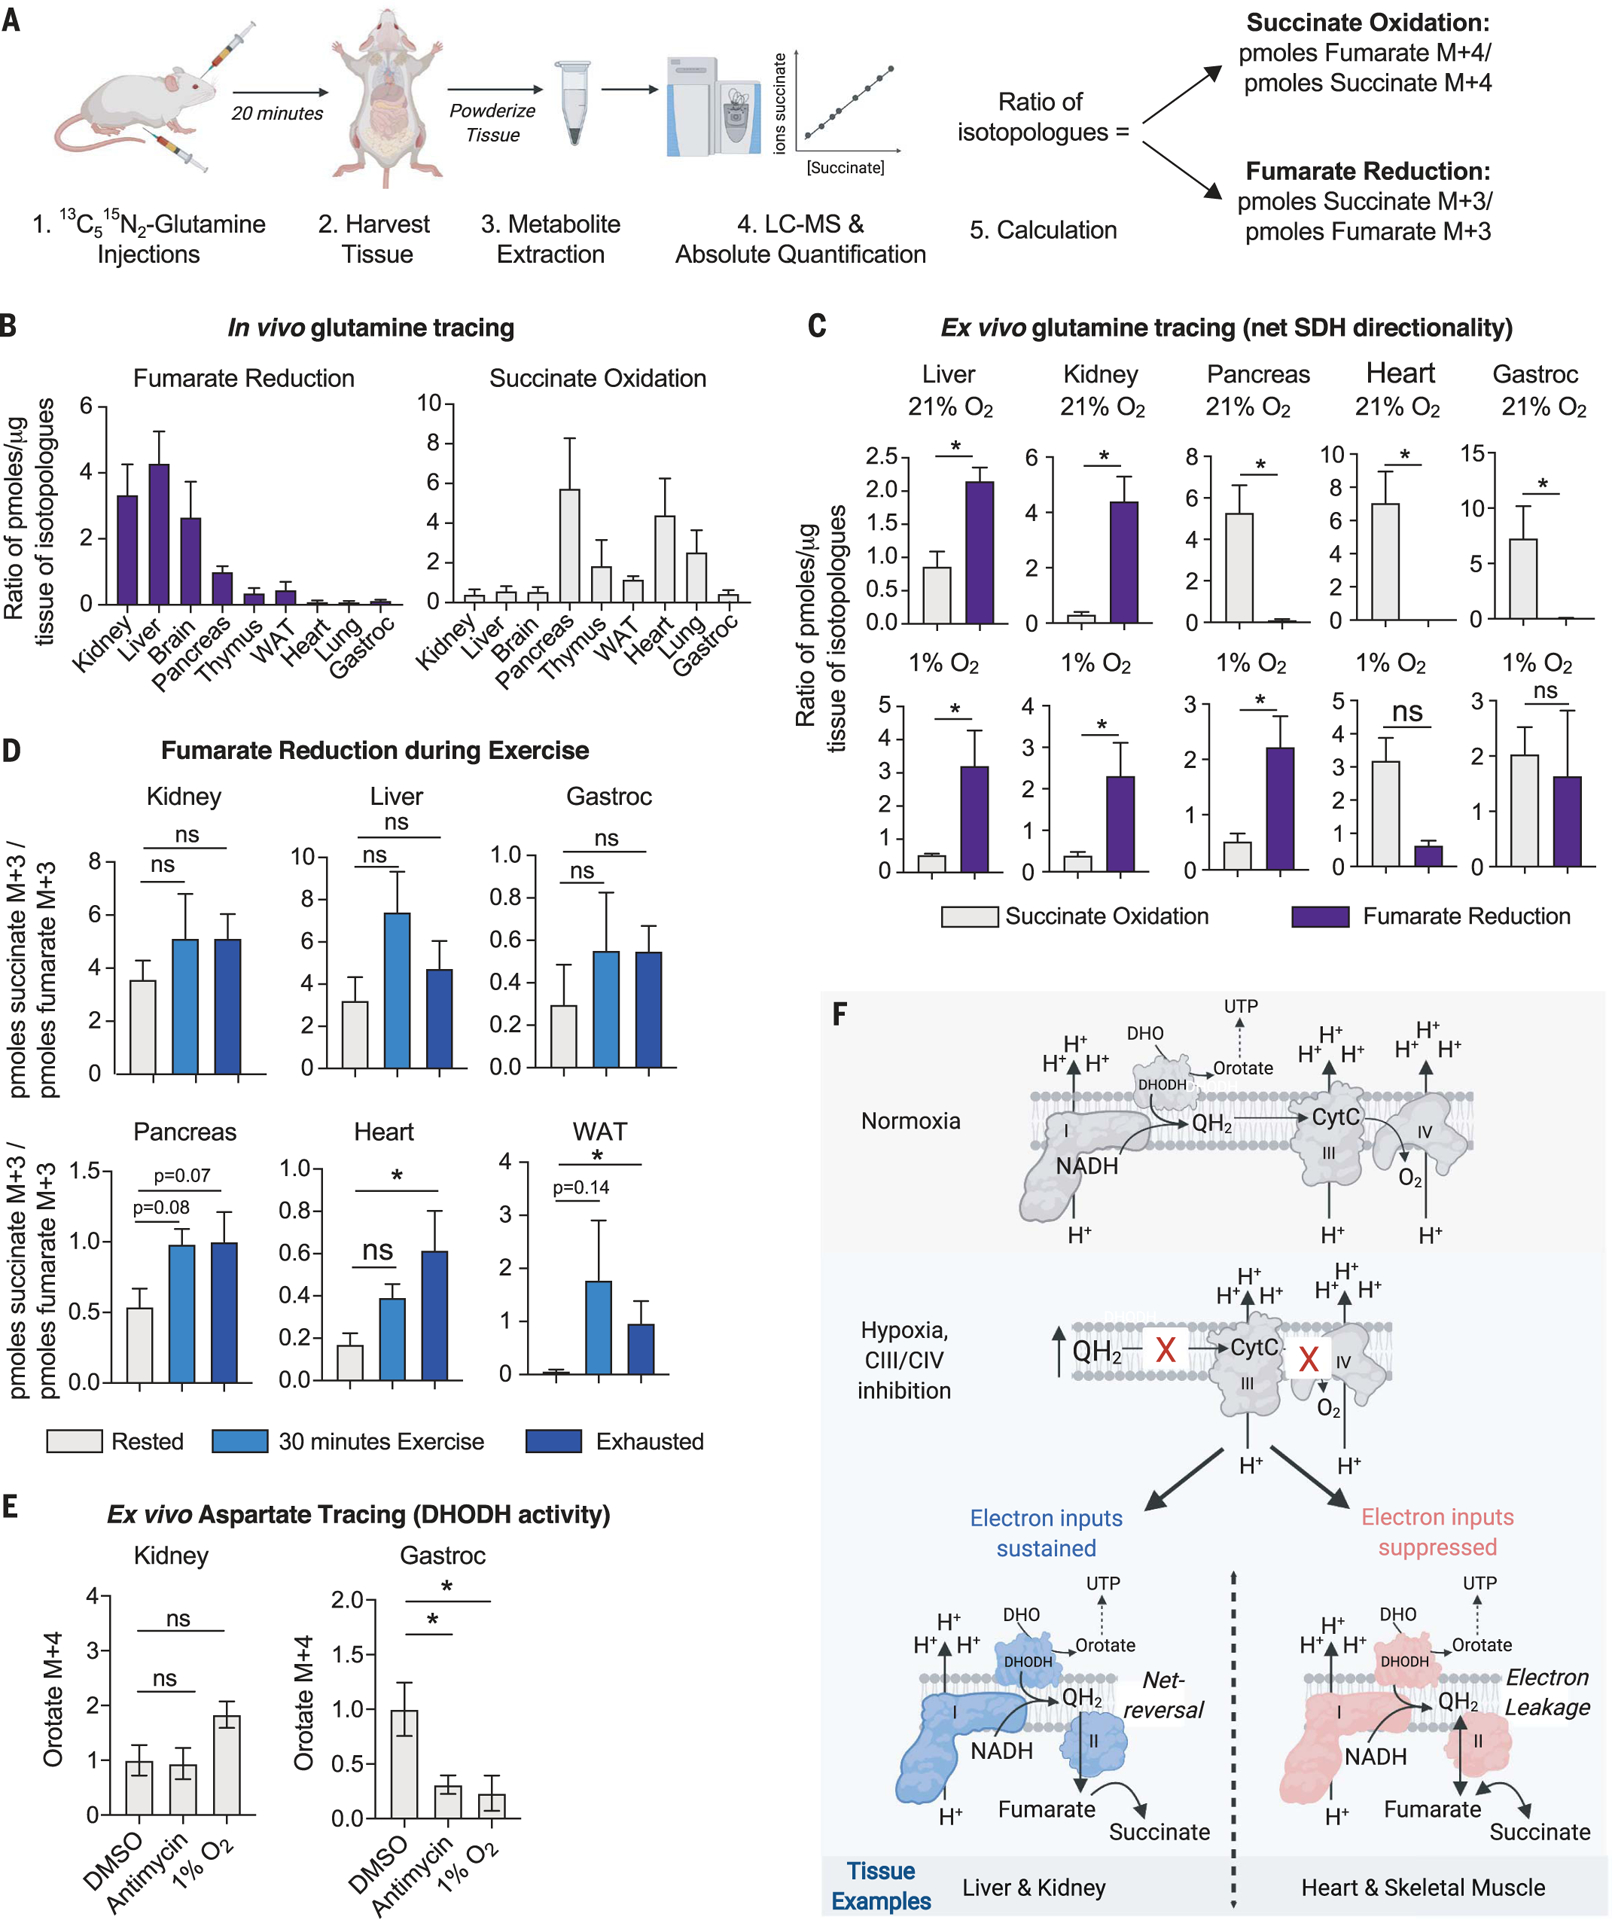
(A) Depiction of the workflow for the in vivo 13C515N2-glutamine stable isotope tracing experiment to measure the net directionality of the SDH complex in tissues. (B) In vivo stable isotope tracing of 13C515N2-glutamine in indicated tissues. Mice were euthanized 20 min after retroorbital and intraperitoneal injections. Succinate oxidation was calculated as the ratio of picomoles fumarate M + 4 to picomoles succinate M + 4. Fumarate reduction was calculated as the ratio of picomoles succinate M + 3 to picomoles fumarate M + 3 (mean ± SEM, n = 4 per condition). (C) Tissue-autonomous succinate oxidation or fumarate reduction as determined with ex vivo 2 mM 13C515N2-glutamine stable isotope tracing for 24 hours in indicated tissues kept in a tissue culture incubator at 21% O2 or a hypoxia incubator (1% O2). Succinate oxidation and fumarate reduction were calculated as described in (B) (mean ± SEM, n = 4 per condition). *P < 0.05. P values were calculated using a parametric t test. (D) In vivo 13C515N2-glutamine tracing in female mice 12 weeks old through intraperitoneal and intramuscular injections. Mice were rested, exercised for 30 min, or exercised until exhaustion for ~1.5 hours and then injected with 13C515N2-glutamine. The rested mice were euthanized 15 min after injection with no exercise, and the exercised mice continued to run on the treadmill for 15 min before being euthanized. Tissues were harvested for metabolite isolation and mass spectrometry. Absolute quantification was performed to calculate the concentration of succinate M + 3, succinate M + 4, fumarate M + 3, and fumarate M + 4 in picomoles per microgram tissue protein. The reported ratio representing fumarate reduction was calculated by the picomoles succinate M + 3 per microgram tissue protein to the picomoles fumarate M + 3 per microgram tissue protein. The reported ratio representing succinate oxidation was calculated by the picomoles fumarate M + 4 per microgram tissue protein to the picomoles succinate M + 4 per microgram tissue protein. Data represent the mean ± SEM, n = 5 mice per time point. *P < 0.05. P values were calculated using a two-way ANOVA. (E) Ex vivo 3 mM 13C4-aspartate stable isotope tracing for 16 hours in indicated tissues kept in an incubator at 21 or 1% O2 or treated with 2 μM antimycin. Orotate M + 4 levels reflect DHODH activity (mean ± SEM, n = 4 biological replicates per condition). *P < 0.05. P values were calculated using a two-way ANOVA. (F) Model in which net reversal of SDH supports certain mitochondrial functions in tissues under conditions that reduce electron transfer to O2.
The lung, heart, pancreas, thymus, white adi-pose tissue (WAT), and gastrocnemius muscle catalyzed little to no detectable fumarate reduction and high levels of succinate oxidation, whereas the kidney, liver, and brain appeared to catalyze high levels of fumarate reduction (Fig. 4B), suggesting that tissues may have differing capacities to utilize fumarate as a TEA at physiological O2 concentrations. The fumarate reduction and succinate oxidation reactions among mouse tissues did not correlate with their total levels or ratios of succinate and fumarate, nor their ratio of UQH2 to UQ (fig. S7, B to D). Notably, adenosine 5′-triphosphate (ATP) citrate lyase, an enzyme required for reductive carboxylation, was low in the heart and high in the liver (fig. S7E). Although this positively correlates with their capacity to do fumarate reduction, this correlation did not extend to other tissues. Moreover, all tissues sufficiently enriched the 13C3-fumarate pool upon injection with 13C515N2-glutamine, and across three different time points (10, 20, and 30 min) after injection, the ratio of isotopologues representing fumarate reduction and succinate oxidation remained similar, corroborating that differences exist among tissues in their ability to reduce fumarate at physiological O2 concentrations (fig. S8).
To determine whether the observed labeling in vivo is tissue autonomous and not from interorgan transfer of labeled metabolites (51), we performed ex vivo 13C515N2-glutamine tracing on mouse tissues cultured in incubators set to either 21 or 1% O2 (Fig. 4C and fig. S9, C and D). Notably, ex vivo 13C515N2-glutamine tracing enables steady-state labeling of the fumarate and succinate isotopologues after 16 hours (fig. S9, A and B), allowing us to directly compare forward and reverse SDH activities in each tissue. Similar to the retinas cultured ex vivo (45), even when cultured in atmospheric O2, the liver, kidney, and brain displayed higher levels of fumarate reduction than succinate oxidation, indicating that the SDH complex is intrinsically operating in reverse in these tissues (Fig. 4C and fig. S9, C and D). Similar to cultured cells, the pancreas, thymus, lung, WAT, heart, and gastrocnemius muscle all favor the succinate oxidation SDH activity over the fumarate reduction SDH activity when cultured in atmospheric O2 (Fig. 4C and fig. S9, C and D). Upon hypoxia exposure, all of these tissues undertook some level of fumarate reduction, but only a subset, including the liver, kidney, brain, pancreas, WAT, thymus, and lung, exhibited net reversal of SDH, in which fumarate reduction was greater than succinate oxidation (Fig. 4C and fig. S9, C and D). The heart and gastrocnemius muscle modestly increased fumarate reduction when exposed to hypoxia but did not net reverse the SDH complex (Fig. 4C and fig. S9, C and D).
Our results were corroborated with 13C4-aspartate tracing on mouse tissues cultured ex vivo in 21 and 1% O2, in which the production of 13C4-succinate was used as a proxy for fumarate reduction when labeling was in the steady state (fig. S10, A to C). Consistent with the apparently constitutive fumarate reduction in the brain, liver, and kidney and a lack of fumarate reduction in the heart and gastrocnemius muscle, we detected abundant 13C4-succinate labeling in the former, but not the latter, tissues cultured in atmospheric O2 (fig. S10B). Upon exposure to hypoxia, 13C4-succinate increased in all tissues (fig. S10C). Notably, incorporation of 13C4-aspartate into 13C2-succinate occurred in all tissues except the liver, kidney, and lung (fig. S10B), which may be partially driven by differences in citrate synthase levels and oxidative TCA cycle flux among tissues. Taken together, these data confirm—by using an orthogonal tracing approach—that hypoxia induces fumarate reduction in mouse tissues.
We next tested whether physiological perturbations that reduce tissue O2 concentrations can likewise lead to an increase in fumarate reduction. Exercise causes tissue hypoxia, and it has been observed that succinate levels increase in exercising humans and mice (41, 51). To test whether exercise causes an increase in fumarate reduction, we challenged mice to a short (30 min) or long (90 min) exercise regimen and then injected them with 13C515N2-glutamine and monitored the 13C3-succinate and 13C3-fumarate isotopologues in the kidney, liver, pancreas, gastrocnemius, heart, and WAT (Fig. 4D and fig. S11). Upon exercise challenge, 13C3-succinate significantly increased in the gastrocnemius, heart, and WAT, but not in the kidney, liver, or pancreas (fig. S11). To determine whether this increase in 13C3-succinate is driven by an increase in fumarate reduction, we calculated the ratio of the absolute concentration of 13C3-succinate to that of 13C3-fumarate, revealing that the heart and WAT, but not the kidney, liver, pancreas, and gastrocnemius, increase fumarate reduction upon exercise (Fig. 4D). Notably, labeling is not in the steady state in this experiment, and therefore, the net directionality of the SDH complex upon exercise challenge cannot be determined by using this protocol. Nevertheless, these data clearly demonstrate that fumarate reduction increases in a subset of tissues upon exercise challenge.
Because net reversal of the SDH complex supports DHODH activity in cultured cells when O2 reduction is blocked (Fig. 3), we tested whether this was also true in mouse tissues. To do so, we measured DHODH activity in tissues that are capable (the liver and kidney) or incapable (the heart and gastrocnemius muscle) of net reversing the SDH complex when O2 reduction is limited. Antimycin treatment ablated O2 consumption in the liver, kidney, heart, and gastrocnemius muscle ex vivo, but only the liver and kidney maintained net reversal of the SDH complex (fig. S12, A and B). DHODH activity was assessed via 13C4-aspartate incorporation into 13C4-orotate because labeling of the 13C3-UTP pool was undetectable in most tissues. Antimycin treatment or hypoxia exposure reduced the levels of 13C4-orotate in the heart and gastrocnemius muscle, whereas they remained unchanged in the liver and kidney, which net reverse the SDH complex (Fig. 4E and fig. S12C). These data suggest that the ability to maintain DHODH activity correlates with the ability of a tissue to net reverse the SDH complex upon inhibition of O2 reduction.
Discussion
Here, we have elucidated a circuit of electron flow in the ETC of mammalian mitochondria that does not require O2 as a TEA. Although the O2 consumption rate is classically used as a metric for electron flow through the ETC, our study suggests caveats in directly equating O2 consumption with ETC flux and overall mitochondrial function. In adapting to O2 limitation, mammalian mitochondria use fumarate as a TEA. The accumulation of UQH2 in hypoxia or upon inhibition of complexes III or IV drives the SDH complex in reverse to enable electron deposition onto fumarate. Fumarate reduction sustains the input of electrons into the ETC by complex I and DHODH, enabling NADH reoxidation and de novo pyrimidine biosynthesis. Although in vivo, all tested tissues perform fumarate reduction upon hypoxia exposure, only a subset net reverse the SDH reaction, and only these can maintain electron inputs into the ETC (Fig. 4F).
The surprising differences among tissues in their ability to reduce fumarate likely come from the distinctive roles of mitochondria in each tissue. For example, the heart and skeletal muscle could favor the forward SDH activity over the reverse SDH activity to maximize ATP production, whereas the kidney and brain may reduce fumarate to minimize the electron leakage out of complex III that generates ROS. Moreover, similar to the retina within the eye (45), we expect interesting differences in fumarate reduction among cell types within a tissue, such as the thymus, that on a bulk tissue scale, display some degree of both the forward and reverse SDH activities at physiological O2 concentrations. The full extent to which fumarate reduction contributes to normal physiology and the ways in which fumarate reduction is regulated remain to be understood.
Our data also provide clarity to the long-standing observation that mtDNA-deficient cells require uridine to proliferate (52). The lack of DHODH activity to support pyrimidine biosynthesis in these cells has always been attributed to a deficiency in their ability to transfer electrons to oxygen as a TEA. Notably, fumarate reduction by the SDH complex, which is encoded by the nuclear genome, can support pyrimidine biosynthesis, albeit to a lesser extent than oxygen does (Fig. 1E). This is likely caused by less efficient electron transfer from ubiquinol onto fumarate compared with cytochrome c. Thus, mtDNA-deficient cells have the potential to use fumarate as a TEA to support pyrimidine biosynthesis. However, given their dependence on exogenous uridine for rapid proliferation, these cells are likely missing a different component of this pathway, and this warrants further investigation.
Beyond the fundamental role of fumarate reduction in mammalian mitochondria, there are many disease contexts to which fumarate reduction likely contributes. Fumarate reduction is likely important in diseases that cause tissue hypoxia such as ischemia, diabetes, obesity, and cancer. Cancer is an area of particular interest, given that some tumors have mutations in the SDH complex (53), the tumor microenvironment is hypoxic, and the ETC supports tumor growth in multi-faceted ways (18, 54–58). For example, given the importance of DHODH-mediated pyrimidine biosynthesis for tumor growth (21), fumarate reduction might sustain this process in the hypoxic tumor microenvironment. However, it is also possible that the nutrient limitations in the tumor microenvironment, particularly those of glucose and aspartate (23, 24, 59), may limit de novo pyrimidine biosynthesis. It will be critical for future work to investigate the role of fumarate reduction in the context of diseases such as cancer and to dissociate the forward and reverse activities of the SDH complex in each of these systems.
Supplementary Material
ACKNOWLEDGMENTS
We thank all members of the Sabatini lab for their thoughtful comments, especially G. Frenkel, A. Armani, and N. Kory for thoughtful feedback on the manuscript and experiments. We thank the Whitehead Institute Metabolite Profiling core for their assistance with experimental design and data interpretation and the Keck Imaging facility for help with microscopy experiments.
Funding:
This work was funded by an R01 application granted to D.M.S. (R01CA219859). J.B.S. is funded by the NCI F99/K00 predoctoral to postdoctoral transition fellowship (K00CA234839) and P.C.R. by a predoctoral fellowship from the NCI (F31CA254162-01). H.G.S. is funded by the DFG (Deutsche Forschungsgemeinschaft; SP 1897/1-1) and is a Hope Funds for Cancer Research Fellow supported by the Hope Funds for Cancer Research (HFCR-20-03-01). A.M.P. is funded by a William N. and Bernice E. Bumpus Fellowship, A.L.C. by an NIH F31 predoctoral fellowship (F31 5F31DK113665), K.J.C. by an MIT School of Science Fellowship in Cancer Research and an NSF fellowship (2016197106), and N.S.C. by NIH grants (R35CA197532 and 5P01AG049665). D.M.S. is formerly an investigator of the Howard Hughes Medical Institute.
Footnotes
Competing interests: All authors declare that they have no competing interests.
SUPPLEMENTARY MATERIALS
science.org/doi/10.1126/science.abi7495
Figs. S1 to S12 References (60–64)
MDAR Reproducibility Checklist
Data and materials availability:
All data are available in the manuscript or the supplementary materials. To ensure sustainable access to data and materials associated with this study, the institution has committed to assuring long-term access and has designated sabadmin@wi.mit.edu as a contact. Access to reagents not found on Addgene will be facilitated by sabadmin@wi.mit.edu.
REFERENCES AND NOTES
- 1.Chandel NS et al. , J. Biol. Chem 275, 25130–25138 (2000). [DOI] [PubMed] [Google Scholar]
- 2.Titov DV et al. , Science 352, 231–235 (2016). [DOI] [PMC free article] [PubMed] [Google Scholar]
- 3.Nakagawa T et al. , Nature 434, 652–658 (2005). [DOI] [PubMed] [Google Scholar]
- 4.Spinelli JB, Haigis MC, Nat. Cell Biol 20, 745–754 (2018). [DOI] [PMC free article] [PubMed] [Google Scholar]
- 5.Zhang H, Menzies KJ, Auwerx J, Development 145, dev143420 (2018). [DOI] [PMC free article] [PubMed] [Google Scholar]
- 6.Mick E et al. , eLife 9, e49178 (2020).32463360 [Google Scholar]
- 7.Condon KJ et al. , Proc. Natl. Acad. Sci. U.S.A 118, e2022120118 (2021).33483422 [Google Scholar]
- 8.Ast T, Mootha VK, Nat. Metab 1, 858–860 (2019). [DOI] [PubMed] [Google Scholar]
- 9.Peacock AJ, BMJ 317, 1063–1066 (1998). [DOI] [PMC free article] [PubMed] [Google Scholar]
- 10.Simon MC, Keith B, Nat. Rev. Mol. Cell Biol 9, 285–296 (2008). [DOI] [PMC free article] [PubMed] [Google Scholar]
- 11.Zheng L, Kelly CJ, Colgan SP, Am. J. Physiol. Cell Physiol 309, C350–C360 (2015). [DOI] [PMC free article] [PubMed] [Google Scholar]
- 12.Semenza GL, Nat. Rev. Cancer 3, 721–732 (2003). [DOI] [PubMed] [Google Scholar]
- 13.Keith B, Simon MC, Cell 129, 465–472 (2007). [DOI] [PMC free article] [PubMed] [Google Scholar]
- 14.Kalogeris T, Baines CP, Krenz M, Korthuis RJ, Int. Rev. Cell Mol. Biol 298, 229–317 (2012). [DOI] [PMC free article] [PubMed] [Google Scholar]
- 15.Palm F, Clin. Exp. Pharmacol. Physiol 33, 997–1001 (2006). [DOI] [PubMed] [Google Scholar]
- 16.Eltzschig HK, Carmeliet P, Engl N. J. Med 364, 656–665 (2011). [DOI] [PMC free article] [PubMed] [Google Scholar]
- 17.Vyas S, Zaganjor E, Haigis MC, Cell 166, 555–566 (2016). [DOI] [PMC free article] [PubMed] [Google Scholar]
- 18.Martínez-Reyes I et al. , Nature 585, 288–292 (2020). [DOI] [PMC free article] [PubMed] [Google Scholar]
- 19.Dumollard R, Duchen M, Carroll J, in The Mitochondrion in the Germline and Early Development, St. John JC, Ed. (Academic Press, 2007), vol. 77, pp. 21–49. [Google Scholar]
- 20.Nunnari J, Suomalainen A, Cell 148, 1145–1159 (2012). [DOI] [PMC free article] [PubMed] [Google Scholar]
- 21.Bajzikova M et al. , Cell Metab. 29, 399–416.e10 (2019). [DOI] [PMC free article] [PubMed] [Google Scholar]
- 22.Ansó E et al. , Nat. Cell Biol 19, 614–625 (2017). [DOI] [PMC free article] [PubMed] [Google Scholar]
- 23.Garcia-Bermudez J et al. , Nat. Cell Biol 20, 775–781 (2018). [DOI] [PMC free article] [PubMed] [Google Scholar]
- 24.Sullivan LB et al. , Nat. Cell Biol 20, 782–788 (2018). [DOI] [PMC free article] [PubMed] [Google Scholar]
- 25.Cardaci S et al. , Nat. Cell Biol 17, 1317–1326 (2015). [DOI] [PMC free article] [PubMed] [Google Scholar]
- 26.Wilson DF, Rumsey WL, Green TJ, Vanderkooi JM, J. Biol. Chem 263, 2712–2718 (1988). [PubMed] [Google Scholar]
- 27.Fukuda R et al. , Cell 129, 111–122 (2007). [DOI] [PubMed] [Google Scholar]
- 28.Lee P, Chandel NS, Simon MC, Nat. Rev. Mol. Cell Biol 21, 268–283 (2020). [DOI] [PMC free article] [PubMed] [Google Scholar]
- 29.Spinazzi M, Casarin A, Pertegato V, Salviati L, Angelini C, Nat. Protoc 7, 1235–1246 (2012). [DOI] [PubMed] [Google Scholar]
- 30.Jain IH et al. , Cell 181, 716–727.e11 (2020). [DOI] [PMC free article] [PubMed] [Google Scholar]
- 31.Tello D et al. , Cell Metab. 14, 768–779 (2011). [DOI] [PubMed] [Google Scholar]
- 32.Chan SY et al. , Cell Metab. 10, 273–284 (2009). [DOI] [PMC free article] [PubMed] [Google Scholar]
- 33.Frost MT, Wang Q, Moncada S, Singer M, Am. J. Physiol. Regul. Integr. Comp. Physiol 288, R394–R400 (2005). [DOI] [PubMed] [Google Scholar]
- 34.Jain IH et al. , Science 352, 54–61 (2016). [DOI] [PMC free article] [PubMed] [Google Scholar]
- 35.Hinkle PC, Butow RA, Racker E, Chance B, J. Biol. Chem 242, 5169–5173 (1967). [PubMed] [Google Scholar]
- 36.Robb EL et al. , J. Biol. Chem 293, 9869–9879 (2018). [DOI] [PMC free article] [PubMed] [Google Scholar]
- 37.Aloysius GM, Tielens AGM, Van Hellemond JJ, Biochim. Biophys. Acta Bioenerg 1365, 71–78 (1998). [DOI] [PubMed] [Google Scholar]
- 38.Mullen AR et al. , Nature 481, 385–388 (2011). [DOI] [PMC free article] [PubMed] [Google Scholar]
- 39.Metallo CM et al. , Nature 481, 380–384 (2011). [DOI] [PMC free article] [PubMed] [Google Scholar]
- 40.Chouchani ET et al. , Nature 515, 431–435 (2014). [DOI] [PMC free article] [PubMed] [Google Scholar]
- 41.Reddy A et al. , Cell 183, 62–75.e17 (2020). [DOI] [PMC free article] [PubMed] [Google Scholar]
- 42.Chinopoulos C, Int. J. Biochem. Cell Biol 115, 105580 (2019). [DOI] [PubMed] [Google Scholar]
- 43.Zhang J et al. , Cell Rep. 23, 2617–2628 (2018). [DOI] [PMC free article] [PubMed] [Google Scholar]
- 44.Mullen AR et al. , Cell Rep. 7, 1679–1690 (2014). [DOI] [PMC free article] [PubMed] [Google Scholar]
- 45.Bisbach CM et al. , Cell Rep. 31, 107606 (2020). [DOI] [PMC free article] [PubMed] [Google Scholar]
- 46.Pershad HR, Hirst J, Cochran B, Ackrell BAC, Armstrong FA, Biochim. Biophys. Acta 1412, 262–272 (1999). [DOI] [PubMed] [Google Scholar]
- 47.Guarás A et al. , Cell Rep. 15, 197–209 (2016). [DOI] [PubMed] [Google Scholar]
- 48.Perales-Clemente E et al. , Proc. Natl. Acad. Sci. U.S.A 105, 18735–18739 (2008). [DOI] [PMC free article] [PubMed] [Google Scholar]
- 49.Perry SW, Norman JP, Barbieri J, Brown EB, Gelbard HA, Biotechniques 50, 98–115 (2011). [DOI] [PMC free article] [PubMed] [Google Scholar]
- 50.Jang C, Chen L, Rabinowitz JD, Cell 173, 822–837 (2018). [DOI] [PMC free article] [PubMed] [Google Scholar]
- 51.Hochachka PW, Dressendorfer RH, Eur. J. Appl. Physiol. Occup. Physiol 35, 235–242 (1976). [DOI] [PubMed] [Google Scholar]
- 52.King MP, Attardi G, Science 246, 500–503 (1989). [DOI] [PubMed] [Google Scholar]
- 53.Selak MA et al. , Cancer Cell 7, 77–85 (2005). [DOI] [PubMed] [Google Scholar]
- 54.Viale A et al. , Nature 514, 628–632 (2014). [DOI] [PMC free article] [PubMed] [Google Scholar]
- 55.Weinberg F et al. , Proc. Natl. Acad. Sci. U.S.A 107, 8788–8793 (2010). [DOI] [PMC free article] [PubMed] [Google Scholar]
- 56.Boukalova S et al. , Mol. Cancer Ther 15, 2875–2886 (2016). [DOI] [PubMed] [Google Scholar]
- 57.Brown KK, Spinelli JB, Asara JM, Toker A, Cancer Discov. 7, 391–399 (2017). [DOI] [PMC free article] [PubMed] [Google Scholar]
- 58.Rohlena J, Dong L-F, Ralph SJ, Neuzil J, Antioxid. Redox Signal 15, 2951–2974 (2011). [DOI] [PubMed] [Google Scholar]
- 59.Lau AN, Vander Heiden MG, Annu. Rev. Cancer Biol 4, 17–40 (2020). [Google Scholar]
Associated Data
This section collects any data citations, data availability statements, or supplementary materials included in this article.
Supplementary Materials
Data Availability Statement
All data are available in the manuscript or the supplementary materials. To ensure sustainable access to data and materials associated with this study, the institution has committed to assuring long-term access and has designated sabadmin@wi.mit.edu as a contact. Access to reagents not found on Addgene will be facilitated by sabadmin@wi.mit.edu.