PLOS ONE logoLink to PLOS ONE
. 2022 Jan 31;17(1):e0262574. doi: 10.1371/journal.pone.0262574

Comparison of seven SNP calling pipelines for the next-generation sequencing data of chickens

Jing Liu 1, Qingmiao Shen 1, Haigang Bao 1,*
Editor: Shu-Biao Wu2
PMCID: PMC8803190  PMID: 35100292

Abstract

Single nucleotide polymorphisms (SNPs) are widely used in genome-wide association studies and population genetics analyses. Next-generation sequencing (NGS) has become convenient, and many SNP-calling pipelines have been developed for human NGS data. We took advantage of a gap knowledge in selecting the appropriated SNP calling pipeline to handle with high-throughput NGS data. To fill this gap, we studied and compared seven SNP calling pipelines, which include 16GT, genome analysis toolkit (GATK), Bcftools-single (Bcftools single sample mode), Bcftools-multiple (Bcftools multiple sample mode), VarScan2-single (VarScan2 single sample mode), VarScan2-multiple (VarScan2 multiple sample mode) and Freebayes pipelines, using 96 NGS data with the different depth gradients of approximately 5X, 10X, 20X, 30X, 40X, and 50X coverage from 16 Rhode Island Red chickens. The sixteen chickens were also genotyped with a 50K SNP array, and the sensitivity and specificity of each pipeline were assessed by comparison to the results of SNP arrays. For each pipeline, except Freebayes, the number of detected SNPs increased as the input read depth increased. In comparison with other pipelines, 16GT, followed by Bcftools-multiple, obtained the most SNPs when the input coverage exceeded 10X, and Bcftools-multiple obtained the most when the input was 5X and 10X. The sensitivity and specificity of each pipeline increased with increasing input. Bcftools-multiple had the highest sensitivity numerically when the input ranged from 5X to 30X, and 16GT showed the highest sensitivity when the input was 40X and 50X. Bcftools-multiple also had the highest specificity, followed by GATK, at almost all input levels. For most calling pipelines, there were no obvious changes in SNP numbers, sensitivities or specificities beyond 20X. In conclusion, (1) if only SNPs were detected, the sequencing depth did not need to exceed 20X; (2) the Bcftools-multiple may be the best choice for detecting SNPs from chicken NGS data, but for a single sample or sequencing depth greater than 20X, 16GT was recommended. Our findings provide a reference for researchers to select suitable pipelines to obtain SNPs from the NGS data of chickens or nonhuman animals.

Introduction

In the last decade, next-generation sequencing (NGS) has been extensively used in human, livestock and plant research [15]. An increasing number of single nucleotide polymorphisms (SNPs) have been detected in NGS datasets using various calling pipelines [68]. SNPs might occur at nonspecific positions in the genome and have been widely used in genome-wide association studies and population genetics analyses [9]. Many SNPs related to complex diseases or traits in humans or animals have been discovered by whole-genome sequencing and whole-exome sequencing [10]. Some SNPs have been shown to be causal mutations of some traits or diseases [11,12].

Many variant calling pipelines have been developed to detect SNPs from NGS data; however, each pipeline has its own advantages and disadvantages [13]. The genome analysis toolkit (GATK, https://software.broadinstitute.org/gatk/) [14] and Bcftools (https://samtools.github.io/bcftools/bcftools.html) [15] may be the most widely used SNP calling pipelines to date. A brief characteristic summary of several calling tools is listed in Table 1 and described as follows. GATK was originally used to analyze human genome and exome sequencing data, and now it may be regarded as the industry standard for identifying SNPs in germline DNA and RNA NGS data [14]. The toolkit contains a wide variety of tools with a primary focus on variant discovery and genotyping. Bcftools is a high-speed program for calling variants. It can manipulate variant calls in compressed/uncompressed VCF and BCF files [15]. VarScan2 (http://varscan.sourceforge.net/using-varscan.html) is the first tool used for the detection of somatic mutations and copy number alterations in exome data from tumor-normal pairs [16]. The VarScan2 algorithm reads the SAMtools pileup or mpileup output of tumor and normal samples simultaneously, performs pairwise comparisons of base calls, and normalizes sequencing depths at each position [17]. Freebayes (https://github.com/ekg/freebayes) is a Bayesian genetic variant caller designed to find SNPs, indels, multinucleotide polymorphisms, and complex events (composite insertion and substitution events) smaller than the length of a short-read sequencing alignment [18]. Freebayes uses short-read alignments for any number of individuals from a population and uses a reference genome to determine the most likely combination of genotypes at each position in the population [18]. 16GT (https://github.com/aquaskyline/16GT) is the first publicly available caller that uses a 16-genotype probabilistic model to unify SNPs and indel calling in a single algorithm [19]. Compared with the traditional 10-genotype probabilistic model, 16GT added 6 new genotypes. Compared to GATK with HaplotypeCaller, 16GT not only runs 4 times faster but also improves sensitivity in calling SNPs by unifying SNPs and indel calling in a single algorithm of variant calling. Recently, Chiara et al. also provided a consensus variant calling system, CoVaCS (https://bioinformatics.cineca.it/covacs), for the analysis of human genome resequencing studies [20].

Table 1. A brief summary of different tools.

caller Bcftools 16GT Freebayes VarScan2 GATK
Code C Perl C++ Java Java
Model HMM & MAQ 16-genotype probabilistic Bayesian heuristic algorithm Bayesian
Sampling Single & multiple Single Single Single & multiple Single & multiple
Variants SNPs & indels SNPs & indels SNPs & indels&MNPs SNPs & indels SNPs & indels
Features Sorting, indexing, etc. easy to use, timesaving straightforward meet desired thresholds for read depth, base quality, variant allele frequency, and statistical significance Realignment, per base recalibration, VQSR
Reference Danecek et al., 2017 [15] Luo et al., 2017 [19] Garrison and Marth, 2012 [18] Koboldt et al., 2012 [16] Mckenna et al., 2010 [14]

Using simulation and real NGS data of humans, many studies have shown that different tools have their own advantages and disadvantages [6,8,12,21]. Different variant callers may produce different results, so ensemble methods of variant calling algorithms or analytic pipelines can improve variant accuracy [22,23]. However, a single pipeline, such as the pipelines of BWA-MEM and GATK-HaplotypeCaller, can be run similarly to the pipeline ensemble method [23]. GATK may be the most popular pipeline for detecting SNPs from human high-throughput data sets [24], and it has also been widely used in chicken NGS data in recent studies [2527]. Compared with known human variant information resources, the corresponding resources of chickens are quite few, which may affect the detection results if we use GATK to detect SNPs from chicken data. Ni et al. [7] compared variants detected with GATK (UnifiedGenotyper and hard filtering), Freebayes, and SAMtools using chicken NGS data with an average coverage of 7.6 X and found that all three pipelines, particularly GATK and SAMtools, perform well in general. In the present study, we used NGS data from 16 Rhode Island Red chickens to evaluate seven SNP calling pipelines, including 16GT, GATK, Bcftools-single (Bcftools single sample mode), Bcftools-multiple (Bcftools multiple sample mode), VarScan2-single (VarScan2 single sample mode), VarScan2-multiple (VarScan2 multiple sample mode), and Freebayes, in terms of the number of detected SNPs, sensitivity, and specificity. We aim to select a high-performance SNP calling pipeline for chicken NGS data studies.

Materials and methods

Ethics statement

All experimental procedures and animals used were approved by the Ethics Review Committee for Laboratory Animal Welfare and Animal Experiment of China Agricultural University (Approval number: AW70101202-1-1).

Animals and DNA samples

The animal experimental process complied with the regulations and guidelines of the Experimental Animal Welfare and Animal Experiment Ethics Review Committee of China Agricultural University. A total of 16 chickens at 18 weeks of age randomly selected from the Rhode Island Red population, and blood samples were collected from each chicken’s wing vein using 2 mL injectors. After blood was collected, we put the 16 chickens back to the population and keep them with other individuals reared in the Experimental Chicken Farm of China Agricultural University. Our subsequent research did not work with animals. Genomic DNA of blood was extracted using the TIANamp Genomic DNA Kit (Cat. #DP304-02, TIANGEN) according to the protocol supplied. After checking and qualification, each DNA sample was divided into two parts, one part for next-generation sequencing (paired-end sequencing, 150 bp, 50X, Illumina HiSeq 4000, Beijing Novogene Bioinformatics Technology Co., Ltd) and the other for SNP array analyses (50K, KPS CAULayer Breeding Chip v1, Beijing Compass Biotechnology Co., Ltd, S1 Table).

NGS data sets and SNP calling pipelines

Cleaned reads were obtained by Trimmomatic (version 0.39; S1 Word) from raw sequencing data. After quality control, the cleaned data of each of the 16 samples were split into 10 parts evenly and reorganized to form 6 subsets of various sequencing depth gradients of approximately 5X, 10X, 20X, 30X, 40X, and 50X coverage according to Bentley et al. [28]. Thus, we finally had 16 samples × 6 gradients = 96 data points. Bowtie 2 [29] was chosen as the common aligner with the chicken genome reference (Gallus_gallus-5.0) for all SNP calling pipelines in the present study. We conducted alignment with Bowtie 2, converted the SAM files to BAM files, and then processed the same BAM files with seven SNP calling pipelines, including 16GT, GATK, Bcftools-single, Bcftools-multiple, VarScan2-single, VarScan2-multiple and Freebayes. All results of this study depended on programs’ defaults in each pipeline. Details of processing with all these pipelines are described in S1 Word.

Analysis of the sensitivity and specificity of SNP-calling pipelines

We compared the SNP array genotypes with the genotypes of SNP loci in the array detected by sequencing pipelines. In order to assess the sensitivity, and specificity of the pipelines with input read depth gradients of 5X-50X coverage, SNP loci in the array that were also detected from sequencing data for each individual were divided into 4 categories (Table 2) referring to Liu et al. [6] as follows: (1) sequencing SNPs with matched array genotypes (the true genotype with true positive SNPs (TP)); (2) false genotypes from sequencing data at the matched positive array sites (the false genotype with true positive SNPs (GE)); (3) false genotypes from sequencing data with negative array genotypes (the false genotype with false positive SNPs (FP)); and (4) the missing genotypes from sequencing data at the positive array sites (MG). Four metrics, including the SNP number, sensitivity, specificity and transition/transversion ratio (Ti/Tv), were used to assess the performance of each SNP calling pipeline. The SNP number indicates the number of detected SNPs in each sample at any input read depth. The sensitivity of each pipeline was calculated as (TP + GE)/(TP + GE + MG), and the specificity was calculated as TP/(TP + FP + GE). The Ti/Tv ratios were calculated using VCFtools (Version 0.1.17) [30].

Table 2. Descriptions of genotype categories.

Genotype categories Genotype from SNP array
00 01 11
Genotype from sequencing data 01 FP TP, MG GE
11 FP GE TP, MG

*Notes: TP means sequencing SNPs with matched array genotypes (The true genotype with true positive SNPs); GE means false genotypes from sequencing data at the matched positive array sites (The false genotype with true positive SNPs); FP means false genotypes from sequencing data with negative array genotypes (the false genotype with false positive SNPs) and MG means the missing genotypes from sequencing data at the positive array sites.

Statistical analysis

Means and standard errors were calculated for the SNP number, sensitivity and specificity of each pipeline at each input level. Mean differences were tested by the Duncan test of SPSS 19.0 (SPSS Inc., Chicago, IL), and the statistical significance level was set at P < 0.05.

Results

The NGS data sets and alignment

Approximately 3.5 billion paired-end cleaned data reads were obtained with an average coverage of approximately 50X for each sequenced Rhode Island Red chicken (S2 Table). The cleaned data set of each sample was split into 10 parts evenly and reorganized, and we obtained a total of 96 data sets. Each sample had 6 data sets with different coverages of approximately 5X, 10X, 20X, 30X, 40X and 50X (S3 Table). Paired-end cleaned reads were aligned against the chicken reference genome (Gallus_gallus-5.0) using Bowtie 2 (version 2.2.9). A summary of cleaned data alignments is displayed in S3 Table. The alignment rate of the cleaned data of each sample was between 90.91% and 95.21% (S3 Table).

Comparisons of the numbers of SNPs detected by different SNP calling pipelines

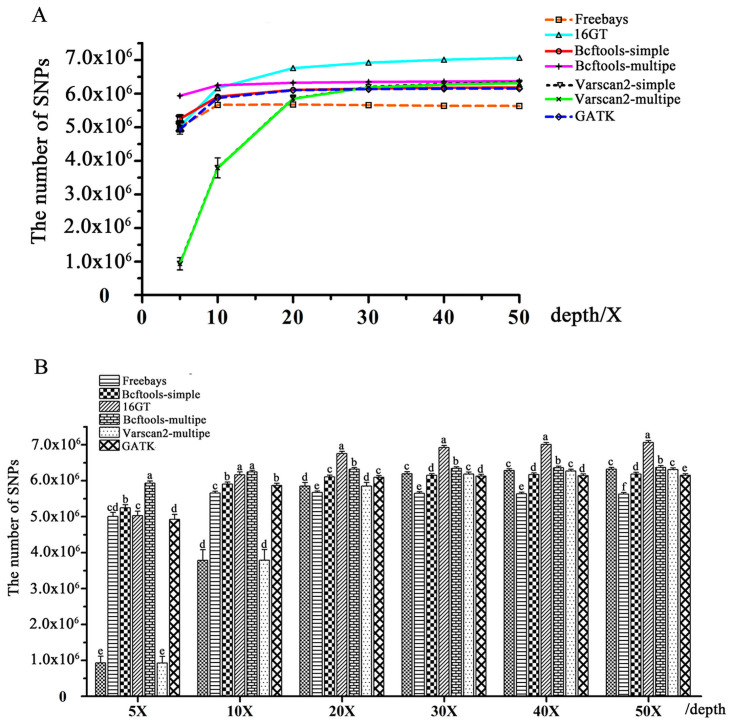
The numbers of SNPs detected with different input read depths are shown in Fig 1 and S4 Table. From Fig 1B, we could see that an increasing number of SNPs were detected with increasing input read depths by each variant caller except Freebayes. When the sequencing depth was less than 20X, the number of SNPs found by any caller increased rapidly with increasing sequencing depth, while when the sequencing depth was greater than 20X, the speed of increase slowed down obviously, and Freebayes even reached the maximum at 20X (Fig 1B). In comparison with other callers, 16GT obtained the most abundant SNPs at almost all input read depths (except 5X) in the present study; VarScan2-single and VarScan2-multiple obtained the same SNP numbers at all input read depths, and both called out the fewest SNPs at low sequencing depths (< 20X), while Freebayes called the fewest SNPs at high sequencing depths (> = 20X), and GATK and Bcftools-single performed moderately (Fig 1A). From Fig 1A, we could also see that Bcftools-multiple obtained the most abundant SNPs at 5X and 10X input levels, and at high input depths (> = 20X), Bcftools-multiple also obtained higher SNP numbers in comparison with any other pipeline except 16GT.

Fig 1. Comparisons of the total number of SNPs called out by seven different SNP calling pipelines.

Fig 1

A: Comparisons of the number of SNPs called out by different calling pipelines at each input read depth level. For each input level, the same letters indicate that the difference is not significant (P > 0.05), and the different letters indicate significant differences (P < = 0.05). B: The tendency of the number of SNPs called out by each pipeline with increasing input level.

Comparisons of the sensitivity and specificity among the seven SNP calling pipelines

To assess the sensitivity, and specificity of each pipeline with different input read depths, a 50K chicken SNP array (KPS CAULayer Breeding Chip v1, Beijing Compass Biotechnology Co., Ltd, Beijing, China) with a total of 43,681 SNP sites (S1 Table) was used to genotype individuals. We compared the SNP array genotypes with the genotypes of SNP loci in the array detected by sequencing pipelines, and the array results were regarded as a standard to evaluate the specificity and sensitivity of each calling pipeline. The array results showed an average call rate of 99.20% (S5 Table).

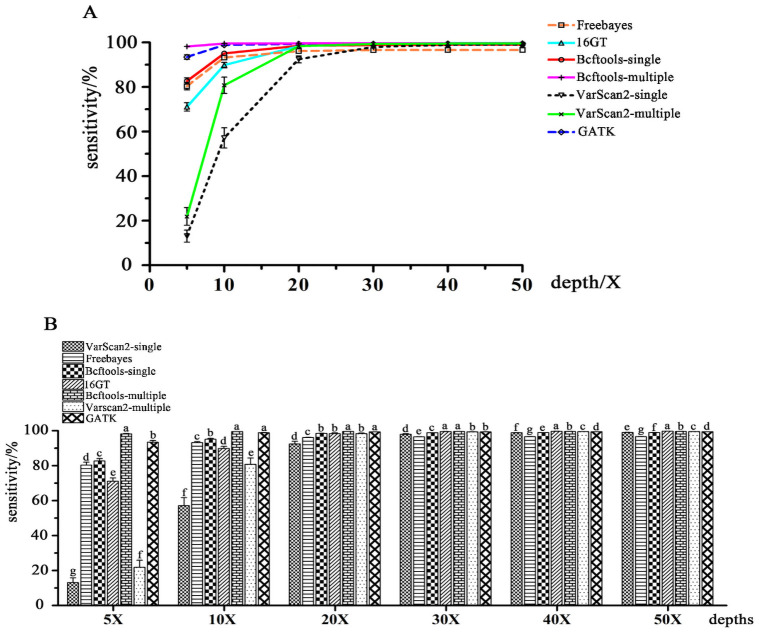
The sensitivity of each pipeline is displayed in Figs 2 and 4 and S6 Table. As shown in Fig 2, the sensitivity of various pipelines tended to rapidly increase at lower input read depths and then slightly increase at higher input read depths with increasing sequencing depth. In comparison with any other pipeline in the present study, 16GT had higher sensitivity when input read depths were equal to or greater than 20X, and Freebayes showed its sensitivity moderately at lower sequencing depths (< = 20X) but the lowest from 30X to 50X. The two VarScan2 pipelines displayed the lowest sensitivity but increased rapidly at the low input read depths and then tended to stabilize. In Fig 2, Bcftools-multiple showed the best sensitivity from 5X to 30X input depths and was then exceeded by 16GT. GATK and Bcftools-multiple both showed the best sensitivity at 10X and 20X input depths, as shown in Fig 2B.

Fig 2. The sensitivities of seven SNP calling pipelines.

Fig 2

A: The sensitivity tendencies of each SNP calling pipeline with the input level increasing; B: Comparisons of the sensitivities of different calling pipelines at each input read depth level. For each input level, the same letters indicate that the difference is not significant (P > 0.05), and different letters indicate significant differences (P < = 0.05).

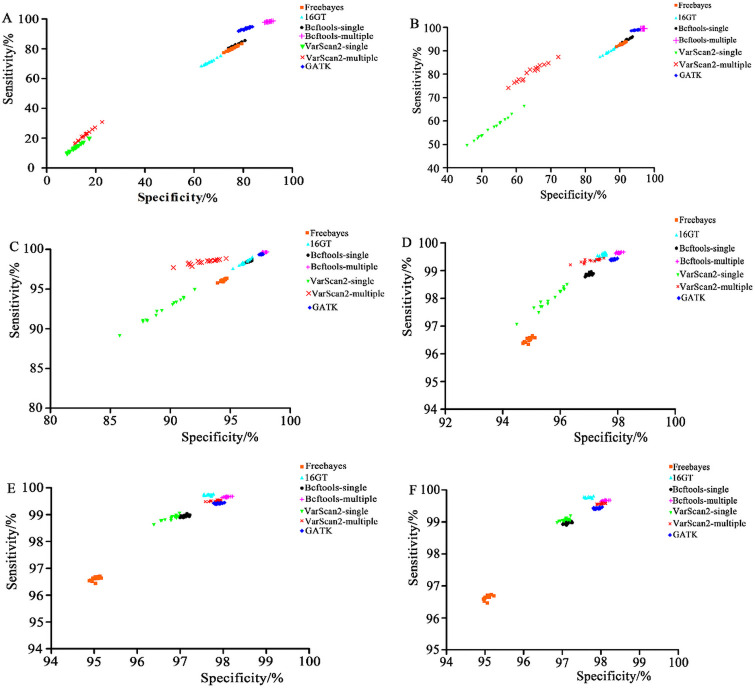
Fig 4. Two-dimensional scatter plots with specificities and sensitivities of each pipeline at different input read depths.

Fig 4

A, The input read depth is 5X; B, 10X; C, 20X; D, 30X; E, 40X; and F, 50X.

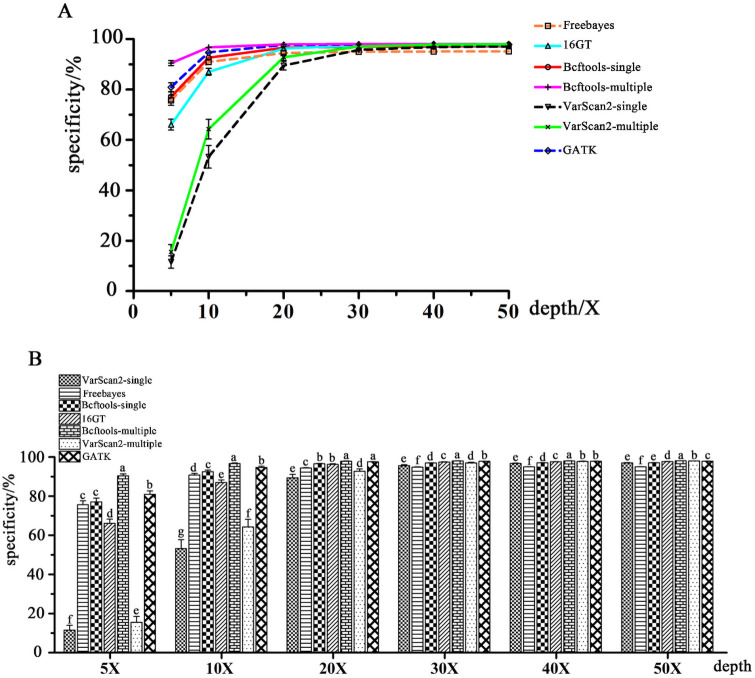
The differences in specificity among the seven pipelines were similar to the differences in sensitivity among them. Fig 3 and S7 Table show the specificities of the seven SNP calling pipelines at different input depths for SNP calling. From Fig 3, we observed that the specificity of each pipeline increased as the input read depth increased. In comparison with any other calling pipeline in the present study, Bcftools-multiple had higher specificity with any input read depth in the present study (Fig 3B). 16GT showed moderate specificity at any read depth. Compared with other pipelines, the two VarScan2 pipelines displayed the lowest specificity, but it increased rapidly at the low input read depths (< = 20X), while Freebayes showed the lowest specificity at the high input read depths (> = 30X). GATK had better specificity than any other pipeline at 5X to 40X input read depths except Bcftools-multiple in the present study.

Fig 3. The specificities of seven SNP calling pipelines.

Fig 3

A: The specificity tendencies of each SNP calling pipeline with the input level increasing; B: Comparisons of the specificities of different calling pipelines at each input read depth level. The same letter indicates that the difference is not significant (P > 0.05), and different letters indicate significant differences (P < = 0.05).

Two-dimensional scatter plots with the specificities and sensitivities of seven SNP calling pipelines in different input read depths are displayed in Fig 4. From Fig 4, we can see that Bcftools-multiple may be the best pipeline in most cases considering both sensitivity and specificity.

Effects of single and multiple modes on the sensitivity and specificity of Bcftools and VarScan2 Pipelines

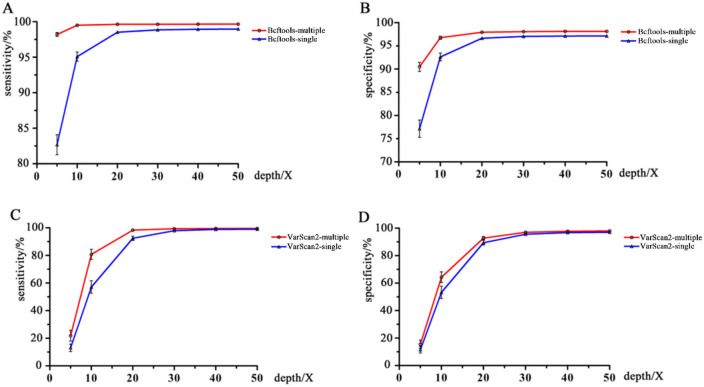
Bcftools and VarScan2 can process files one by one (Bcftools-single and VarScan2-single pipelines) or multiple files once a time (Bcftools-multiple and VarScan2-multiple pipelines). From Fig 5, we could see that the sensitivity and specificity of calling procedures increased with increasing input read depth whether in a one-by-one way or multiple files a time. Bcftools-multiple and VarScan2-multiple had higher sensitivity and specificity than Bcftools-single and VarScan2-single, respectively (Fig 5; S6 and S7 Tables). Especially at low input read depths, Bcftools-multiple considerably improved the specificity and sensitivity of the detection in comparison with Bcftools-single. For example, under the condition of a 5X input read depth, the specificity increased from 0.771 to 0.905, and the sensitivity increased from 0.827 to 0.982. VarScan2-multiple also improved the performance but not Bcftools-multiple (Fig 5).

Fig 5. Comparisons of the sensitivity and specificity of Bcftools and VarScan2 with different sample modes.

Fig 5

A: Comparisons of the sensitivity between Bcftools-single and Bcftools-multiple; B: Comparisons of the specificity between Bcftools-single and Bcftools-multiple; C: Comparisons of the sensitivity between VarScan2-single and VarScan2-multiple; and D: Comparisons of the specificity between VarScan2-single and VarScan2-multiple.

Comparisons of the Ti/Tv ratios of each predictor with different input read depths

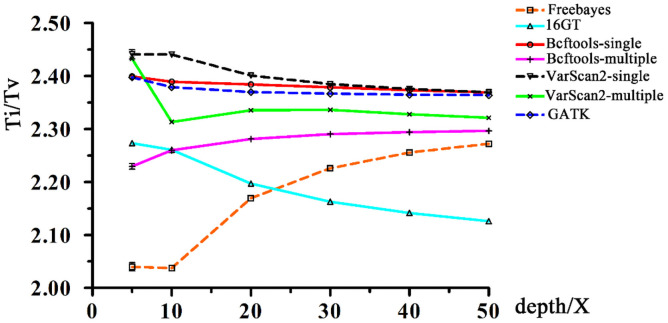
The Ti/Tv ratios of each predictor with different input read depths are shown in Fig 6 and S8 Table. From Fig 6, we can see that all Ti/Tv values are between 2.04 and 2.44. No significant (P < = 0.05) differences in the ratios were observed among the pipelines with the same input read depths, and among different coverages using the same pipelines in this study. The absolute value of the deviation between the Ti/Tv ratios of the maximum and minimum values in each pipeline did not exceed 0.2, and the absolute deviations of the Ti/Tv ratios of the maximum and minimum values of different pipelines with the same input read depths were less than 0.4 (Fig 6 and S8 Table).

Fig 6. The transition/transversion ratios of each predictor with different input read depths.

Fig 6

Discussion

SNPs are widely used in functional gene mapping and population genetics [9,31,32]. As the cost of high-throughput sequencing declined, detecting SNPs from NGS data became increasingly common. Generally, NGS data are initially aligned to a reference genome and then subjected to variant calling. Bowtie 2 was chosen to map short reads in the present study since it has a high speed, sensitivity, and accuracy and was particularly good at aligning reads to relatively large genomes (http://bowtie-bio.sourceforge.net/bowtie2/index.shtml) [29]. Many previous studies have reported the capabilities of several available SNP calling pipelines from NGS data, which were often applied to human data or simulated data [3336]. GATK is often regarded as the most effective procedure to detect variants from NGS data using resources of known variations, truth sets and other metadata (https://software.broadinstitute.org/gatk/best-practices/about). However, we have fewer known variation resources in poultry than in humans or mice, which may lead to the reduced accuracy of GATK. Ni et al. [7] thought that GATK, SAMtools and Freebayes were all good for processing high-throughput chicken data, but we found that the research in the article used low sequencing depth data, tested relatively few pipelines, and lacked detailed implementation procedures. Thereby, further research was needed. In the present study, we compared the seven SNP calling procedures using 96 NGS datasets with different input read depths of 5X-50X coverage of Rhode Island Red chickens. Luo et al. [19] found that 16GT not only ran fast but also showed the highest sensitivity and specificity in calling SNPs among all tools (GATK UnifedGenotyper, GATK HaplotypeCaller, Freebayes, Fermikit, ISAAC, and VarScan2). In our study, we also found that 16GT was more sensitive than any other pipeline at input read depths ranging from 30X to 50X (Figs 2 and 4), but the specificity of 16GT was moderate (Figs 3 and 4). Freebayes was easy to operate and could be run in one step [18]. However, Freebayes may not be a good pipeline to call SNPs from the short read data sets of the 16 Rhode Island Red chickens due to its unremarkable performances in SNP calling (Figs 14). GATK is a popular toolkit and is widely used in many studies [6,3741]. In our study, the GATK performance was not bad, but at whatever input depth, Bcftools-multiple, and sometimes 16GT, always showed better detection performances than GATK (Figs 14). Therefore, we did not recommend GATK for detecting SNPs from chicken NGS data.

A large number of SNPs were detected out by next-generation sequencing, however, we could not evaluate the accuracy of all SNP loci. In order to evaluate the sensitivity and specificity of each SNP calling pipeline, we compared the SNP array genotypes with the genotypes of SNP loci in the array detected by sequencing pipelines with different input read depths, and regarded the array genotyping as the reference data set which were distributed evenly throughout the whole chicken genome. In the present study, 16 chickens were genotyped with the 50K SNP array, and the result was regarded as a standard to evaluate the specificity and sensitivity of each SNP calling pipeline. Since the reference data only consisted of a subset of all SNPs in the genome, the estimated specificity and sensitivity here might differ from the actual values.

The Ti/Tv ratio is also an index used to evaluate the accuracy of SNP calling [40]. A high Ti/Tv ratio (> 2.0) often indicates a high-accuracy SNP set, whereas a low value (~ 0.5) implies low-quality SNP calling [42]. In our study, although each pipeline has a higher or lower value of the Ti/Tv ratio in each different input read depth, all the Ti/Tv ratios fall in the range of 2.04–2.44 (Fig 6, S8 Table), which can be considered as high accurate [42]. Moreover, the Ti/Tv ratio of each pipeline except 16GT approach slowly to around 2.3 with the increase of input read depth (Fig 6, S8 Table), and we speculate that the Ti/Tv = 2.3 could be a genome-wide approximation of chicken in this study.

Conclusions

In conclusion, (1) if only SNPs were detected, the sequencing depth did not need to exceed 20X since there were no obvious changes in the number of SNPs, sensitivity or specificity beyond 20X. (2) Bcftools-multiple may be the best choice to detect SNPs from chicken NGS data, but for a single sample or a sequencing depth greater than 20X, 16GT was also recommended. Our findings provide a reference for researchers to select suitable pipelines to obtain SNPs from the NGS data of chicken or nonhuman animals.

Supporting information

S1 Table. The genotyped results of the Illumina 50 K SNP Beadchip.

(XLS)

S2 Table. The sequencing results of 16 Rhode Island Red chickens.

(XLSX)

S3 Table. The coverage and alignment rate of each sample.

(XLSX)

S4 Table. The total number of SNPs called out by each pipeline in different input depths.

(XLSX)

S5 Table. The call rate results of array.

(XLSX)

S6 Table. The sensitivity of each pipeline in different input depths.

(XLSX)

S7 Table. The specificity of each pipeline in different input depths.

(XLSX)

S8 Table. The Ti/Tv ratios of 7 pipelines.

(XLSX)

S1 Word. SNP calling pipelines for chicken NGS sets.

(DOCX)

Acknowledgments

We wish to thank Wenpeng Han for his help in the experimental methods and polishing of this manuscript during our study.

Abbreviations

Bcftools-multiple

Bcftools multiple sample mode

Bcftools-single

Bcftools single sample mode

FP

the false genotype with false positive SNPs

GATK

genome analysis toolkit

GE

the false genotype with true positive SNPs

MG

the missing genotypes from sequencing data at the positive array sites

NGS

next-generation sequencing

SNP

single nucleotide polymorphisms

Ti/Tv

transition/transversion ratio

TP

the true genotype with true positive SNPs

VarScan2-multiple

VarScan2 multiple sample mode

VarScan2-single

VarScan2 single sample mode

Data Availability

The DNA sequencing and genotyping data for this study can be downloaded from the China National GeneBank (Accession numbers: CNP0001419 and CNP0001435).

Funding Statement

This study was supported by the Modern Agricultural Industry Technology System of China [grant number CARS-40]. The funder did not play any role in the design of the study, collection, analysis, interpretation of data or writing the manuscript.

References

  • 1.Wang BB, Zhang YB, Zhang F, Lin HB, Wang XM, Wan N, et al. On the origin of Tibetans and their genetic basis in adapting high-altitude environments. PloS One. 2011; 6 (2): e17002. doi: 10.1371/journal.pone.0017002 [DOI] [PMC free article] [PubMed] [Google Scholar]
  • 2.Gholami M, Erbe M, Gärke C, Preisinger R, Weigend A, Weigend S, et al. Population genomic analyses based on 1 million SNPs in commercial egg layers. PloS One. 2014; 9 (4): e94509. doi: 10.1371/journal.pone.0094509 [DOI] [PMC free article] [PubMed] [Google Scholar]
  • 3.Liu L, Wang MN, Feng JY, See DR, Chao SM, Chen XM. Combination of all-stage and high-temperature adult-plant resistance QTL confers high-level, durable resistance to stripe rust in winter wheat cultivar Madsen. Theor Appl Genet. 2018; 131 (9): 1835–1849. doi: 10.1007/s00122-018-3116-4 [DOI] [PubMed] [Google Scholar]
  • 4.Rochus CM, Tortereau F, Plisson-Petit F, Restoux G, Moreno-Romieux C, Tosser-Klopp G, et al. Revealing the selection history of adaptive loci using genome-wide scans for selection: an example from domestic sheep. BMC Genomics, 2018; 19 (1): 71. doi: 10.1186/s12864-018-4447-x [DOI] [PMC free article] [PubMed] [Google Scholar]
  • 5.Zhang MJ, Ren WZ, Sun XJ, Liu Y, Liu KW, Ji ZH, et al. GeneChip analysis of resistant Mycobacterium tuberculosis with previously treated tuberculosis in Changchun. BMC Infect Dis. 2018; 18 (1): 234. doi: 10.1186/s12879-018-3131-8 [DOI] [PMC free article] [PubMed] [Google Scholar]
  • 6.Liu XT, Han SZ, Wang ZH, Gelernter J, Yang B.Z. Variant callers for next-generation sequencing data: a comparison study. PloS One. 2013; 8 (9): e75619. doi: 10.1371/journal.pone.0075619 [DOI] [PMC free article] [PubMed] [Google Scholar]
  • 7.Ni GY, Strom TM, Pausch H, Reimer C, Preisinger R, Simianer H, et al. Comparison among three variant callers and assessment of the accuracy of imputation from SNP array data to whole-genome sequence level in chicken. BMC Genomics. 2015; 16 (1): 824. doi: 10.1186/s12864-015-2059-2 [DOI] [PMC free article] [PubMed] [Google Scholar]
  • 8.Sandmann S, De Graaf AO, Karimi M, van der Reijden BA, Hellström-Lindberg E, Jansen JH, et al. Evaluating variant calling tools for non-matched next-generation sequencing data. Sci Rep. 2017; 7: 43169. doi: 10.1038/srep43169 [DOI] [PMC free article] [PubMed] [Google Scholar]
  • 9.Helyar SJ, Hemmer-Hansen J, Bekkevold D, Taylor MI, Ogden R, Limborg MT, et al. Application of SNPs for population genetics of nonmodel organisms: new opportunities and challenges. Mol Ecol Resour. 2011; 11 Suppl 1: 123–36. doi: 10.1111/j.1755-0998.2010.02943.x [DOI] [PubMed] [Google Scholar]
  • 10.Gonzaga-Jauregui C, Lupski JR, Gibbs RA. Human genome sequencing in health and disease. Annu Rev Med. 2012; 63: 35–61. doi: 10.1146/annurev-med-051010-162644 [DOI] [PMC free article] [PubMed] [Google Scholar]
  • 11.Guo YF, Ding XL, Shen YF, Lyon GJ, Wang K. SeqMule: automated pipeline for analysis of human exome/genome sequencing data. Sci Rep. 2015; 5: 14283. doi: 10.1038/srep14283 [DOI] [PMC free article] [PubMed] [Google Scholar]
  • 12.Hwang S, Kim E, Lee I, Marcotte EM. Systematic comparison of variant calling pipelines using gold standard personal exome variants. Sci Rep. 2015; 5: 17875. doi: 10.1038/srep17875 [DOI] [PMC free article] [PubMed] [Google Scholar]
  • 13.Pabinger S, Dander A, Fischer M, Snajder R, Sperk M, Efremova M, et al. A survey of tools for variant analysis of next-generation genome sequencing data. Brief Bioinform. 2014; 15 (2): 256–78. doi: 10.1093/bib/bbs086 [DOI] [PMC free article] [PubMed] [Google Scholar]
  • 14.McKenna A, Hanna M, Banks E, Sivachenko A, Cibulskis K, Kernytsky A, et al. The Genome Analysis Toolkit: a MapReduce framework for analyzing next-generation DNA sequencing data. Genome Res. 2010; 20 (9): 1297–303. doi: 10.1101/gr.107524.110 [DOI] [PMC free article] [PubMed] [Google Scholar]
  • 15.Danecek P, McCarthy SA. BCFtools/csq: haplotype-aware variant consequences. Bioinformatics. 2017; 33 (13): 2037–9. doi: 10.1093/bioinformatics/btx100 [DOI] [PMC free article] [PubMed] [Google Scholar]
  • 16.Koboldt DC, Zhang QY, Larson DE, Shen D, McLellan MD, Lin L, et al. VarScan 2: somatic mutation and copy number alteration discovery in cancer by exome sequencing. Genome Res. 2012; 22 (3): 568–76. doi: 10.1101/gr.129684.111 [DOI] [PMC free article] [PubMed] [Google Scholar]
  • 17.Koboldt DC, Larson DE, Wilson RK. Using VarScan 2 for germline variant calling and somatic mutation detection. Curr Protoc Bioinformatics. 2013; 44: 15.4.1–17. doi: 10.1002/0471250953.bi1504s44 [DOI] [PMC free article] [PubMed] [Google Scholar]
  • 18.Garrison E, Marth G. Haplotype-based variant detection from short-read sequencing. arXiv:1207.3907V2. 2012; arxiv.org/abs/1207.3907.
  • 19.Luo RB, Schatz MC, Salzberg SL. 16GT: a fast and sensitive variant caller using a 16-genotype probabilistic model. Gigascience. 2017; 6 (7):1–4. doi: 10.1093/gigascience/gix045 [DOI] [PMC free article] [PubMed] [Google Scholar]
  • 20.Chiara M, Gioiosa S, Chillemi G, D’Antonio M, Flati T, Picardi E, et al. CoVaCS: a consensus variant calling system. BMC Genomics. 2018; 19 (1):120. doi: 10.1186/s12864-018-4508-1 [DOI] [PMC free article] [PubMed] [Google Scholar]
  • 21.Escalona M, Rocha S, Posada D. A comparison of tools for the simulation of genomic next-generation sequencing data. Nat Rev Genet. 2016; 17 (8): 459–69. doi: 10.1038/nrg.2016.57 [DOI] [PMC free article] [PubMed] [Google Scholar]
  • 22.Gézsi A, Bolgár B, Marx P, Sarkozy P, Szalai C, Antal P. VariantMetaCaller: automated fusion of variant calling pipelines for quantitative, precision-based filtering. BMC Genomics. 2015; 16: 875. doi: 10.1186/s12864-015-2050-y [DOI] [PMC free article] [PubMed] [Google Scholar]
  • 23.Hwang KB, Lee IH, Li H, Won DG, Hernandez-Ferrer C, Negron JA, et al. Comparative analysis of whole-genome sequencing pipelines to minimize false negative findings. Sci Rep. 2019; 9 (1): 3219. doi: 10.1038/s41598-019-39108-2 [DOI] [PMC free article] [PubMed] [Google Scholar]
  • 24.do Valle ÍF, Giampieri E, Simonetti G, Padella A, Manfrini M, Ferrari A, et al. Optimized pipeline of MuTect and GATK tools to im-prove the detection of somatic single nucleotide polymorphisms in whole-exome sequencing data. BMC Bioinformatics. 2016; 17 Suppl 12: 341. doi: 10.1186/s12859-016-1190-7 [DOI] [PMC free article] [PubMed] [Google Scholar]
  • 25.Lawal RA, Al-Atiyat RM, Aljumaah RS, Silva P, Mwacharo JM, Hanotte O. Whole-genome resequencing of red junglefowl and indigenous village chicken reveal new insights on the genome dynamics of the species. Front Genet. 2018; 9: 264. doi: 10.3389/fgene.2018.00264 [DOI] [PMC free article] [PubMed] [Google Scholar]
  • 26.Bassano I, Ong SH, Sanz-Hernandez M, Vinkler M, Kebede A, Hanotte O, et al. Comparative analysis of the chicken IFITM locus by targeted genome sequencing reveals evolution of the locus and positive selection in IFITM1 and IFITM3. BMC Genomics. 2019; 20 (1): 272. doi: 10.1186/s12864-019-5621-5 [DOI] [PMC free article] [PubMed] [Google Scholar]
  • 27.Qanbari S, Rubin CJ, Maqbool K, Weigend S, Weigend A, Geibel J, et al. Genetics of adaptation in modern chicken. PLoS Genet. 2019; 15 (4): e1007989. doi: 10.1371/journal.pgen.1007989 [DOI] [PMC free article] [PubMed] [Google Scholar]
  • 28.Bentley DR, Balasubramanian S, Swerdlow HP, Smith GP, Milton J, Brown CG, et al. Accurate whole human genome sequencing using reversible terminator chemistry. Nature. 2008; 456 (7218): 53–9. doi: 10.1038/nature07517 [DOI] [PMC free article] [PubMed] [Google Scholar]
  • 29.Langmead B, Salzberg SL. Fast gapped-read alignment with Bowtie 2. Nat methods. 2012; 9 (4): 357–9. doi: 10.1038/nmeth.1923 [DOI] [PMC free article] [PubMed] [Google Scholar]
  • 30.Danecek P, Auton A, Abecasis G, Albers CA, Banks Eric, DePristo MA, et al. 1000 Genomes Project Analysis Group. The variant call format and VCFtools. Bioinformatics. 2011; 27(15): 2156–8. doi: 10.1093/bioinformatics/btr330 [DOI] [PMC free article] [PubMed] [Google Scholar]
  • 31.Saint-Pé K, Leitwein M, Tissot L, Poulet N, Guinand B, Berrebi P, et al. Development of a large SNPs resource and a low-density SNP array for brown trout (Salmo trutta) population genetics. BMC Genomics. 2019; 20 (1): 582. doi: 10.1186/s12864-019-5958-9 [DOI] [PMC free article] [PubMed] [Google Scholar]
  • 32.Phillips C, Amigo J, Tillmar AO, Peck MA, de la Puente M, Ruiz-Ramírez J, et al. A compilation of tri-allelic SNPs from 1000 Genomes and use of the most polymorphic loci for a large-scale human identification panel. Forensic Sci Int Genet. 2020; 46: 102232. doi: 10.1016/j.fsigen.2020.102232 [DOI] [PubMed] [Google Scholar]
  • 33.Cantacessi C, Jex AR, Hall RS, Young ND, Campbell BE, Joachim A, et al. A practical, bioinformatic workflow system for large data sets generated by next-generation sequencing. Nucleic Acids Res. 2010; 38 (17): e171. doi: 10.1093/nar/gkq667 [DOI] [PMC free article] [PubMed] [Google Scholar]
  • 34.Fang H, Wu Y, Narzisi G, O’Rawe JA, Barrón LTJ, Rosenbaum J, et al. Reducing INDEL calling errors in whole genome and exome sequencing data. Genome Med. 2014; 6 (10): 89. doi: 10.1186/s13073-014-0089-z [DOI] [PMC free article] [PubMed] [Google Scholar]
  • 35.Pirooznia M, Kramer M, Parla J, Goes FS, Potash JB, McCombie WR, et al. Validation and assessment of variant calling pipelines for next-generation sequencing. Hum Genomics. 2014; 8 (1): 14. doi: 10.1186/1479-7364-8-14 [DOI] [PMC free article] [PubMed] [Google Scholar]
  • 36.Ghoneim DH, Myers JR, Tuttle E, Paciorkowski AR. Comparison of insertion/deletion calling algorithms on human next-generation sequencing data. BMC Res Notes. 2014; 7: 864. doi: 10.1186/1756-0500-7-864 [DOI] [PMC free article] [PubMed] [Google Scholar]
  • 37.De Summa S, Malerba G, Pinto R, Mori A, Mijatovic V, Tommasi S. GATK hard filtering: tunable parameters to improve variant calling for next generation sequencing targeted gene panel data. BMC Bioinformatics. 2017; 18 Suppl 5:119. doi: 10.1186/s12859-017-1537-8 [DOI] [PMC free article] [PubMed] [Google Scholar]
  • 38.Walker MA, Pedamallu CS, Ojesina AI, Bullman S, Sharpe T, Whelan CW, et al. GATK PathSeq: A customizable computational tool for the discovery and identification of microbial sequences in libraries from eukaryotic hosts. Bioinformatics. 2018; 34 (24): 4287–9. doi: 10.1093/bioinformatics/bty501 [DOI] [PMC free article] [PubMed] [Google Scholar]
  • 39.Brouard JS, Schenkel F, Marete A, Bissonnette N. The GATK joint genotyping workflow is appropriate for calling variants in RNA-seq experiments. J Anim Sci Biotechnol. 2019; 10: 44. doi: 10.1186/s40104-019-0359-0 [DOI] [PMC free article] [PubMed] [Google Scholar]
  • 40.Schnepp PM, Chen MJ, Keller ET, Zhou X. SNV identification from single-cell RNA sequencing data. Hum Mol Genet. 2019;28 (21): 3569–83. doi: 10.1093/hmg/ddz207 [DOI] [PMC free article] [PubMed] [Google Scholar]
  • 41.Zhao Y, Wang K, Wang WL, Yin TT, Dong WQ, Xu CJ. A high-throughput SNP discovery strategy for RNA-seq data. BMC Genomics. 2019; 20 (1): 160. doi: 10.1186/s12864-019-5533-4 [DOI] [PMC free article] [PubMed] [Google Scholar]
  • 42.Liu Q, Guo Y, Li J, Long JR, Zhang B, Shyr Yu. Steps to ensure accuracy in genotype and SNP calling from Illumina sequencing data. BMC Genomics. 2012; 13 Suppl 8: S8. doi: 10.1186/1471-2164-13-S8-S8 [DOI] [PMC free article] [PubMed] [Google Scholar]

Decision Letter 0

Shu-Biao Wu

18 Jun 2021

PONE-D-21-09642

Comparison of seven SNP calling pipelines for the next-generation sequencing data of chickens

PLOS ONE

Dear Dr. Bao,

Thank you for submitting your manuscript to PLOS ONE. After careful consideration, we feel that it has merit but does not fully meet PLOS ONE’s publication criteria as it currently stands. Therefore, we invite you to submit a revised version of the manuscript that addresses the points raised during the review process.

You are required to revise according to the comments from the reviewer with major points addressed properly and minor points recommended to change if appropriate.​

Please submit your revised manuscript by Aug 02 2021 11:59PM. If you will need more time than this to complete your revisions, please reply to this message or contact the journal office at plosone@plos.org. When you're ready to submit your revision, log on to https://www.editorialmanager.com/pone/ and select the 'Submissions Needing Revision' folder to locate your manuscript file.

Please include the following items when submitting your revised manuscript:

  • A rebuttal letter that responds to each point raised by the academic editor and reviewer(s). You should upload this letter as a separate file labeled 'Response to Reviewers'.

  • A marked-up copy of your manuscript that highlights changes made to the original version. You should upload this as a separate file labeled 'Revised Manuscript with Track Changes'.

  • An unmarked version of your revised paper without tracked changes. You should upload this as a separate file labeled 'Manuscript'.

If you would like to make changes to your financial disclosure, please include your updated statement in your cover letter. Guidelines for resubmitting your figure files are available below the reviewer comments at the end of this letter.

If applicable, we recommend that you deposit your laboratory protocols in protocols.io to enhance the reproducibility of your results. Protocols.io assigns your protocol its own identifier (DOI) so that it can be cited independently in the future. For instructions see: http://journals.plos.org/plosone/s/submission-guidelines#loc-laboratory-protocols. Additionally, PLOS ONE offers an option for publishing peer-reviewed Lab Protocol articles, which describe protocols hosted on protocols.io. Read more information on sharing protocols at https://plos.org/protocols?utm_medium=editorial-email&utm_source=authorletters&utm_campaign=protocols.

We look forward to receiving your revised manuscript.

Kind regards,

Shu-Biao Wu, PhD

Academic Editor

PLOS ONE

Journal requirements:

When submitting your revision, we need you to address these additional requirements.

1. Please ensure that your manuscript meets PLOS ONE's style requirements, including those for file naming. The PLOS ONE style templates can be found at

https://journals.plos.org/plosone/s/file?id=wjVg/PLOSOne_formatting_sample_main_body.pdf and

https://journals.plos.org/plosone/s/file?id=ba62/PLOSOne_formatting_sample_title_authors_affiliations.pdf.

2. Thank you for stating the following in the manuscript:

This study was supported by the Modern Agricultural Industry Technology System of China [grant number CARS-40]. The funder did not play any role in the design of the study, collection, analysis, interpretation of data or writing the manuscript.

However, funding information should not appear in the areas of your manuscript. We will only publish funding information present in the Funding Statement section of the online submission form.

Please remove any funding-related text from the manuscript and let us know how you would like to update your Funding Statement. Currently, your Funding Statement reads as follows:

Thank you for stating the following in the manuscript:

This study was supported by the Modern Agricultural Industry Technology System of China [grant number CARS-40]. The funder did not play any role in the design of the study, collection, analysis, interpretation of data or writing the manuscript.

Please include your amended statements within your cover letter; we will change the online submission form on your behalf."

3. We note that you have included the phrase “data not shown” in your manuscript. Unfortunately, this does not meet our data sharing requirements. PLOS does not permit references to inaccessible data. We require that authors provide all relevant data within the paper, Supporting Information files, or in an acceptable, public repository. Please add a citation to support this phrase or upload the data that corresponds with these findings to a stable repository (such as Figshare or Dryad) and provide and URLs, DOIs, or accession numbers that may be used to access these data. Or, if the data are not a core part of the research being presented in your study, we ask that you remove the phrase that refers to these data.

Additional Editor Comments (if provided):

[Note: HTML markup is below. Please do not edit.]

Reviewers' comments:

Reviewer's Responses to Questions

Comments to the Author

1. Is the manuscript technically sound, and do the data support the conclusions?

The manuscript must describe a technically sound piece of scientific research with data that supports the conclusions. Experiments must have been conducted rigorously, with appropriate controls, replication, and sample sizes. The conclusions must be drawn appropriately based on the data presented.

Reviewer #1: Yes

**********

2. Has the statistical analysis been performed appropriately and rigorously?

Reviewer #1: Yes

**********

3. Have the authors made all data underlying the findings in their manuscript fully available?

The PLOS Data policy requires authors to make all data underlying the findings described in their manuscript fully available without restriction, with rare exception (please refer to the Data Availability Statement in the manuscript PDF file). The data should be provided as part of the manuscript or its supporting information, or deposited to a public repository. For example, in addition to summary statistics, the data points behind means, medians and variance measures should be available. If there are restrictions on publicly sharing data—e.g. participant privacy or use of data from a third party—those must be specified.

Reviewer #1: Yes

**********

4. Is the manuscript presented in an intelligible fashion and written in standard English?

PLOS ONE does not copyedit accepted manuscripts, so the language in submitted articles must be clear, correct, and unambiguous. Any typographical or grammatical errors should be corrected at revision, so please note any specific errors here.

Reviewer #1: Yes

**********

5. Review Comments to the Author

Please use the space provided to explain your answers to the questions above. You may also include additional comments for the author, including concerns about dual publication, research ethics, or publication ethics. (Please upload your review as an attachment if it exceeds 20,000 characters)

Reviewer #1: GENERAL COMMENTS:

As well as the rapid advance of NGS techniques for large-scale production of genomic data, many research groups also quickly advanced in the development of pipelines to deal with this type of data. Some pipelines have become gold standards, but not necessarily because they are the best, but the most used and cited. This study is very relevant to help bioinformats to apply the proper method to identify SNPs using high-throughput sequencing technologies. In addition, the article explores different scenarios faced by researchers regarding sequencing coverage, which is often limited due to the researcher's resources available. Although the study was performed using the chicken model, it can be easily extrapolated to any other species.

Overall, I really enjoyed the study in all aspects, but I was a little confused in the "Analysis of the sensitivity and specificity of SNP-calling pipelines" part of which I recommend a major review.

Major:

Line 143 – In my understanding you have settled 4 categories to the SNPs to validate it when comparing the SNP panel with your “sequencing data” right? However, it is not clear to me (in your writing) which set of your sequencing data you have used. According to your data and results I see that you have used the data from the 16 individuals separately according to the depth of coverage (as like all the other comparisons). And in addition, you have also compared according to the SNP caller tools. If so, you must add this information clearly in your methods, in your results, and also take it in consideration when discussing.

Minor:

ABSTRACT

Line 28 – please, replace ”object” to objective, or goal, or aim.

Line 27-29 - This phrase strikes me as a bit “scientifically selfish”. You are making it public to allow other scientists to use it, right? I would like to suggest something more general like this: “We took advantage of a gap knowledge in selecting the appropriated SNP calling pipeline to handle with high-throughput NGS data. To fill this gap., we studied and compared seven SNP calling pipelines, which include… and also using the different coverage deph…”

Introduction

Line 95 – replace traits to “advantages and disadvantages”, or something like this, otherwise, the sentence does not say that much.

SECTION “NGS DATA SETS AND SNP CALLING PIPELINES.

Line 133 – Please, describe better the quality control. Please, replace “clean”, to cleaned (after quality control, right?)

From lines 138 to 142 – Have you used “default” parameters for all the pipelines described here? You should better explain it on the manuscript body or describe the parameters used. In your supplementary file you say “All results of this study depended on the default parameters used in each pipeline. Any change of these parameters may alter results and conclusions.”. Looks like you have defined the “default” as the parameters you have used in your pipeline, but what about the “program’s parameters”? Have you used it? You need a very briefly sentence saying that you have used: or “all the program´s default” or modified defaults according to the supplementary file. However, if you will modify de program´s default, you should also briefly justify it.

RESULTS

172-174 – Please, clarify this sentence!

217-218 – replace “discovered” to “observed”

Figure 1: I suggest you replace A and B. So, you will have all the figures standardize with the same “artistic” style. But it is just a suggestion.

265 – Please, you need to describe it better.

Discussion

Line 279 – Here you are saying that you have used the program´s default parameters… So please, be concise with your results.

Line 280-281- I do not consider this information relevant in the way is written. I would like to suggest to you write that you chose not to change the parameters to represent a scenario commonly used by researchers, however, any change to these parameters needs to be carefully done and properly justified. Because this is the reality. The algorithm defaults are usually settled by researchers of exact sciences and must be altered when biologically they do not make sense.

Line 283 – I think the correct term here is “large” genomes, please check it.

Line 308 – Please, I think you can improve the writing here. Something like this: Moreover, GATK was more time consuming than…or the most time consuming…

In addition, I do not remember seeing any mention in your results about processing time. If you have this information, please add it to your table 1 and write a sentence about it there (more than just the features column). Otherwise, you cannot argue based on your pipeline, you need to define that this information comes from other references. Moreover, when you write about “time consuming”, you should stablish a several of other standardized criteria, like number of cores, memory used, etc and etc, for each one of the approaches you have worked with…

Line 310 – “It was not possible” sounds better.

From 310 and 311 – I did not get the point of the first and second sentence, how they connect with each other? It was not possible because polymorphic SNP loci formed good sampling data for all SNPs? Please clarify this.

Moreover, you cannot base your discussion in your opinion. How does the evidence from this study support its conclusion?

Line 310 to 317. Please, reorganize this whole paragraph.

Line 318 to 319 – Please, add the “high ratio” value same as you did to the low. In addition, use > and < if possible.

Line 320-322 – Please, you should be more straight forward and explore better this last paragraph using your results. First of all, these “validation” using the SNP panel was performed comparing with your 16 individuals unregard to the X coverage? No, I see you have compared all the possible scenarios. Please, explore it. Look:

In our study, although pipeline X has a higher or lower ratio or etc, etc., all the xxx ratios fall in the range of XXXX, which can be considered as “??””( High accurate?). Moreover, no significant (Pvalue<=???) differences in the ratios were observed among the pipelines used in this study??? And about among different coverages??

Here you really must point to the readers that although all pipelines have defined good accuracy by the literature...your study indicates that in some situations you can have a better accuracy (is that the case?). This accuracy is dependent of the coverage? the used pipeline? Please, explore it better.

**********

6. PLOS authors have the option to publish the peer review history of their article (what does this mean?). If published, this will include your full peer review and any attached files.

If you choose “no”, your identity will remain anonymous but your review may still be made public.

Do you want your identity to be public for this peer review? For information about this choice, including consent withdrawal, please see our Privacy Policy.

Reviewer #1: Yes: Fábio Pértille

[NOTE: If reviewer comments were submitted as an attachment file, they will be attached to this email and accessible via the submission site. Please log into your account, locate the manuscript record, and check for the action link "View Attachments". If this link does not appear, there are no attachment files.]

While revising your submission, please upload your figure files to the Preflight Analysis and Conversion Engine (PACE) digital diagnostic tool, https://pacev2.apexcovantage.com/. PACE helps ensure that figures meet PLOS requirements. To use PACE, you must first register as a user. Registration is free. Then, login and navigate to the UPLOAD tab, where you will find detailed instructions on how to use the tool. If you encounter any issues or have any questions when using PACE, please email PLOS at figures@plos.org. Please note that Supporting Information files do not need this step.

PLoS One. 2022 Jan 31;17(1):e0262574. doi: 10.1371/journal.pone.0262574.r002

Author response to Decision Letter 0


22 Jul 2021

Responses to reviewers’ comments

Reviewer #1: GENERAL COMMENTS:

As well as the rapid advance of NGS techniques for large-scale production of genomic data, many research groups also quickly advanced in the development of pipelines to deal with this type of data. Some pipelines have become gold standards, but not necessarily because they are the best, but the most used and cited. This study is very relevant to help bioinformats to apply the proper method to identify SNPs using high-throughput sequencing technologies. In addition, the article explores different scenarios faced by researchers regarding sequencing coverage, which is often limited due to the researcher's resources available. Although the study was performed using the chicken model, it can be easily extrapolated to any other species.

Overall, I really enjoyed the study in all aspects, but I was a little confused in the "Analysis of the sensitivity and specificity of SNP-calling pipelines" part of which I recommend a major review.

Major:

Line 143 – In my understanding you have settled 4 categories to the SNPs to validate it when comparing the SNP panel with your “sequencing data” right? However, it is not clear to me (in your writing) which set of your sequencing data you have used. According to your data and results I see that you have used the data from the 16 individuals separately according to the depth of coverage (as like all the other comparisons). And in addition, you have also compared according to the SNP caller tools. If so, you must add this information clearly in your methods, in your results, and also take it in consideration when discussing.

Response:

We add the information clearly in the methods, results, and discussion as follows:

Line 144: add “We compared the SNP array genotypes with the genotypes of SNP loci in the array detected by sequencing pipelines. In order to assess the sensitivity, and specificity of the pipelines with input read depth gradients of 5X-50X coverage,” at the beginning of the paragraph.

Line 199: add “To assess the sensitivity, and specificity of each pipeline with different input read depths,” at the beginning of the paragraph.

Line 201: replace “, and its results” with “. We compared the SNP array genotypes with the genotypes of SNP loci in the array detected by sequencing pipelines, and the array results”.

Line 295: insert “with different input read depths of 5X-50X coverage” between “datasets” and “of Rhode”.

Line 310 -313: replace “It was not possible for us to evaluate the detection accuracy of all SNP loci. The SNPs in the 50K SNP array were distributed evenly throughout the whole chicken genome. In our opinion, polymorphic SNP loci detected using the 50K SNP array formed good sampling data for all SNPs in the chicken genome.” with “A large number of SNPs were detected out by next-generation sequencing, however, we could not evaluate the accuracy of all SNP loci. In order to evaluate the sensitivity and specificity of each SNP calling pipeline, we compared the SNP array genotypes with the genotypes of SNP loci in the array detected by sequencing pipelines with different input read depths, and regarded the array genotyping as the reference data set which were distributed evenly throughout the whole chicken genome.”.

Minor:

ABSTRACT

Line 28 – please, replace ”object” to objective, or goal, or aim.

Response:

Line 28: We replace the sentence as following: Line 27 - 33.

Line 27-29 - This phrase strikes me as a bit “scientifically selfish”. You are making it public to allow other scientists to use it, right? I would like to suggest something more general like this: “We took advantage of a gap knowledge in selecting the appropriated SNP calling pipeline to handle with high-throughput NGS data. To fill this gap., we studied and compared seven SNP calling pipelines, which include… and also using the different coverage depth…”

Response:

Line 27 -33: replace the sentence “Our object was to select a high-performance SNP calling pipeline for chicken NGS data for application in our future studies. Here, we studied the performances of seven SNP calling pipelines, including the 16GT, genome analysis toolkit (GATK), Bcftools-single (Bcftools single sample mode), Bcftools-multiple (Bcftools multiple sample mode), VarScan2-single (VarScan2 single sample mode), VarScan2-multiple (VarScan2 multiple sample mode) and Freebayes pipelines, using 96 NGS data from 16 Rhode Island Red chickens.” with “We took advantage of a gap knowledge in selecting the appropriated SNP calling pipeline to handle with high-throughput NGS data. To fill this gap, we studied and compared seven SNP calling pipelines, which include 16GT, genome analysis toolkit (GATK), Bcftools-single (Bcftools single sample mode), Bcftools-multiple (Bcftools multiple sample mode), VarScan2-single (VarScan2 single sample mode), VarScan2-multiple (VarScan2 multiple sample mode) and Freebayes pipelines, using 96 NGS data with the different depth gradients of approximately 5X, 10X, 20X, 30X, 40X, and 50X coverage from 16 Rhode Island Red chickens.”.

Introduction

Line 95 – replace traits to “advantages and disadvantages”, or something like this, otherwise, the sentence does not say that much.

Response:

Line 95: replace “traits” with “advantages and disadvantages”

SECTION “NGS DATA SETS AND SNP CALLING PIPELINES.

Line 133 – Please, describe better the quality control. Please, replace “clean”, to cleaned (after quality control, right?)

Response:

Line 133: add a new sentence “Cleaned reads were obtained by Trimmomatic (version 0.39; S1 Word) from raw sequencing data.” before “After quality control”.

S1 Word: add a new paragraph at the beginning of this supplementary file as follows:

“1. Qualitative Control with Trimmomatic (version 0.39)

java -jar trimmomatic-0.39.jar PE -threads 16 Sample_1.clean.fq Sample_2.clean.fq Sample_forward_paired.fq Sample_forward_unpaired.fq Sample_reverse_paired.fq Sample_reverse_unpaired.fq ILLUMINACLIP:TruSeq3-PE-2.fa:2:30:10 LEADING:3 TRAILING:3 SLIDINGWINDOW:4:15 CROP:135 MINLEN:135” .

Line 133, Line 168 and L170: replace “clean data” with “cleaned data”.

From lines 138 to 142 – Have you used “default” parameters for all the pipelines described here? You should better explain it on the manuscript body or describe the parameters used. In your supplementary file you say “All results of this study depended on the default parameters used in each pipeline. Any change of these parameters may alter results and conclusions.”. Looks like you have defined the “default” as the parameters you have used in your pipeline, but what about the “program’s parameters”? Have you used it? You need a very briefly sentence saying that you have used: or “all the program´s default” or modified defaults according to the supplementary file. However, if you will modify de program´s default, you should also briefly justify it.

Response:

Line 141: add a new sentence “All results of this study depended on programs’ defaults in each pipeline.” before “Details of processing”.

S1 Word: delete the first two sentences “All results of this study depended on the default parameters used in each pipeline. Any change of these parameters may alter results and conclusions.”.

RESULTS

172-174 – Please, clarify this sentence!

Response:

Line 172-174: replace “Bowtie 2 mapped short reads to the chicken reference genome (Gallus_gallus-5.0), and the average mapping ratios were approximately 94% (S3 Table).” with “Paired-end cleaned reads were aligned against the chicken reference genome (Gallus_gallus-5.0) using Bowtie 2 (version 2.2.9). A summary of cleaned data alignments is displayed in S3 Table. The alignment rate of the cleaned data of each sample was between 90.91% and 95.21% (S3 Table).”.

217-218 – replace “discovered” to “observed”

Response:

Line 217 -218: replace “discovered” with “observed”

Figure 1: I suggest you replace A and B. So, you will have all the figures standardize with the same “artistic” style. But it is just a suggestion.

Response:

Figure 1: We have replaced A and B.

265 – Please, you need to describe it better.

Response:

Line 265: replace “Comparisons of the Ti/Tv of SNPs detected by different SNP calling pipelines” with “Comparisons of the Ti/Tv ratios of each predictor with different input read depths”

Discussion

Line 279 – Here you are saying that you have used the program´s default parameters… So please, be concise with your results.

Line 280-281- I do not consider this information relevant in the way is written. I would like to suggest to you write that you chose not to change the parameters to represent a scenario commonly used by researchers, however, any change to these parameters needs to be carefully done and properly justified. Because this is the reality. The algorithm defaults are usually settled by researchers of exact sciences and must be altered when biologically they do not make sense.

Response:

Line 141: add a new sentence “All results of this study depended on programs’ defaults in each pipeline.” before “Details of processing”.

Line 279-281: delete the sentence “Throughout this study, the default parameters were used in each pipeline. Any change in these parameters may lead to different results, and another pipeline might perform better under different parameter settings.”.

Line 283 – I think the correct term here is “large” genomes, please check it.

Response:

Line 283: replace “long” with “large”.

Line 308 – Please, I think you can improve the writing here. Something like this: Moreover, GATK was more time consuming than…or the most time consuming…

In addition, I do not remember seeing any mention in your results about processing time. If you have this information, please add it to your table 1 and write a sentence about it there (more than just the features column). Otherwise, you cannot argue based on your pipeline, you need to define that this information comes from other references. Moreover, when you write about “time consuming”, you should stablish a several of other standardized criteria, like number of cores, memory used, etc and etc, for each one of the approaches you have worked with…

Response:

Line 299: delete “a more time-saving pipeline (data not shown) and”.

Line 307-308: delete the sentence “Moreover, GATK often spent a long time (data not shown) performing its complicated implementation steps.”

Line 310 – “It was not possible” sounds better.

From 310 and 311 – I did not get the point of the first and second sentence, how they connect with each other? It was not possible because polymorphic SNP loci formed good sampling data for all SNPs? Please clarify this. Moreover, you cannot base your discussion in your opinion. How does the evidence from this study support its conclusion? Line 310 to 317. Please, reorganize this whole paragraph.

Response:

Line 310 -313: replace the sentences “It was not possible for us to evaluate the detection accuracy of all SNP loci. The SNPs in the 50K SNP array were distributed evenly throughout the whole chicken genome. In our opinion, polymorphic SNP loci detected using the 50K SNP array formed good sampling data for all SNPs in the chicken genome.” with “A large number of SNPs were detected out by next-generation sequencing, however, we could not evaluate the accuracy of all SNP loci. In order to evaluate the sensitivity and specificity of each SNP calling pipeline, we compared the SNP array genotypes with the genotypes of SNP loci in the array detected by sequencing pipelines with different input read depths, and regarded the array genotyping as the reference data set which were distributed evenly throughout the whole chicken genome.”.

Line 318 to 319 – Please, add the “high ratio” value same as you did to the low. In addition, use > and < if possible.

Response:

Line 318-319: change “A high Ti/Tv ratio” to “A high Ti/Tv ratio (> 2.0)”

Line 320-322 – Please, you should be more straight forward and explore better this last paragraph using your results. First of all, these “validation” using the SNP panel was performed comparing with your 16 individuals unregard to the X coverage? No, I see you have compared all the possible scenarios. Please, explore it. Look:

In our study, although pipeline X has a higher or lower ratio or etc, etc., all the xxx ratios fall in the range of XXXX, which can be considered as “??””( High accurate?). Moreover, no significant (Pvalue<=???) differences in the ratios were observed among the pipelines used in this study??? And about among different coverages??

Here you really must point to the readers that although all pipelines have defined good accuracy by the literature...your study indicates that in some situations you can have a better accuracy (is that the case?). This accuracy is dependent of the coverage? the used pipeline? Please, explore it better.

Response:

In our study, we calculated the Ti/Tv ratios of each pipeline in different input read depths, however, all Ti/Tv values are between 2.04 and 2.44. The expected Ti/Tv ratios in whole-genome sequencing are 2.10 and 2.07 for known and novel variants, respectively in human as Liu et al. reported, but it has not been reported in chickens. The Ti/Tv ratios of seven SNP calling pipelines in our study are greater than 2.0 with no significance. All seven SNP calling pipelines perform well in this index and the Ti/Tv ratios does not account for the excellence of each tool.

Line 267:insert a new sentence “No significant (P <=0.05) differences in the ratios were observed among the pipelines with the same input read depths, and among different coverages using the same pipelines in this study.” between “2.44.” and “The”.

Line 320-322: replace the sentence “In the present study, all Ti/Tv ratios fall in the range of 2.04-2.44 (Fig 6, S8 Table), and we cannot conclude from these data that there are significant differences in the SNP accuracy of different pipelines” with “In our study, although each pipeline has a higher or lower value of the Ti/Tv ratio in each different input read depth, all the Ti/Tv ratios fall in the range of 2.04-2.44 (Fig 6, S8 Table), which can be considered as high accurate [42]. Moreover, the Ti/Tv ratio of each pipeline except 16GT approach slowly to around 2.3 with the increase of input read depth (Fig 6, S8 Table), and we speculate that the Ti/Tv = 2.3 could be a genome-wide approximation of chicken in this study.”

In addition, according to editor’s comments, we also made the following changes:

Line 5: delete “Wenpeng Han,2”

Line 9: delete “2 Beijing Huadu Yukou Poultry Industry Co. Ltd., Beijing 101206, China”

Line 12-13: replace “*Corresponding author: zjbhg@126.com Telephone number: +86-10-62734828” with “*Corresponding author E-mail: zjbhg@126.com (HB)”.

Line 14-15: delete “Address: Room 437, Animal Science Building, NO.2 Yuanmingyuan West Road, Haidian District, Beijing 100193, China”

Line 363-366: delete “Funding This study was supported by the Modern Agricultural Industry Technology System of China [grant number CARS-40]. The funder did not play any role in the design of the study, collection, analysis, interpretation of data or writing the manuscript.”

Line 371, 373, 375 and 376: delete “, Wenpeng Han”

Line 378: replace “Not applicable” with “We wish to thank Wenpeng Han for his support in our work and valuable feedback on this manuscript”

Attachment

Submitted filename: Responses to Reviewers.docx

Decision Letter 1

Shu-Biao Wu

30 Dec 2021

Comparison of seven SNP calling pipelines for the next-generation sequencing data of chickens

PONE-D-21-09642R1

Dear Dr. Bao,

We’re pleased to inform you that your manuscript has been judged scientifically suitable for publication and will be formally accepted for publication once it meets all outstanding technical requirements.

Within one week, you’ll receive an e-mail detailing the required amendments. When these have been addressed, you’ll receive a formal acceptance letter and your manuscript will be scheduled for publication.

An invoice for payment will follow shortly after the formal acceptance. To ensure an efficient process, please log into Editorial Manager at http://www.editorialmanager.com/pone/, click the 'Update My Information' link at the top of the page, and double check that your user information is up-to-date. If you have any billing related questions, please contact our Author Billing department directly at authorbilling@plos.org.

If your institution or institutions have a press office, please notify them about your upcoming paper to help maximize its impact. If they’ll be preparing press materials, please inform our press team as soon as possible -- no later than 48 hours after receiving the formal acceptance. Your manuscript will remain under strict press embargo until 2 pm Eastern Time on the date of publication. For more information, please contact onepress@plos.org.

Kind regards,

Shu-Biao Wu, PhD

Academic Editor

PLOS ONE

Additional Editor Comments (optional):

Reviewers' comments:

Reviewer's Responses to Questions

Comments to the Author

1. If the authors have adequately addressed your comments raised in a previous round of review and you feel that this manuscript is now acceptable for publication, you may indicate that here to bypass the “Comments to the Author” section, enter your conflict of interest statement in the “Confidential to Editor” section, and submit your "Accept" recommendation.

Reviewer #1: All comments have been addressed

**********

2. Is the manuscript technically sound, and do the data support the conclusions?

The manuscript must describe a technically sound piece of scientific research with data that supports the conclusions. Experiments must have been conducted rigorously, with appropriate controls, replication, and sample sizes. The conclusions must be drawn appropriately based on the data presented.

Reviewer #1: Yes

**********

3. Has the statistical analysis been performed appropriately and rigorously?

Reviewer #1: Yes

**********

4. Have the authors made all data underlying the findings in their manuscript fully available?

The PLOS Data policy requires authors to make all data underlying the findings described in their manuscript fully available without restriction, with rare exception (please refer to the Data Availability Statement in the manuscript PDF file). The data should be provided as part of the manuscript or its supporting information, or deposited to a public repository. For example, in addition to summary statistics, the data points behind means, medians and variance measures should be available. If there are restrictions on publicly sharing data—e.g. participant privacy or use of data from a third party—those must be specified.

Reviewer #1: (No Response)

**********

5. Is the manuscript presented in an intelligible fashion and written in standard English?

PLOS ONE does not copyedit accepted manuscripts, so the language in submitted articles must be clear, correct, and unambiguous. Any typographical or grammatical errors should be corrected at revision, so please note any specific errors here.

Reviewer #1: (No Response)

**********

6. Review Comments to the Author

Please use the space provided to explain your answers to the questions above. You may also include additional comments for the author, including concerns about dual publication, research ethics, or publication ethics. (Please upload your review as an attachment if it exceeds 20,000 characters)

Reviewer #1: The authors adequately answered all my questions and responded to all my suggestions. my only concern is where the data may be found? Please, provide an URL or more details, I could not find/access the provided DB.

In addition, I would like to add that my role as reviewer is not to ensure that the grammar or language style is impeccable.

**********

7. PLOS authors have the option to publish the peer review history of their article (what does this mean?). If published, this will include your full peer review and any attached files.

If you choose “no”, your identity will remain anonymous but your review may still be made public.

Do you want your identity to be public for this peer review? For information about this choice, including consent withdrawal, please see our Privacy Policy.

Reviewer #1: No

Acceptance letter

Shu-Biao Wu

21 Jan 2022

PONE-D-21-09642R1

Comparison of seven SNP calling pipelines for the next-generation sequencing data of chickens

Dear Dr. Bao:

I'm pleased to inform you that your manuscript has been deemed suitable for publication in PLOS ONE. Congratulations! Your manuscript is now with our production department.

If your institution or institutions have a press office, please let them know about your upcoming paper now to help maximize its impact. If they'll be preparing press materials, please inform our press team within the next 48 hours. Your manuscript will remain under strict press embargo until 2 pm Eastern Time on the date of publication. For more information please contact onepress@plos.org.

If we can help with anything else, please email us at plosone@plos.org.

Thank you for submitting your work to PLOS ONE and supporting open access.

Kind regards,

PLOS ONE Editorial Office Staff

on behalf of

Dr. Shu-Biao Wu

Academic Editor

PLOS ONE

Associated Data

    This section collects any data citations, data availability statements, or supplementary materials included in this article.

    Supplementary Materials

    S1 Table. The genotyped results of the Illumina 50 K SNP Beadchip.

    (XLS)

    S2 Table. The sequencing results of 16 Rhode Island Red chickens.

    (XLSX)

    S3 Table. The coverage and alignment rate of each sample.

    (XLSX)

    S4 Table. The total number of SNPs called out by each pipeline in different input depths.

    (XLSX)

    S5 Table. The call rate results of array.

    (XLSX)

    S6 Table. The sensitivity of each pipeline in different input depths.

    (XLSX)

    S7 Table. The specificity of each pipeline in different input depths.

    (XLSX)

    S8 Table. The Ti/Tv ratios of 7 pipelines.

    (XLSX)

    S1 Word. SNP calling pipelines for chicken NGS sets.

    (DOCX)

    Attachment

    Submitted filename: Responses to Reviewers.docx

    Data Availability Statement

    The DNA sequencing and genotyping data for this study can be downloaded from the China National GeneBank (Accession numbers: CNP0001419 and CNP0001435).


    Articles from PLoS ONE are provided here courtesy of PLOS

    RESOURCES