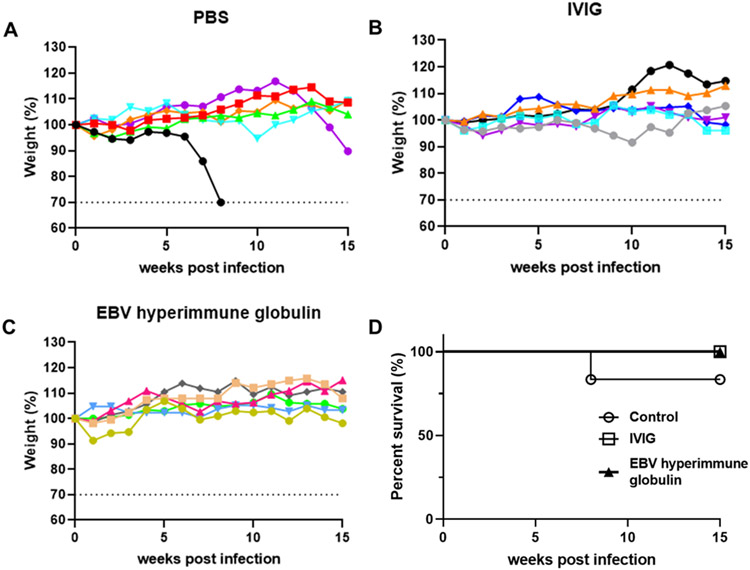
Fig. 3. Changes of weight and survival rate for mice receiving IVIG, EBV hyperimmune globulin, or PBS and challenged with EBV.
Percentage weights relative to initial weights (set at 100%) are plotted for mice that received PBS control (A), IVIG (B), or EBV hyperimmune globulin (C). Each line represents one animal and dotted lines indicate study end point 30% weight loss. Survival rates were plotted for each group of mice up to week 15 after infection (D).

